

Hydrogen sulfide (H2S), well known for its unpleasant rotten egg smell, was traditionally considered as a toxic gas. However, recent studies have demonstrated that hydrogen sulfide is an endogenously produced gaseous signaling compound (gasotransmitter) with importance on par with that of the other two known endogenous gasotransmitters, nitric oxide (NO)[1] and carbon monoxide (CO).[2] H2S has been recognized for mediating a wide range of physiological effects. Studies have shown that H2S can have an effect on the cardiovascular system[3] by acting as a K-ATP channel opener.[4] Several studies have shown the protective roles of H2S, in situations such as myocardial ischemia, most likely through a combination of antioxidant and anti-apoptotic signaling.[5] Further studies also showed that H2S may be a therapeutic benefit for the treatment of ischemia-induced heart failure.[6-7] It is also a modulator in the central nervous system,[8-10] respiratory system, gastrointestinal system, and endocrine system.[11] It seems that hydrogen sulfide exhibits almost all the beneficial effects of NO without generating the toxic reactive oxygen species (ROS). In contrast, it also acts as an anti-oxidant or scavenger of ROS. Furthermore, research has indicated that hydrogen sulfide level is related to diseases such as Down syndrome[12] and Alzheimer’s disease.[13] Therefore, recent years have seen a steady increase in the interest in understanding hydrogen sulfide ’s physiological and pathological functions.[11, 14-15] One significant limiting factor in studying hydrogen sulfide is the lack of sensors and agents that allow for its rapid and accurate detection. There have been literature methods using colorimetric,[16-18] electrochemical analysis[19-21] and gas chromatography.[22-23] However, hydrogen sulfide catabolism is known to be fast, which could result in continuous fluctuation in its concentration, leading to difficulties in accurate analysis of this important molecule. Current methods do not allow for fast, accurate, and real-time determinations. Literature reported endogenous sulfide concentrations vary substantially among publications with most publications suggesting that sulfide concentration in blood is in the 10-100 μM range.[24-29] There are other studies suggesting sulfide concentration being much lower than this.[30-31] Therefore, there is an urgent need for the development of new methods for the efficient detection of sulfide in biological systems.
With the idea of developing a new method that will be useful for rapid assay of hydrogen sulfide concentrations under physiological conditions, we undertook the effort of searching for a selective chemosensing agent for hydrogen sulfide. For easy use in a biology lab, the chemosensing agent should (1) act fast (within seconds) under mild conditions, (2) be chemically stable for long-term storage, (3) be sensitive for detection under near physiological conditions, (4) show a linear concentration-signal relationship within physiologically relevant hydrogen sulfide concentration ranges for easy quantitation, (5) show minimal or no interference by other anions in the blood serum, and (6) be functional in aqueous solutions and blood plasma. Herein we report the development of a fluorescent chemoprobe and its application in the determination of hydrogen sulfide in aqueous solution, serum and whole blood.
Fluorescence is one of the most sensitive detection methods. Thus we were interested in selecting a fluorophore, which has a high quantum yield, emits at a long wavelength, and responds to hydrosulfide by fluorescent property changes. Dansyl is a commonly used fluorophore, and well known for its strong fluorescence and long emission wavelength. We were interested in designing a sulfide-sensitive agent using this fluorophore by taking advantage of the known unique reduction of an azido group by hydrogen sulfide.[32] We reasoned that the reduction of an azido group attached to a strongly electron-withdrawing group would occur at an accelerated rate. Because of the difference in electronegativity of the azido and amino groups and the added degree of rotational freedom for the azido group, reduction of sulfonyl azide into sulfonamide should trigger a change in the electronic properties and thus the fluorescent properties of the dansyl moiety.[33] Therefore we synthesized dansyl-azide (DNS-Az, 2, Scheme 1).[34]
Scheme 1.
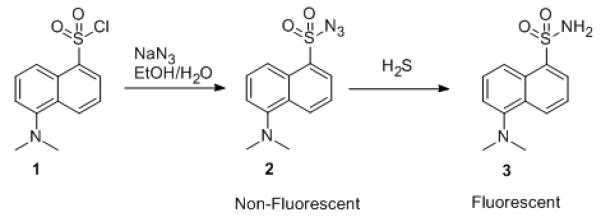
DNS-Az (2) as a fluorescent probe for sulfide
DNS-Az (2) by itself is non-fluorescent. However, upon addition of hydrogen sulfide DNS-Az solution showed a strong fluorescence enhancement, as expected (Na2S was used as a hydrogen sulfide source in all experiments). The addition of 25 μM of hydrogen sulfide led to a 40-fold fluorescence enhancement in 20 mM sodium phosphate buffer (pH 7.5) with 0.5% Tween-20 (Buffer/Tween). The detection limit was as low as 1 μM with a signal-to-noise ratio (S/N) of 3:1. HPLC, MS and NMR analysis confirmed that the fluorescence increase was due to the formation of dansyl-amide (3, Scheme 1, see supporting information for spectral data).
In order to study the selectivity of this chemoprobe for sulfide, the fluorescent properties of DNS-Az (2) in the presence of various anions were examined in buffer/Tween. No comparable response was observed from other anions (Figure 1). Since the detection is based on the reducing property of sulfide, other possible reducing anions, such as iodide, bromide, fluoride, bisulfite, and thiosulfate, were also tested. Totally 18 anions were screened, no obvious response was observed for most of the anions at 1 mM, a concentration that is 40 fold higher than that of sulfide. The same results were observed for Cl− at 150 mM, HCO3− and citrate at 100 mM, which are equal or higher than the physiological concentration of these anions. None of the other anions should have a concentration of higher than 1 mM under normal physiological conditions. Among all the anions, only HSO3−, S2O42-, and S2O52- led to some fluorescent intensity increases. However, the extent of the fluorescence increase was far smaller than those caused by sulfide even when the concentrations of those anions were 4-fold higher than that of sulfide (Figure 2b, for details please see supporting information, Figure S5). The response of DNS-Az (2) to other reducing agents, such as thiophenol, benzyl mercaptan and cysteine were also tested. Benzyl mercaptan was the only one that showed strong enough responses (about 1/5 of that of sulfide, Figure S11), which could pose an interfering problem. However, since benzyl mercaptan is rarely found in biological systems, this should not be a practical issue. DNS-Az was also found to be recalcitrant to the possible displacement reaction resulting from attack by an amino group. It showed very limited response to glycine and lysine at concentrations as high as 50 mM (Figure S12).
Figure 1.

a. Comparison of fluorescence intensity changes of DNS-Az (2) solution with the addition of sulfide and other anions; b. Fluorescence spectra of DNS-Az (2) upon addition of various anions (DNS-Az 100 μM, Cl− 150 mM, HCO3−, citrate 100 mM, HSO3− S2O42-, and S2O52- 100 μM; HS− 25 μM, all other anions 1 mM in 20 mM sodium phosphate buffer (pH 7.5) with 0.5% Tween-20, λex= 340 nm). Anions tested: Cl−, Br−, I−, F−, OH−, OAc−, CN−, N3−, NO2−, HCO3−, HSO3−, SO42-, S2O32-, S2O42-, S2O52-, HPO42-, citrate.
Figure 2.

Hydrogen sulfide concentration dependent fluorescence intensity changes, determined using 96-well plates: DNS-Az 200 μM, Na2S 0-100 μM in commercial bovine serum and buffer/Tween (excitation filter 340 nm, emission filter 535 nm)
A linear relationship is always important for easy and accurate analysis. Thus, hydrogen sulfide concentration-dependent study was performed using both fluorometer and micro-plate reader. DNS-Az (2) reacts with sulfide essentially quantitatively even in aqueous solution. The fluorescence intensity showed a reproducible linear relationship in buffer/Tween against hydrogen sulfide (Figure 2). When sulfide concentration is higher than that of DNS-Az (2), the plot was found to reach a plateau (see supporting information Figure S9), which means that the stoichiometry of this reaction was 1:1.
Thus far, all the selectivity and linearity studies suggest that DNS-Az (2) can be used for the determination of sulfide concentrations in a biological sample. For a further test, DNS-Az (2) was evaluated in commercially available bovine serum. Upon addition of sulfide, the solution of 2 also showed very significant fluorescent intensity increases. Though bovine serum showed background fluorescence (Figure 3 and S8, 0s), it was negligible compared to the strong fluorescence of dansyl amide (3) generated from the reaction (Figure 3). It should be noted that the reaction went very fast in bovine serum (complete within seconds, Figure 3 and S8). This is very important considering the fast metabolism and evaporation of hydrogen sulfide in biological systems. This unprecedented fast response could provide the possibility of quantitative detection without any pre-treatment of samples. The reaction time profile was studied in different solvent systems (Figure S6 and S7).
Figure 3.

Reaction time profile of DNS-Az (2) and hydrogen sulfide (DNS-Az 100 μM, H2S 30 μM in bovine serum)
An excellent linear relationship was also obtained in bovine serum (Figure 2). The standard curve covers the range of reported endogenous levels of hydrogen sulfide, indicating that this probe is very suitable for the detection of sulfide in biological samples. Due to the changes in the microenvironment and the viscosity of the medium, fluorescence intensity and emission wavelength is different when using different medium. For the samples that the medium is not readily available for calibration curve generation, a standard addition procedure could be used for accurate measurement. Overall, the results suggest that the anions and biological substrates normally encountered in the blood do not pose a problem in the quantitative detection of sulfide in a biological sample.
Encouraged by the promising results obtained in phosphate buffer and bovine serum, we applied this fluorescent chemoprobe to the determination of hydrogen sulfide concentrations in blood using C57BL6/J mouse model (Figure 4 and S3), which we have been using in other related studies. A standard addition (internal spiking) procedure was used in the experiment. Five mice were used in this study (Table 1). The average sulfide concentration in these five mice was 31.9 ± 9.4 μM, very similar to previous reported values in mouse plasma (34.1 μM).[27] This has confirmed that our fluorescent chemoprobe can indeed be used into the detection of hydrogen sulfide in real biological samples and the result is comparable with those obtained using current method.
Figure 4.

An example of hydrogen sulfide concentration determination in blood using C57BL6/J mice (n=5), determined using 96-well plates (DNS-Az 200 μM, excitation filter 360 nm, emission filter 528 nm). Zero point was obtained by trapping sulfide with ZnCl2 and calibration curve was obtained by using an internal standard method. (Hydrogen sulfide 0, x, x+10, x+50 and x+100 μM)
Table 1.
Measurement of hydrogen sulfide in mouse blood
| Subject # | H2S (μM) |
|---|---|
| 1 | 25.0 |
| 2 | 30.2 |
| 3 | 26.1 |
| 4 | 48.4 |
| 5 | 28.9 |
| Average | 31.9 ± 9.4 |
In conclusion, a novel reduction-sensitive fluorescence chemoprobe was developed for hydrogen sulfide in aqueous solutions, including blood serum and whole blood. The probe was found to be very selective for sulfide among 18 anions tested and other common reducing species, with a detection limit of 1 μM in buffer/Tween and 5 μM in bovine serum with a signal-to-noise ratio of 3:1. The linear relationship obtained in bovine serum covers the reported endogenous concentration range of hydrogen sulfide. The probe was used in the detection of hydrogen sulfide in mouse blood using C57BL6/J mice model. The result (31.9 ± 9.4 μM) was very close to the previously reported serum concentration of hydrogen sulfide. In addition, the simplicity and ease in measurements and the compatibility of this probe to 96-well plates and a micro-plate reader, which are readily accessible in biology labs, has made this agent extremely easy to use. Hydrogen sulfide level in the biological system is tightly regulated and can experience rapid changes in concentration. The unprecedented fast response by DNS-Az (2) to hydrogen sulfide allows it to be used for the detection of transient changes in sulfide levels without sample pre-treatment. The probe, DNS-Az (2), is simple in structure, very easy to synthesize, stable and amenable to long-term storage. A new research field has emerged in the past decade because of the newly recognized significance of hydrogen sulfide as an endogenous gasotransmitter. The molecular mechanism of sulfide’s cellular actions remains to be understood, and novel H2S releasing drugs need to be developed. We feel that this fast, selective, efficient and low-cost detection method for sulfide will be very useful in the booming research field of hydrogen sulfide.
Supplementary Material
Footnotes
We gratefully acknowledge the financial support of this work by the Molecular Basis of Disease Program at Georgia State University through fellowships to H.P. and Y.C., the NIH (GM084933) grant to B.W.; NIH (5R01HL092141-03 and 5R01HL093579-02) grant to D.J.L and to A.L.K (NIH 3K12GM000680-10S1 FIRST Fellowship Program) as well as funds from the Carlyle Fraser Heart Center of Emory University Hospital Midtown.
References
- [1].Culotta E, Koshland DE. Science. 1992;258:1862. doi: 10.1126/science.1361684. [DOI] [PubMed] [Google Scholar]
- [2].Morita T, Perrella MA, Lee ME, Kourembanas S. P. Natl. Acad. Sci. U. S. A. 1995;92:1475. doi: 10.1073/pnas.92.5.1475. [DOI] [PMC free article] [PubMed] [Google Scholar]
- [3].Lefer DJ. P. Natl. Acad. Sci. U. S. A. 2007;104:17907. doi: 10.1073/pnas.0709010104. [DOI] [PMC free article] [PubMed] [Google Scholar]
- [4].Zhao WM, Zhang J, Lu YJ, Wang R. EMBO J. 2001;20:6008. doi: 10.1093/emboj/20.21.6008. [DOI] [PMC free article] [PubMed] [Google Scholar]
- [5].Calvert JW, Jha S, Gundewar S, Elrod JW, Ramachandran A, Pattillo CB, Kevil CG, Lefer DJ. Circ. Res. 2009;105:365. doi: 10.1161/CIRCRESAHA.109.199919. [DOI] [PMC free article] [PubMed] [Google Scholar]
- [6].Calvert JW, Elston M, Nicholson CK, Gundewar S, Jha S, Elrod JW, Ramachandran A, Lefer DJ. Circulation. 2010;122:11. doi: 10.1161/CIRCULATIONAHA.109.920991. [DOI] [PMC free article] [PubMed] [Google Scholar]
- [7].Elrod JW, Calvert JW, Morrison J, Doeller JE, Kraus DW, Tao L, Jiao XY, Scalia R, Kiss L, Szabo C, Kimura H, Chow CW, Lefer DJ. P. Natl. Acad. Sci. U. S. A. 2007;104:15560. doi: 10.1073/pnas.0705891104. [DOI] [PMC free article] [PubMed] [Google Scholar]
- [8].Abe K, Kimura H. J. Neurosci. 1996;16:1066. doi: 10.1523/JNEUROSCI.16-03-01066.1996. [DOI] [PMC free article] [PubMed] [Google Scholar]
- [9].Boehning D, Snyder SH. Annu. Rev. Neurosci. 2003;26:105. doi: 10.1146/annurev.neuro.26.041002.131047. [DOI] [PubMed] [Google Scholar]
- [10].Kimura H. Mol. Neurobiol. 2002;26:13. doi: 10.1385/MN:26:1:013. [DOI] [PubMed] [Google Scholar]
- [11].Martelli A, Testai L, Breschi MC, Blandizzi C, Virdis A, Teddei S, Calderone V. Med. Res. Rev. 2011 doi: 10.1002/med.20234. [DOI] [PubMed] [Google Scholar]
- [12].Kamoun P, Belardinelli M-C, Chabli A, Lallouchi K, Chadefaux-Vekemans B. Am. J. Med. Genet. 2003;116A:310. doi: 10.1002/ajmg.a.10847. [DOI] [PubMed] [Google Scholar]
- [13].Eto K, Asada T, Arima K, Makifuchi T, Kimura H. Biochem. Biophys. Res. Comm. 2002;293:1485. doi: 10.1016/S0006-291X(02)00422-9. [DOI] [PubMed] [Google Scholar]
- [14].Moore PK, Bhatia M, Moochhala S. Trends Pharmacol. Sci. 2003;24:609. doi: 10.1016/j.tips.2003.10.007. [DOI] [PubMed] [Google Scholar]
- [15].Wang R. FASEB J. 2002;16:1792. doi: 10.1096/fj.02-0211hyp. [DOI] [PubMed] [Google Scholar]
- [16].Lei W, Dasgupta PK. Anal. Chim. Acta. 1989;226:165. [Google Scholar]
- [17].Hughes MN, Centelles MN, Moore KP. Free Radical Bio.Med. 2009;47:1346. doi: 10.1016/j.freeradbiomed.2009.09.018. [DOI] [PubMed] [Google Scholar]
- [18].Jimenez D, Martinez-Manez R, Sancenon F, Ros-Lis JV, Benito A, Soto J. J. Am. Chem. Soc. 2003;125:9000. doi: 10.1021/ja0347336. [DOI] [PubMed] [Google Scholar]
- [19].Doeller JE, Isbell TS, Benavides G, Koenitzer J, Patel H, Patel RP, Lancaster JR, Darley-Usmar VM, Kraus DW. Anal. Biochem. 2005;341:40. doi: 10.1016/j.ab.2005.03.024. [DOI] [PubMed] [Google Scholar]
- [20].Searcy DG, Peterson MA. Anal. Biochem. 2004;324:269. doi: 10.1016/j.ab.2003.09.037. [DOI] [PubMed] [Google Scholar]
- [21].Richardson CJ, Magee EAM, Cummings JH. Clin. Chim. Acta. 2000;293:115. doi: 10.1016/s0009-8981(99)00245-4. [DOI] [PubMed] [Google Scholar]
- [22].Radfordknoery J, Cutter GA. Anal. Chem. 1993;65:976. [Google Scholar]
- [23].Berube PR, Parkinson PD, Hall ER. J. Chromatogr. A. 1999;830:485. [Google Scholar]
- [24].Hyspler Radomir, Ticha Alena, Indrova Monika, Zadak Zdenek, Hysplerova Lidmila, Gasparic Jiri, Churacek J. J. Chromatogr. B. 2002;770:255. doi: 10.1016/s1570-0232(01)00632-8. [DOI] [PubMed] [Google Scholar]
- [25].Chen Y-H, Yao W-Z, Geng B, Ding Y-L, Lu M, Zhao M-W, Tang C-S. Chest. 2005;128:3205. doi: 10.1378/chest.128.5.3205. [DOI] [PubMed] [Google Scholar]
- [26].Jiang H, Wu H, Li Z, Geng B, Tang C. J. First Mil. Med. Univ. 2005;25:951. [PubMed] [Google Scholar]
- [27].Li L, Bhatia M, Zhu YZ, Ramnath RD, Wang ZJ, Anuar FBM, Whiteman M, Salto-Tellez M, Moore PK. FASEB J. 2005;19:1196. doi: 10.1096/fj.04-3583fje. [DOI] [PubMed] [Google Scholar]
- [28].Goodwin LR, Francom D, Dieken FP, Taylor JD, Warenycia MW, Reiffenstein RJ, Dowling G. J Anal. Toxicol. 1989;13:105. doi: 10.1093/jat/13.2.105. [DOI] [PubMed] [Google Scholar]
- [29].Savage JC, Gould DH. J. Chromatogr. Biomed. 1990;526:540. doi: 10.1016/s0378-4347(00)82537-2. [DOI] [PubMed] [Google Scholar]
- [30].Whitfield NL, Kreimier EL, Verdial FC, Skovgaard N, Olson KR. Am. J. Physiol.-Reg. I. 2008;294:R1930. doi: 10.1152/ajpregu.00025.2008. [DOI] [PubMed] [Google Scholar]
- [31].Furne J, Saeed A, Levitt MD. Am. J. Physiol.-Reg. I. 2008;295:R1479. doi: 10.1152/ajpregu.90566.2008. [DOI] [PubMed] [Google Scholar]
- [32].Kazemi F, Kiasat AR, Sayyahi S. Phosphorus, Sulfur, and Silicon. 2004;179:1813. [Google Scholar]
- [33].de Silva AP, Gunaratne HQN, Gunnlaugsson T, Huxley AJM, McCoy CP, Rademacher JT, Rice TE. Chem. Rev. 1997;97:1515. doi: 10.1021/cr960386p. [DOI] [PubMed] [Google Scholar]
- [34].Takadate A, Tahara K, Fujino H, Goya S. YakuGaku Zasshi. 1986;106:36. [Google Scholar]
Associated Data
This section collects any data citations, data availability statements, or supplementary materials included in this article.