Abstract
Blood is modeled as a suspension of red blood cells using the dissipative particle dynamics method. The red blood cell membrane is coarse-grained for efficient simulations of multiple cells, yet accurately describes its viscoelastic properties. Blood flow in microtubes ranging from 10 to 40 μm in diameter is simulated in three dimensions for values of hematocrit in the range of 0.15–0.45 and carefully compared with available experimental data. Velocity profiles for different hematocrit values show an increase in bluntness with an increase in hematocrit. Red blood cell center-of-mass distributions demonstrate cell migration away from the wall to the tube center. This results in the formation of a cell-free layer next to the tube wall corresponding to the experimentally observed Fahraeus and Fahraeus–Lindqvist effects. The predicted cell-free layer widths are in agreement with those found in in vitro experiments; the results are also in qualitative agreement with in vivo experiments. However, additional features have to be taken into account for simulating microvascular flow, e.g., the endothelial glycocalyx. The developed model is able to capture blood flow properties and provides a computational framework at the mesoscopic level for obtaining realistic predictions of blood flow in microcirculation under normal and pathological conditions.
Keywords: apparent viscosity, red blood cell, blood flow resistance, dissipative particle dynamics
INTRODUCTION
Blood is a physiological fluid that consists of erythrocytes or RBCs, leukocytes or WBCs, platelets, and plasma containing various molecules and ions. Its main functions are the transport of oxygen and nutrients to cells of the body, removal of waste products such as carbon dioxide and urea, and circulation of molecules and cells that mediate the organism’s defense and immune response and play a fundamental role in the tissue repair process. RBCs constitute approximately 45% of the total blood volume, WBCs around 0.7%, and the rest is taken up by blood plasma and its substances. Under healthy conditions human RBCs have a biconcave shape of approximately 8 μm in diameter and are highly deformable, which allows them to pass through narrow capillaries with a diameter several times smaller than the RBC size. Due to a high volume fraction of RBCs, the rheological properties of blood are mainly determined by the RBC properties.
In vitro experiments [11,28,30] of blood flow in glass tubes with diameters ranging from 3–4 to 1,000 μm have shown a dependence of the apparent blood viscosity on the tube diameter, RBC volume fraction or hematocrit, cell aggregability, and flow rate. In tubes with diameters larger than 500–600 μm blood can be assumed to be a nearly Newtonian fluid with a constant effective viscosity, whereas in smaller tubes it shows complex rheological behavior. The apparent blood viscosity reaches its minimum at the tube diameter of about 7 μm and shows a significant increase with respect to this minimum as the tube diameter decreases or increases.
An increase of the apparent viscosity with increasing tube diameter is known as the Fahraeus–Lindqvist effect [11]. This effect is attributed to a cross-stream migration of RBCs in tube flow leading to the formation of two phases [3,16]: a flow core consisting mainly of RBCs and a CFL or a cell-depleted layer next to the tube wall devoid or depleted of cells. The CFL has a lower viscosity in comparison with the RBC core and serves as a lubrication layer reducing the effective blood viscosity [3,26]. The cross-stream migration of RBCs in tube flow is governed by cell-wall hydrodynamic interactions, which drive the cells away from the wall, and by cell–cell hydrodynamic interactions, which tend to disperse RBCs [15]. The CFL formed by cell migration depends on the tube diameter, the hematocrit value, and the flow rate, and is correlated with the apparent blood viscosity such that increasing the CFL thickness reduces the apparent viscosity of blood.
In vivo experiments [20,22,27] of blood perfused through microvessels have shown that the Fahraeus–Lindqvist effect is mediated by a CFL formed next to the vessel walls. However, blood flow resistance in microvessels in vivo is markedly higher than that in microtubes [29,36]. Microvessels in comparison with glass tubes are elastic, lined with endothelium, relatively short, and may be irregular in shape. These differences are likely to attenuate RBC migration resulting in a decreased CFL and an increased effective viscosity. In addition, special features of the vessel walls (e.g., geometry, glycocalyx layer) may contribute to spatial variations of the CFL that tend to diminish the effect of the CFL on the apparent blood viscosity [33].
Computational modeling of blood flow in microtubes or microvessels is challenging as a homogeneous continuum description is not adequate due to the motion of individual deformable cells. However, there exist several inhomogeneous continuum approaches to model blood flow in microvessels including the inhomogeneous continuum model of [24] and the two-phase fluid model [33], where two fluids with different viscosities represent the RBC flow core and the CFL, respectively. Several computational approaches to model blood flow as a suspension of cells have recently been developed. These include two-dimensional models [1,34] and three-dimensional simulations [7,21,23]. Even though two-dimensional models may qualitatively capture the behavior of an RBC suspension, their quantitative predictions have to be considered cautiously, as RBC motion and deformation in a flow are inherently three-dimensional. Three-dimensional modeling of an RBC suspension is limited due to computational expense such that the number of cells modeled in Refs. [21,23] was on the order of O(10). Dupin et al. [7] were able to simulate blood flow in microchannels with a characteristic size up to 30 μm employing O(102) RBCs. We have developed an efficient parallel code that employs the multiscale RBC model described in Refs. [13,14]. This code allows us to simulate the total number of RBCs on the order of O(104) at reasonable computational cost.
The study is organized as follows. The next section presents details of the multiscale RBC model. The following section contains results of simulations of blood flow in tubes with diameters ranging from 10 to 40 μm for different hematocrit values. Flow velocity profiles, the Fahraeus– Lindqvist effect, flow resistance, and the corresponding CFLs will be examined and compared with available experiments. Finally, we conclude with a brief discussion.
METHODS AND MODELS
RBCs and their enclosing and surrounding fluids are modeled within the DPD method framework [19]. DPD is a mesoscopic particle-based simulation technique, where each particle represents a cluster of atoms or molecules rather than an individual atom. A detailed description of the DPD method can be found in Appendix S1.
RBC Membrane
The RBC membrane is represented by Nv DPD particles with coordinates {xi=1…Nv}, which are vertices of a two-dimensional triangulated network on the RBC surface [6,13]. The network nodes are connected by Ns springs with the potential energy as follows:
| (1) |
where lj is the length of the spring j, lm is the maximum spring extension, xj = lj/lm, p is the persistence length, kBT is the energy unit, kp is the spring constant, and n is a power. The above equation includes the attractive wormlike chain potential and a repulsive potential for n > 0 such that a nonzero equilibrium spring length can be imposed.
To incorporate the membrane viscosity into the RBC model, a dissipative force is introduced for each spring. Following the general framework of the fluid particle model [9], we can define dissipative and random forces for each spring, which satisfy the fluctuation–dissipation balance providing consistent temperature of the RBC membrane in equilibrium. The forces are given by
| (2) |
| (3) |
where γT and γC are dissipative parameters, vij is the relative velocity of spring ends, eij is the unit vector along the spring, tr[dWij] is the trace of a random matrix of independent Wiener increments dWij, and is the traceless symmetric part.
The bending resistance of the RBC membrane is modeled by
| (4) |
where kb is the bending constant, θj is the instantaneous angle between two adjacent triangles having the common edge j, and θ0 is the spontaneous angle.
In addition, the RBC model includes the area and volume conservation constraints, which mimic area-incompressibility of the lipid bilayer and incompressibility of the interior fluid, respectively. The corresponding energy is given by
| (5) |
where Nt is the number of triangles in the membrane network, A0 is the triangle area, and kd, ka and kv are the local area, global area, and volume constraint coefficients, respectively. The terms A and V are the total RBC area and volume, whereas and are the specified total area and volume, respectively. More details on the RBC model can be found in Refs. [12,13], including aspects of coarse-graining of RBCs by varying Nv from the spectrin level (about 30,000 points) to the coarsest level (100 points); most of the simulations here were performed with 500 points.
Membrane Macroscopic Properties
The relation of the parameters of triangulated surface models of membranes to the macroscopic parameters (shear, area-compression, and Young’s moduli) of the elasticity theory has been previously discussed in Refs. [5,17,32]. Extension of the linear analysis of [5] for a regular hexagonal network allows us to uniquely relate the model parameters and the network macroscopic elastic properties, see References [12,13] for details. The derived shear modulus of the membrane is given by
| (6) |
where l0 is the equilibrium spring length and x0 = l0/lm. The area-compression K and Young’s Y moduli are equal to 2μ0 + ka + kd and 4Kμ0/(K + μ0), respectively.
The relation between the model bending coefficient kb and the macroscopic bending rigidity kc of the Helfrich model [18] can be derived as for a spherical membrane [12,13]. This expression describes bending contribution of the energy in Equation (4), but may not fully represent actual bending resistance of the RBC membrane as membrane bending may also result in local in-plane deformations.
The membrane shear viscosity ηm is related to the dissipative parameters γT, γC as . Here γT accounts for a large portion of viscous contribution, and hence γC is set to γT/3 in all simulations.
In practice, the given macroscopic RBC properties serve as an input to be used to calculate the necessary mesoscopic model parameters from the equations above without any manual adjustment. A simulation of an RBC in equilibrium shows that the membrane may develop local bumps due to stress anomalies in a membrane triangulation as a network on a closed surface cannot consist of triangles whose edges have the same lengths. Such local stress artifacts depend on the network regularity and the ratio of the membrane elastic and bending contributions given by the Föppl–von Kármán number , where . To eliminate the stress artifacts, we employed a “stress-free” model obtained by computational annealing. Thus, the equilibrium length of each spring is set to the edge length after triangulation for i = 1, …, Ns and the individual maximum spring extension is set to (x0 is a constant). This modification provides a network free of local stress anomalies. The necessary spring parameters (p and kp) in Equation (1) are calculated individually for each spring for given μ0 and using equation (6) and the property that the attractive wormlike-chain force is equal to the repulsive force at the equilibrium distance . The other model parameters are specified further in text.
RBC-Fluid Boundary Conditions
Both internal and external fluids are simulated by a collection of free DPD particles and are separated by the RBC membrane through bounce-back reflections at the membrane surface. Moreover, a dissipative force between fluid particles and membrane vertices is set properly to account for the no-slip boundary conditions at the membrane surface. More details on boundary conditions can be found in Appendix S1.
Scaling of Model and Physical Units
Scaling between DPD model units (M) and physical units (P) adopts the following length and time scales
| (7) |
where rM is the model unit of length, D0 is the cell diameter, and η is the characteristic viscosity (e.g., internal/external fluids or membrane). Additionally, we can define scaling of the energy per unit mass (kBT) as follows
| (8) |
RESULTS
This section presents results on the modeling of blood flow in microtubes. Blood was modeled as a suspension of RBCs using the model described above. Blood flow was simulated in tubes of diameters ranging from 10 to 40 μm. The properties of the modeled cell suspensions flowing through tubes and corresponding CFLs were evaluated for different flow rates and tube hematocrit values.
Modeling Parameters
Blood is simulated with a number of RBCs suspended in a solvent. A single fluid for both external and internal solvents was used, so that particle reflections at the membrane surface were omitted. Turning off reflections of solvent particles at the RBC membranes results in a reduction of the computational cost by approximately two to three times. To approximate membrane impenetrability by solvent particles, the DPD repulsive force between them and the membrane vertices of RBCs was employed. This does not fully guarantee separation of the internal and external fluids by the RBC membrane, but it nearly eliminates membrane crossing by solvent particles. To identify the effect of such a simplification, we have run several simulations of blood flow in small tubes (D = 10 μm) with the separation of the internal and the external fluids (through reflections), and no significant differences in the simulated blood properties with those obtained using the simplified model were found.
Suspended RBCs assumed the diameter D0 = 7.82 μm, the Young’s modulus Y0 = 18.9 μN/m, the bending rigidity 2.4 × 10⁻¹⁹ J, and the membrane viscosity ηm = 0.022 Pa·s, which were verified through a number of mechanical, rheological, and dynamics tests on a single RBC in References [13,14]. We employed the RBC model with the following parameters: , x0 = 2.2, n = 2, ka = 4,900, kd = 100, and kv = 5,000. The DPD interactions among different particle types (solvent [S] and wall [W] particles, RBC vertices [V]) are presented in Table 1.
Table 1.
DPD simulation parameters in blood flow simulations. ‘S’ and ‘W’ denote solvent and wall particles, respectively, while ‘V’ corresponds to RBC vertices. The parameters a and γ are the DPD conservative and dissipative force coefficients, rc is the cutoff raduis, and k is the exponent for the DPD envelope, see Appendix S1 for more details.
| Interaction | a | γ | rc | k(DPD envelope) |
|---|---|---|---|---|
| S–S and S–W | 4.0 | 30.0 | 1.5 | 0.25 |
| S–V, W–V | 2.0 | 45.0 | 1.5 | 0.25 |
| V–V | 100.0 | 30.0 | 0.5 | 0.25 |
The random force coefficients for different interactions were obtained using the energy unit kBT = 0.0945 calculated according to the energy scale in equation (8). The RBC volume was assumed to be slightly larger than that of the triangulated network (V0 = 92.45), as there exist repulsive interactions between solvent particles and RBC vertices resulting in a thin solvent-free layer next to the RBC membrane. The effective RBC volume was obtained from an analysis of the three-dimensional solvent distribution next to the membrane in an equilibrium simulation, and was set to V′ = 105. Thus, the cell volume fraction or tube hematocrit was calculated as follows
| (9) |
where Nc is the number of RBCs in the volume Vt = πR2L, R is the tube radius, and L is the tube length.
RBCs are represented by 500 DPD particles forming a triangulated network with the characteristic length of each edge (spring) to be approximately 0.54 μm. The solvent is simulated by a collection of free DPD particles that correspond to small fluid volumes of blood plasma. The fluid particles are “soft” volumes due to soft interparticle interactions, and their effective radius can be estimated to be approximately 100–150 nm [25]. The simulated solvent provides hydrodynamic interactions among RBCs and between RBCs and the vessel walls. However, it does not apply any restriction on the simulated spatial resolution, as two RBCs are able to come closer than the effective diameter of the solvent particles. Therefore, this method can be successfully applied for blood flow simulations with relatively high hematocrit values such as Ht = 0.45.
Two types of EV interactions among cells were considered. The first case is shown in Table 1, where the repulsive force coefficient between membrane vertices aV–V is set to 100. This method introduces a non-zero screening length between two membrane surfaces governed by the cutoff radius of the repulsive interactions rc = 0.5. Hence, the choice of a smaller cutoff radius may result in overlapping of cells, whereas a larger one would increase the screening distance between cells, which may be unphysical and may strongly affect the simulation results at high volume fractions of RBCs. The second method to enforce EV interactions among cells employed reflections of RBC vertices on the membrane surfaces of other cells. The repulsive force coefficient in this case was set to aV–V = 2 yielding the screening length between two RBC surfaces to be virtually zero. These two methods of EV interactions will be called “repulsion” and “reflection,” respectively. In addition, several simulations employed a net repulsion of RBCs from the wall by setting the repulsive force coefficient between the wall particles and the cell vertices to aW–V = 30. They employ “reflection” EV interactions and will be denoted as “wall force” further in text. This was performed to minimize the effect of near wall density fluctuations of the suspending fluid, which influences simulation results of blood flow in small tubes (e.g., D = 10 μm). The relative performance of the three methods is discussed below.
The blood flow is driven by a uniform body force per unit mass (f) applied to both solvent and RBC particles in the flow direction. Such a force application is equivalent to the pressure gradient ΔP/L = ρf, where ΔP is the pressure drop over the tube length L and ρ is the suspension’s mass density. The wall is modeled by frozen DPD particles with the same radial distribution function as the fluid particles in combination with a specular reflection of the solvent and RBC particles at the fluid–wall interface. The number densities of both solvent and wall were set to nS = nW = 3. In all simulations, we assume periodic boundary conditions along the flow.
Blood Velocity Profiles
As an initial condition, RBCs were placed randomly within the tube. After the flow was turned on, the simulations were run for a time that was long enough to achieve steady state, which was characterized by a time independent fully developed velocity profile. The time to reach steady state is equal to approximately one second in physical units. After this time, the RBC migration is considered to be fully achieved and blood flow measurements are performed.
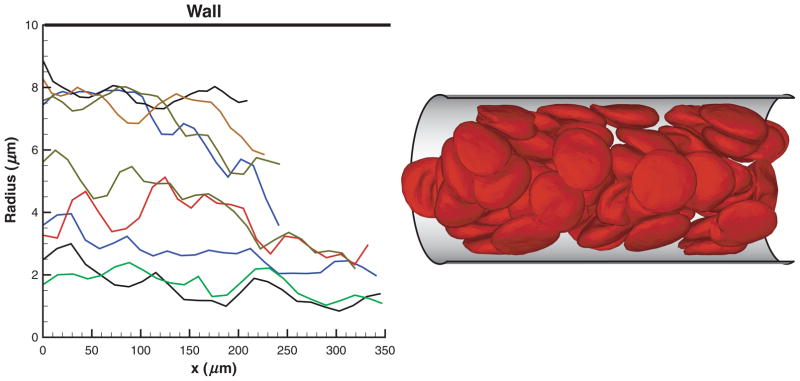
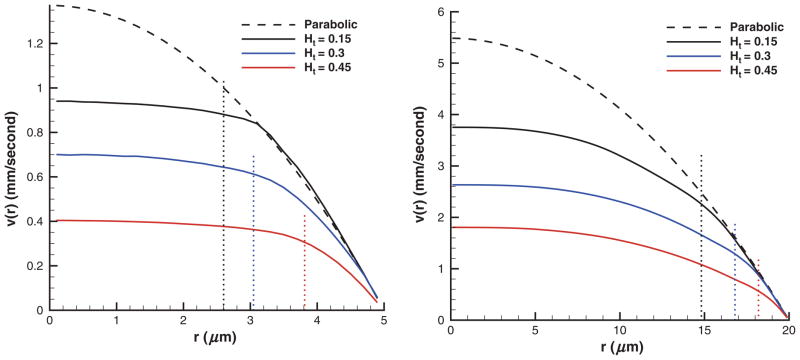
RBCs in Poiseuille flow migrate toward the tube center forming a core in the flow. Figure 1 shows several sample trajectories of individual RBCs (left) as flow develops and a snapshot of RBCs (right) flowing in a tube of diameter D = 20 μm after steady state is achieved. An RBC core formation is clearly observed with a thin plasma layer or CFL (not shown) next to the tube walls. The cell core of the flow results in plug-like velocity profiles shown in Figure 2 for tubes of diameters D = 10 μm (left) and D = 40 μm (right) for different Ht values.
Figure 1.
Sample trajectories of individual RBCs (left) as flow develops and a snapshot of RBCs (right) in Poiseuille flow in a tube of a diameter D = 20 μm after steady state is achieved. Ht = 0.45. x is the coordinate along the cylinder axis.
Figure 2.
Typical velocity profiles of blood flow in tubes of diameters D = 10 μm (left) and D = 40 μm (right) for different Ht values employing “repulsion” EV interactions. Dashed lines show the corresponding parabolic profiles of the Newtonian plasma with no cells present for the same pressure gradients. Dotted lines indicate the corresponding CFL thicknesses. Ht is the tube hematocrit, r is the radial axis, and v(r) is the axial flow velocity.
Velocity profiles and subsequent number density distributions are shown over the half tube because of flow axisymmetry. Dashed lines in Figure 2 correspond to the parabolic profiles of the Newtonian plasma in absence of the cells for the same pressure gradients. Velocity profiles are plotted in physical units, where the time scale was defined in equation (7) with η = 0.0012 Pa·s being the plasma viscosity. The velocity curves are averaged over the tube cross-section and over 2 × 10⁵ time steps, which corresponds to the total time of 0.1 seconds. The pressure gradients employed were 2.633 × 10⁵ and 6.582 × 10⁴ Pa/m for tubes of diameters 10 and 40 μm, respectively. In the case of low Ht (e.g., 0.15), the velocity profiles closely follow parabolic curves in the near-wall region. In the central region of the tube, a substantial reduction in velocity is found for all volume fractions in comparison with the parabolic profiles indicating a decrease in the flow rate given by
| (10) |
where A is the cross-sectional area. As the volume fraction of RBCs is increased, the flow rate decreases for the same pressure gradient. For small tube diameters (e.g., D = 10 μm), we observe plug-flow profiles with a nearly flat velocity in the center, whereas for larger tubes the velocity profiles only slightly resemble plug-flow. Moreover, flat velocity profiles are extended to the tube walls for larger Ht values indicating a wider RBC core and a smaller CFL. Table 2 presents blood flow characteristics for different tube diametes and Ht values. The table includes mean flow velocities defined as v̄ = Q/A, mean shear rates , pressure gradients ΔP/L, centerline flow velocities vc, and the corresponding centerline velocities vp of the Newtonian plasma in the absence of the cells. The mean flow velocities increase for tubes having larger diameters with comparable shear rates.
Table 2.
Blood flow characteristics for different tube diameters and Ht values employing “repulsion” EV interactions. Ht is the tube hematocrit, D is the tube diameter, v̄ is the mean flow velocity, γ̄ is the mean shear rate, ΔP/L is the pressure gradient, vc is the centerline flow velocity, and vp is the corresponding centerline velocity of the Newtonian plasma in the absence of cells.
| Ht | D (μm) | v̄ (mm/s) | (seconds) | ΔP/L (Pa/m) | vc (mm/s) | vp (mm/s) |
|---|---|---|---|---|---|---|
| 0.15 | 10 | 0.61 | 61.22 | 2.633 × 10⁵ | 0.94 | 1.37 |
| 0.3 | 10 | 0.47 | 47.03 | 2.633 × 10⁵ | 0.7 | 1.37 |
| 0.45 | 10 | 0.286 | 28.6 | 2.633 × 10⁵ | 0.4 | 1.37 |
| 0.15 | 20 | 1.172 | 58.6 | 1.316 × 10⁵ | 1.87 | 2.74 |
| 0.3 | 20 | 0.933 | 46.64 | 1.316 × 10⁵ | 1.44 | 2.74 |
| 0.45 | 20 | 0.566 | 28.32 | 1.316 × 10⁵ | 0.87 | 2.74 |
| 0.15 | 40 | 2.23 | 55.74 | 6.582 × 10⁴ | 3.75 | 5.48 |
| 0.3 | 40 | 1.66 | 41.55 | 6.582 × 10⁴ | 2.63 | 5.48 |
| 0.45 | 40 | 1.11 | 27.65 | 6.582 × 10⁴ | 1.81 | 5.48 |
The typical shear rates employed in in vitro and in vivo experiments are above γ̇c= 30 per second. The influence of shear rate on the apparent blood viscosity appears to be not significant for the average shear rates above γ̇c. At shear rates considerably lower than γ̇c, strong effects of shear rate on viscosity are expected [31], which is attributed to RBC sedimentation and aggregation properties. The shear rates employed in simulations are high enough to allow quantitative comparison of the blood flow properties with the available experimental data.
RBC and Plasma Distributions
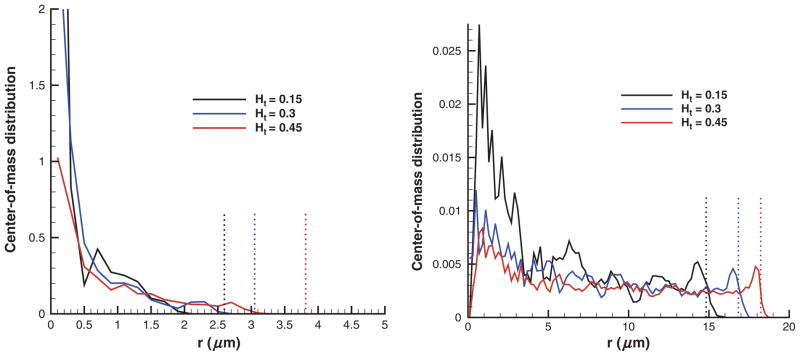
Figure 3 shows center-of-mass distributions of RBCs in tubes of D = 10 μm (left) and D = 40 μm (right) for different cell volume fractions. The center-of-mass distributions for lower Ht values appear to be more confined around the tube centerline. This results in a larger CFL that can be roughly estimated as R − rc=0, where rc=0 is the radius at which the probability of finding RBCs becomes zero. Even though the RBC distributions are directly correlated with the width of the RBC core in Poiseuille flow, they do not precisely define a boundary between the CFL and the RBC core, as they correspond to measurements of cell centers. In the Cell-free layer section, this boundary is defined based on instantaneous measurements of the edge of the cell core with respect to the centerline. Note that for the case of D = 40 μm, the probability of finding a cell at r = 0 is very close to zero, which appears to be due to limited statistics in simulations as no cell centers may be located in the small neighborhood of r = 0 during the sampling time.
Figure 3.
Center-of-mass distributions of RBCs in tubes of D = 10 μm (left) and D = 40 μm (right) for different Ht values with “repulsion” EV interactions. Dotted lines denote the corresponding CFL thicknesses. Ht is the tube hematocrit and r is the radial axis.
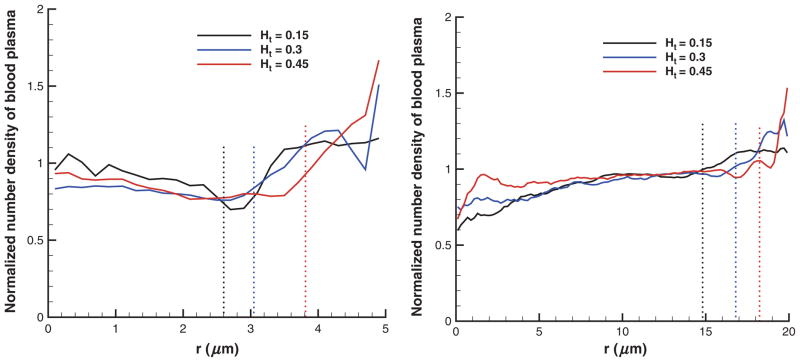
Figure 4 presents the number densities of the solvent normalized by their average values in tubes of diameters 10 μm (left) and 40 μm (right) for different Ht values. The average number density of solvent is given by , where Ns is the total number of solvent particles in the volume Vt. The plotted number density profiles show higher density values near the tube walls indicating the presence of CFL. In addition, density fluctuations found next to the tube walls become more pronounced at high Ht values and small tube diameters.
Figure 4.
Number density profiles of the suspending solvent normalized by their average in tubes of diameters 10 μm (left) and 40 μm (right) for different RBC volume fractions using “repulsion” EV interactions. Dotted lines denote the corresponding CFL thicknesses. Ht is the tube hematocrit and r is the radial axis.
Fahraeus Effect
The Fahraeus effect, discovered in in vitro experiments of blood flow in glass tubes [10], shows an increased value of discharge hematocrit (Hd) measured at the tube exit in comparison with that of the cell suspension before the tube entrance. Hd is defined as the volume fraction of RBCs exiting a tube per unit time. This effect is directly correlated with cell migration to the tube centerline. Hence, the RBC core is moving faster than the average blood velocity resulting in an increased Hd value measured at the tube discharge. We define Hd in simulations as follows
| (11) |
where v̄ = Q/A and v̄c is the average cell velocity calculated by averaging over velocities of all cell vertices and also averaged in time after the stationary state is reached. Pries et al. [28] have compiled a number of experiments on blood flow through glass tubes of different diameters at various Hd values to obtain an empirical relation between Ht and Hd given by
| (12) |
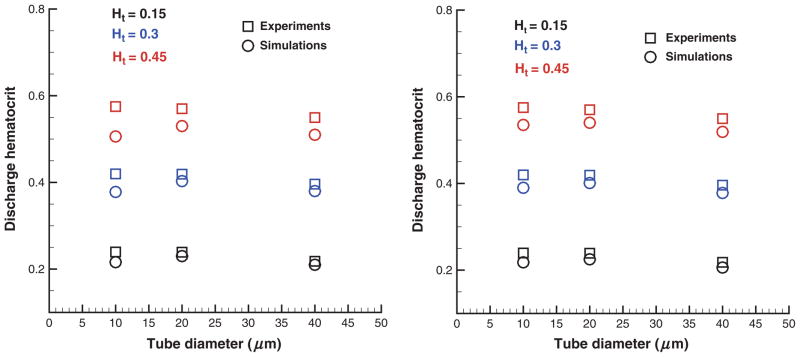
where the tube diameter D is in micormeters. Figure 5 compares Hd values in simulations with those from experiments [28] for different tube diameters and cell volume fractions. The left figure corresponds to the “repulsion” EV interactions among the cells with the parameters in Table 1 that result in a small screening distance between two RBC membrane surfaces discussed in the Modeling parameters section. The right plot contains simulation results obtained with “reflection” EV interactions yielding essentially no screening length among RBCs. Agreement between simulations and empirical values is excellent for low Ht values, whereas discrepancies are found for large Ht and small tube diameters (D = 10 μm). EV interactions appear to be of importance at Ht = 0.45 as the cells are closely packed. The introduced screening length among the cells with “repulsion” EV interactions results in a wider RBC core compared with that using “reflection” EV interactions. This yields a smaller CFL and flow rate (shown in the next section) and consequently a smaller Hd value as seen in Figure 5.
Figure 5.
Discharge hematocrits for various RBC volume fractions and tube diameters in comparison with the approximation in equation (12). “Repulsion” (left) and “reflection” (right) EV interactions are employed. Ht is the tube hematocrit.
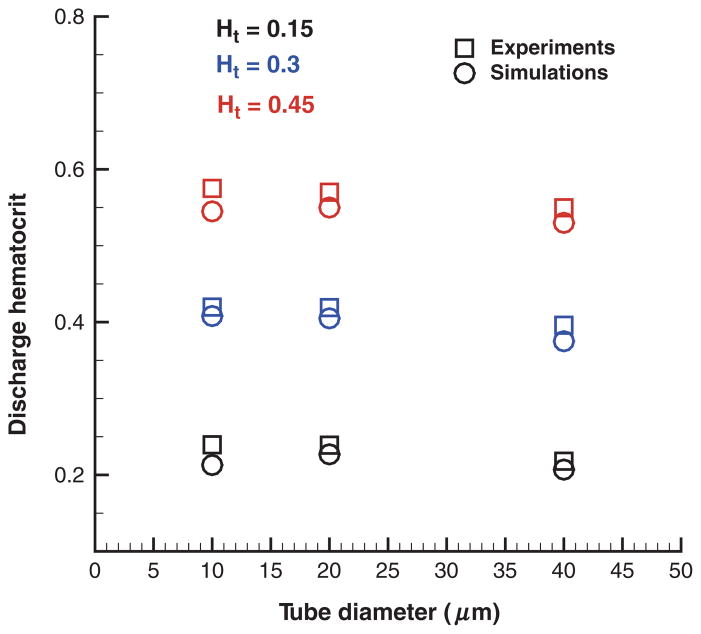
The remaining discrepancies for small tube diameters are due to solvent density fluctuations next to the wall as shown in Figure 4. Figure 6 presents Hd values from simulations using the “wall force” method (see Modeling parameters section). Additional wall repulsion of RBCs reduces the effect of near-wall density fluctuations of blood plasma in tubes of small diameters yielding good agreement of the simulated Hd values with those in in vitro experiments. Note that the repulsive wall does not affect the simulation results for low Ht values and large tube diameters as the CFL is wider than the distance of the effective cell– wall interactions.
Figure 6.
Hd for different RBC volume fractions and tube diameters obtained by the “wall force” method that utilize a net repulsion of cells from the wall. Ht is the tube hematocrit.
In conclusion, the “wall force” method yields superior results for Hd in comparison with the other two considered approaches. The “repulsion” method for EV interactions introduces a nonzero screening distance among RBCs, which may be unphysical. Cell–cell hydrodynamic interactions mediated by the simulated blood plasma are likely to be affected by this screening layer among the cells. The “reflection” approach eliminates the effect of the artificial screening layer to yield better results compared with the “repulsion” method. However, neither “repulsion” nor “reflection” method apply any treatments of the existing solvent density fluctuations near the walls. The “wall force” method extends the “reflection” approach to minimize the effect of density fluctuations and proves to be the best approach.
Fahraeus–Lindqvist Effect
The Fahraeus–Lindqvist effect [11] corresponds to a decrease in the apparent blood viscosity with decreasing tube diameter found in experiments of blood flow in glass tubes [28]. The apparent viscosity is defined as follows
| (13) |
The apparent viscosity increases for higher Ht values since higher cell crowding yields larger flow resistance. It is more convenient to consider the relative apparent viscosity defined as
| (14) |
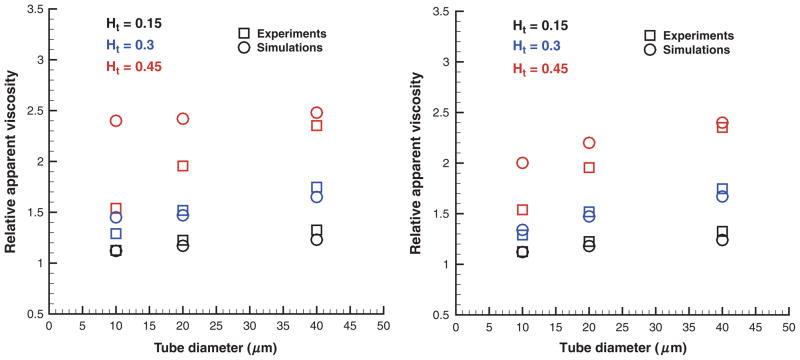
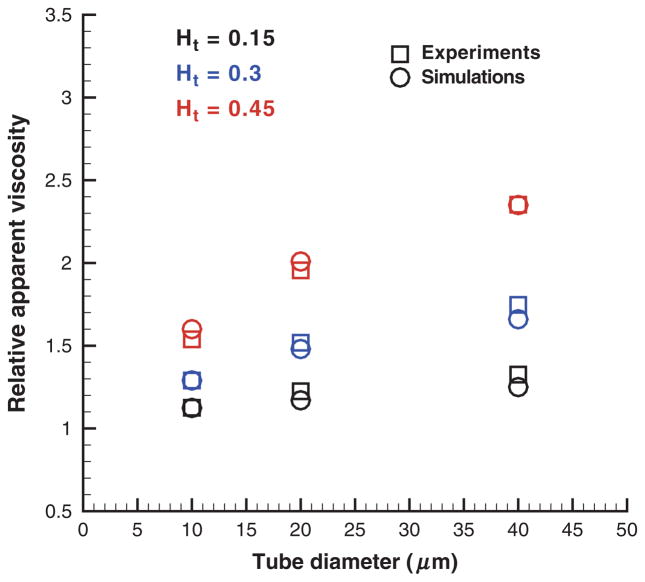
where ηs is the solvent viscosity. Figure 7 shows the simulated ηrel values in comparison with the empirical fit to experiments [28] for the tube diameter range 10–40 μm and Ht values in the range 0.15–0.45. Simulations in figure 7 (left) employed “repulsion” EV interactions. They significantly overpredict the relative apparent viscosity for Ht = 0.45 and tube diameters of 10–20 μm. The “reflection” EV interactions in the right figure yield better correspondence between the simulated viscosities and those from the experiments as a non-zero screening length among the cells is not implied a priori. These results are consistent with the Hd values discussed in the previous section. In addition, the remaining discrepancies in ηrel for Ht = 0.45 are due the near-wall density fluctuations (Figure 4) of the suspending plasma discussed in the previous section on the Fahraeus Effect. To minimize influence of the solvent fluctuations an analogous set of simulations was performed with the “wall force” method shown in Figure 8. Excellent agreement between simulations and experiments was found for this case. The “wall force” method appears to be the best among three considered approaches, which is consistent with the Hd values discussed in the Fahraeus effect section and with the corresponding CFLs presented next.
Figure 7.
Relative apparent viscosity obtained with “repulsion” (left) and “reflection” (right) EV interactions in comparison with experimental data [28] for various Ht values and tube diameters. Ht is the tube hematocrit.
Figure 8.
Relative apparent viscosity obtained with the “wall force” setup in comparison with experimental data [28] for different Ht values and tube diameters. Ht is the tube hematocrit.
Cell-Free Layer
The CFL is a near-wall layer of blood plasma absent of RBCs (see Figure 1) since they are subject to migration to the tube center in Poiseuille flow. The fluid viscosity of the CFL region is much smaller than that of the tube core populated with RBCs providing an effective lubrication for the core to flow. The thickness of the CFL is directly related to the Fahraeus and the Fahraeus–Lindqvist effects. Thus, in small tubes, the CFL thickness is significant with respect to the tube diameter resulting in a smaller relative apparent viscosity and larger Hd in comparison with those in larger tubes, where the CFL thickness becomes negligible with respect to the tube diameter.
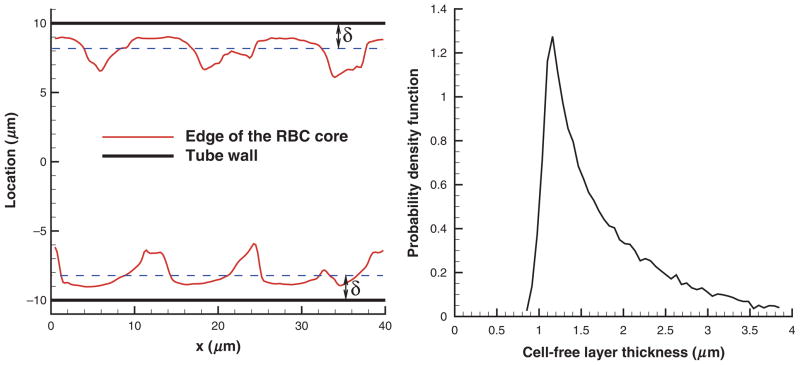
To determine the CFL thickness δ, we measured the outer edge of the RBC core (see Figure 1), which is similar to CFL measurements in experiments [20,22]. Figure 9 shows a sample CFL edge (left) from simulations and CFL thickness distribution (right) for Ht = 0.45 and D = 20 μm. The cell edge was measured by projecting the cell vertices of a snapshot of RBCs on the x–y plane, where curves of the RBC core minimum and maximum were fitted. Discrete samples of δ from the obtained curves were taken every 0.5 μm along the flow direction x. In addition, several cell edge curves were extracted from a single snapshot by rotating the RBC core before projection on the x–y plane, and a number of core snapshots corresponding to different times was averaged. A steep beginning of the CFL thickness distribution in Figure 9 (right) characterizes the global minimum of the RBC core, while the slowly decaying tail corresponds to a number of cavities in the RBC core formed by two or more adjacent RBCs as shown in Figure 9 (left). To characterize variations in CFL thickness the SD value σδ was calculated. Also, the persistence of spatial variation was obtained by calculation of the correlation length of the cell edge pattern given by
Figure 9.
An example of a CFL edge (left) and CFL thickness distribution (right) for Ht = 0.45 and D = 20 μm. x is the coordinate along the cylinder axis and δ is the CFL thickness.
| (15) |
where C(d) is the covariance of (δ(x) − δ̄) and (δ(x+d) − δ̄), δ̄ is the average CFL, and d is the separation length. The covariance decreases to zero with increasing d, and if C(d′) ≈ 0, then d′ is the correlation length of the cell edge pattern. Table 3 presents the simulated correlation lengths for different Ht values and tube diameters. The correlation length of the cell edge pattern increases for larger Ht as the cell core is denser. Note that in case of Ht = 0.15, the correlation length is comparable with the cell diameter indicating small correlations among separate cells. The length d′ appears to be independent of the tube diameter, in agreement with in vivo experiments [20] for the vessel diameter range of 20–50 μm. Furthermore, d′ values found in [20] for Ht = 0.42 are in the range of 25–35 μm, which is consistent with the simulated values of 27–28 μm for Ht = 0.45 in Table 3.
Table 3.
Correlation lengths of the cell edge pattern for different tube diameters and Ht values. Ht is the tube hematocrit and D is the tube diameter.
| Ht = 0.15 | Ht = 0.3 | Ht = 0.45 | |
|---|---|---|---|
| D = 10 μm | 8.3 | 18.5 | 27.1 |
| D = 20 μm | 8.5 | 18.3 | 27.8 |
| D = 40 μm | 8.0 | 18.7 | 27.3 |
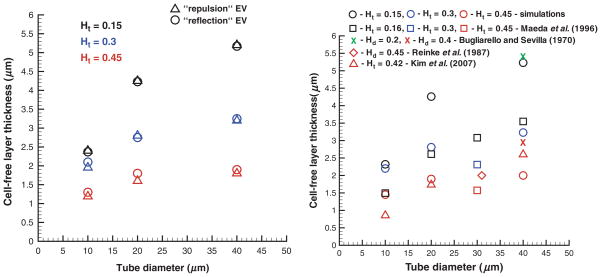
Figure 10 shows CFLs for different tube diameters and cell volume fractions obtained using the “repulsion” and “reflection” EV interactions (left) and the “wall force” method in comparison with in vitro experiments [30] and in vivo experiments [20,22] (right). The simulated CFLs are consistent with the described Fahraeus and Fahraeus– Lindvuist effects. CFLs are wider for lower Ht values and larger tube diameters indicating migration of RBCs to the tube centerline. CFL thicknesses for different EV interactions in Figure 10 (left) seem to have insignificant discrepancies. This appears to be true for larger tube diameters and lower cell volume fractions in agreement with the analogous independence of the relative apparent viscosity of an RBC suspension on EV interactions found in the Fahraeus–Lindqvist effect section. However, in case of small tube diameters and high Ht values, even a small change in the CFL thickness may result in a considerable increase of the relative apparent viscosity. As an example, for the case of D = 10 μm and Ht = 0.45, the CFLs are 1.19, 1.3, and 1.45 μm for the “repulsion,” “reflection” EV interactions, and the “wall force” method, respectively, and the corresponding ηrel values are 2.4, 2.002, and 1.6 (Figures 7 and 8) showing a significant decrease.
Figure 10.
CFLs obtained in blood flow simulations employing the “repulsion” and “reflection” EV interactions (left) and the “wall force” setup in comparison with experimental data [20,22,30] (right) for various Ht values and tube diameters. Ht is the tube hematocrit and Hd is the discharge hematocrit.
A comparison of the simulated CFLs and those obtained in experiments in Figure 10 (right) shows partial agreement. Note that our simulations mimic blood flow in rigid and long tubes. Thus, the CFL measurements are carried out after the stationary state is reached and cell migration can be neglected. Bugliarello and Sevilla [2] performed experiments of blood flow in glass tubes at various Hd values shown by the “x” symbols in Figure 10 (right). The CFLs obtained in these experiments appear to be close to the simulated values if we calculate the corresponding Ht values (Ht = 0.14 and Ht = 0.31) from equation (12). Reinke et al. [30] conducted in vitro experiments of blood flow at Hd = 0.45 in glass tubes. The obtained CFL value for D = 31 μm, Hd = 0.45 suitable for comparison (diamond symbol in Figure 10 (right)) shows good agreement with simulations. Note that the simulated CFLs lie within the range of a scatter in the available in vitro experimental data on CFLs. We are not aware of any other in vitro experimental measurements of CFLs suitable for comparison.
CFLs from in vivo experiments [20,22] plotted in Figure 10 (right) show satisfactory agreement with simulations for high Ht values (Ht = 0.42–0.45), whereas for low Ht, the correspondence is rather poor. In fact, available in vivo measurements of CFLs show a scatter in the results. Yamaguchi et al. [37] found the CFL in cat cerebral microvessels to be approximately 4 μm (not shown in Figure 10 [right]) and independent of vessel diameter. Maeda et al. [22] reported CFLs in the range of 1–1.8 μm for vessel diameters 10–40 μm at Ht = 0.45, where a rabbit mesentery was perfused. Kim et al. [20] obtained CFLs in the range of 0.5– 3 μm increasing from the diameter 10–50 μm at Ht = 0.42 where a rat cremaster muscle was used. The variability of in vivo measurements of the CFL and their discrepancies with simulations shown in Figure 10 (right) may be due to several reasons such as the existence of the glycocalyx layer, variations in vessel width, use of a short vessel, close proximity of the site of CFL measurements to vessel bifurcations, vessel elasticity, and spatial resolution of the measurements.
The thickness of the glycocalyx layer is estimated to be approximately of 0.4–0.5 μm [4,35]. The experimental data of Kim et al. [20] shown in Figure 10 (right) include the glycocalyx thickness and yield satisfactory agreement with simulations. Subtracting its average thickness from the experimental CFL values would result in very thin CFLs especially for small vessel diameters (D = 10 μm) and yield further discrepancies in comparison with simulations. The other referenced experimental sources do not explicitly state whether the thickness of the glycocalyx layer was included into CFL measurements. The largest discrepancies between simulated CFLs and those measured in in vivo experiments are comparable with the glycocalyx thickness for Ht = 0.42–0.45, while for lower Ht values discrepancies appear to be more significant.
Variations in vessel diameter may locally alter blood flow and impact CFL measurements. Maeda et al. [22] reported spatial variations in the vessel diameter on the order of several percent, while Kim et al. [20] estimated a potential error in CFL measurements to be approximately 10% due to the change in the vessel diameter. Even though variations in the vessel diameter seem to have a rather insignificant effect on CFL measurements, it may influence migration of RBCs toward the center of the vessel, which is the main mechanism for CFL development. Moreover, RBC migration strongly depends on the vessel length and flow nonuniformity due to nearby vessel bifurcations. The perfused vessel length was not specified in experiments and it may not be long enough to allow RBCs to fully migrate to the vessel center and to form a steady core of the flow. In simulations, periodic boundary conditions in the direction of the tube axes were employed, which is essentially equivalent to the infinite length of the tube, and complete migration of RBCs can be considered to be fully achieved. Incomplete migration of RBCs in short vessels would result in the smaller CFLs found in experiments [22] in comparison with those in simulations (Figure 10 [right]).
Upstream flow conditions such as vessel bifurcations affect the width of the CFL [8,27]. Kim et al. [20] reported a nonaxisymmetric nature of CFL variations on opposite sides of the arteriole with a difference of 0.5 μm in the mean width of CFLs on the two sides. This difference in CFLs was attributed to a possible effect of upstream bifurcations. Note that the simulated CFLs here are found to be axisymmetric. Pries et al. [27] reported that an axisymmetric cell profile is recovered after at least ten vessel diameters downstream of a bifurcation. However, this distance may not be long enough to account for full RBC migration. At high Ht values, CFLs may not be very sensitive to the discussed geometrical uncertainties present in the in vivo experiments, whereas at low Ht they may significantly affect measured CFLs.
The magnitude of the CFLs reported by Maeda et al. [22] plotted in Figure 10 (right) are smaller than those obtained in the simulations. In accordance, the reported values of the relative apparent viscosity for the hardened vessels of diameters in the range of 25–35 μm were 1.63, 2.0, and 2.83 for Ht = 0.16, 0.3, and 0.45, respectively. These viscosities are considerably higher than those found in in vitro experiments [28] (1.29, 1.65, and 2.19 for D = 30 μm and Ht = 0.15, 0.3, and 0.45), which provides an additional explanation for the discrepancies found. Finally, spatial resolution of the experimental measurements may contribute to the discrepancies between the simulated CFLs and those obtained in in vivo experiments. Kim et al. [20] reported that their spatial resolution was 0.4 μm, which is on the order of the thickness of the glycocalyx layer, whereas the spatial resolution was not specified in Ref. [22].
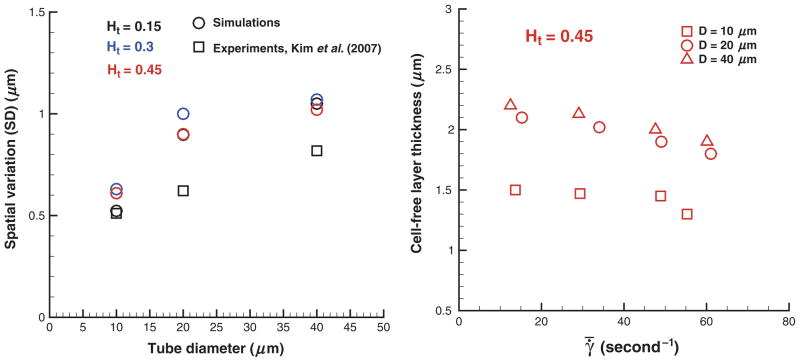
Figure 11 (left) presents SD values σδ of the CFL thickness. Spatial variations of the CFL thickness characterized by σδ appear to increase with tube diameter in agreement with experiments [20]. The observed discrepancies between simulated and experimental SD values may be due to the differences discussed in the previous paragraph. The obtained SD values of the CFL thickness appear to be independent of Ht and a model selected for EV interactions among cells (not shown here). Figure 11 (right) shows CFLs at Ht = 0.45 for different tube diameters and shear rates . The CFL thickness is slightly decreasing with increasing shear rate or equivalently flow rate. This is consistent with experiments [20], where the same trend was found for the range of shear rates 100–500 per second. A decrease in the CFL thickness for higher flow rates is attributed to intensified hydrodynamic interactions among cells at higher shear rates that tend to expand the RBC core of the flow. Note that a decrease in the CFL thickness in this case may not necessarily result in an increase of the relative apparent viscosity because it corresponds to a characteristic viscosity of an RBC suspension averaged over the tube cross-section. A suspension of RBCs shows a shearthinning behavior with shear-dependent viscosity.
Figure 11.
Spatial variations of the CFL thickness (SD) (left) and CFLs for different shear rates at Ht = 0.45 (right) for various Ht values and tube diameters. In vivo experimental data [20] for Ht = 0.42 are included in the left plot for comparison. Ht is the tube hematocrit, D is the tube diameter, and γ̄ is the mean shear rate.
SUMMARY
Blood is modeled as a suspension of RBCs in a Newtonian fluid. Blood flow in microtubes under healthy conditions is simulated for different Ht values and tube diameters. Velocity profiles for different Ht values show an increase in blood flow resistance with an increase in Ht. RBC center-of- mass distributions indicate cell migration away from the wall to the tube center. This results in the formation of a CFL next to the tube wall and is related to the experimentally observed Fahraeus and Fahraeus–Lindqvist effects.
The Fahraeus effect is characterized by a decrease in the discharge hematocrit when the tube diameter is increased, whereas the Fahraeus–Lindqvist effect describes a decrease in the blood apparent viscosity with decreasing tube diameter. The developed blood flow model is able to closely capture changes in the discharge hematocrit and the relative apparent viscosity for Ht values in the range 0.15–0.45 and tube diameters between 10 and 40 μm in comparison with those found in in vitro experiments.
Fahraeus and Fahraeus–Lindqvist effects are directly related to the CFL next to the wall by providing an effective lubrication for the viscous RBC core to flow at much less friction. The simulated CFLs are in agreement with those found in in vitro and in vivo experiments; however, experimental CFL values show a considerable scatter that does not allow a very rigorous quantitative comparison. Discrepancies between the simulated CFLs and in vitro data are likely to be related to a potential RBC sedimentation, RBC aggregability, and differences in flow rates employed, whereas blood flow conditions in vivo are far more complex. In particular, CFLs in vivo are additionally affected by the presence of the glycocalyx layer, variations in vessel diameter, upstream flow conditions such as vessel bifurcations, and the length of a straight vessel segment where measurements are taken.
In conclusion, the developed model is able to capture blood flow properties and hence it may aid to obtain realistic predictions of blood flow in microcirculation.
Supplementary Material
Acknowledgments
This work was supported by NIH Grant Number R01Hl094270 and simulations were performed on the Cray XT5 at NSF/NICS.
Abbreviations used
- DPD
Dissipative particle dynamics
- RBC
Red blood cell
- WBC
White blood cell
- CFL
Cell-free layer
- EV
Excluded volume
- SD
Standard deviation
Footnotes
Additional Supporting Information may be found in the online version of this article (http://www.microcirculationjournal.com):
Appendix S1. Blood flow and cell-free layer in microvessels.
Please note: Wiley-Blackwell are not responsible for the content or functionality of any supporting materials supplied by the authors. Any queries (other than missing material) should be directed to the corresponding author for the article.
References
- 1.Bagchi P. Mesoscale simulation of blood flow in small vessels. Biophys J. 2007;92:1858–1877. doi: 10.1529/biophysj.106.095042. [DOI] [PMC free article] [PubMed] [Google Scholar]
- 2.Bugliarello G, Sevilla J. Velocity distribution and other characteristics of steady and pulsatile blood flow in fine glass tubes. Biorheology. 1970;7:85–107. doi: 10.3233/bir-1970-7202. [DOI] [PubMed] [Google Scholar]
- 3.Cokelet GR, Goldsmith HL. Decreased hydrodynamic resistance in the two-phase flow of blood through small vertical tubes at low flow rates. Circ Res. 1991;68:1–17. doi: 10.1161/01.res.68.1.1. [DOI] [PubMed] [Google Scholar]
- 4.Damiano ER. The effect of the endothelial-cell glycocalyx on the motion of red blood cells through capillaries. Microvasc Res. 1998;55:77–91. doi: 10.1006/mvre.1997.2052. [DOI] [PubMed] [Google Scholar]
- 5.Dao M, Li J, Suresh S. Molecularly based analysis of deformation of spectrin network and human erythrocyte. Mater Sci Eng C. 2006;26:1232–1244. [Google Scholar]
- 6.Discher DE, Boal DH, Boey SK. Simulations of the erythrocyte cyto-skeleton at large deformation. II. Micropipette aspiration. Biophys J. 1998;75(3):1584–1597. doi: 10.1016/S0006-3495(98)74076-7. [DOI] [PMC free article] [PubMed] [Google Scholar]
- 7.Dupin MM, Halliday I, Care CM, Munn LL. Lattice Boltzmann modeling of blood cell dynamics. Int J Comput Fluid Dyn. 2008;22(7):481–492. [Google Scholar]
- 8.Enden G, Popel AS. A numerical study of plasma skimming in small vascular bifurcations. J Biomech Eng. 1994;116:79–88. doi: 10.1115/1.2895708. [DOI] [PubMed] [Google Scholar]
- 9.Espanol P. Fluid particle model. Phys Rev E. 1998;57(3):2930–2948. [Google Scholar]
- 10.Fahraeus R. The suspension stability of the blood. Physiol Rev. 1929;9:241–274. [Google Scholar]
- 11.Fahraeus R, Lindqvist T. Viscosity of blood in narrow capillary tubes. Am J Phys. 1931;96:562–568. [Google Scholar]
- 12.Fedosov DA. PhD thesis. Brown University; Providence, RI, USA: 2010. Multiscale modeling of blood flow and soft matter. [Google Scholar]
- 13.Fedosov DA, Caswell B, Karniadakis GE. A multiscale red blood cell model with accurate mechanics, rheology, and dynamics. Biophys J. 2010;98(10):2215–2225. doi: 10.1016/j.bpj.2010.02.002. [DOI] [PMC free article] [PubMed] [Google Scholar]
- 14.Fedosov DA, Caswell B, Karniadakis GE. Systematic coarse-graining of spectrin-level red blood cell models. Comp Meth Appl Mech Eng. 2010;199:1937–1948. doi: 10.1016/j.cma.2010.02.001. [DOI] [PMC free article] [PubMed] [Google Scholar]
- 15.Goldsmith HL. Red cell motions and wall interactions in tube flow. Fed Proc. 1971;30:1578–1590. [PubMed] [Google Scholar]
- 16.Goldsmith HL, Cokelet GR, Gaehtgens PR. Robin Fahraeus: evolution of his concepts in cardiovascular physiology. Am J Physiol. 1989;257:H1005–H1015. doi: 10.1152/ajpheart.1989.257.3.H1005. [DOI] [PubMed] [Google Scholar]
- 17.Gompper G, Kroll DM. Random surface discretizations and the renormalization of the bending rigidity. J Phys I France. 1996;6(10):1305–1320. [Google Scholar]
- 18.Helfrich W. Elastic properties of lipid bilayers: theory and possible experiments. Z Naturforsch C. 1973;28:693–703. doi: 10.1515/znc-1973-11-1209. [DOI] [PubMed] [Google Scholar]
- 19.Hoogerbrugge PJ, Koelman JMVA. Simulating microscopic hydrodynamic phenomena with dissipative particle dynamics. Europhys Lett. 1992;19(3):155–160. [Google Scholar]
- 20.Kim S, Long LR, Popel AS, Intaglietta M, Johnson PC. Temporal and spatial variations of cell-free layer width in arterioles. Am J Physiol. 2007;293:H1526–H1535. doi: 10.1152/ajpheart.01090.2006. [DOI] [PubMed] [Google Scholar]
- 21.Liu Y, Liu WK. Rheology of red blood cell aggregation by computer simulation. J Comput Phys. 2006;220:139–154. [Google Scholar]
- 22.Maeda N, Suzuki Y, Tanaka J, Tateishi N. Erythrocyte flow and elasticity of microvessels evaluated by marginal cell-free layer and flow resistance. Am J Physiol. 1996;271(6):H2454–H2461. doi: 10.1152/ajpheart.1996.271.6.H2454. [DOI] [PubMed] [Google Scholar]
- 23.McWhirter JL, Noguchi H, Gompper G. Flow-induced clustering and alignment of vesicles and red blood cells in microcapillaries. Proc Natl Acad Sci USA. 2009;106(15):6039–6043. doi: 10.1073/pnas.0811484106. [DOI] [PMC free article] [PubMed] [Google Scholar]
- 24.Moyers-Gonzalez MA, Owens RG. Mathematical modelling of the cell-depleted peripheral layer in the steady flow of blood in a tube. Biorheology. 2010;47:39–71. doi: 10.3233/BIR-2010-0558. [DOI] [PubMed] [Google Scholar]
- 25.Pan W, Fedosov DA, Caswell B, Karniadakis GE. Hydrodynamic interactions for single dissipative-particle-dynamics particles and their clusters and filaments. Phys Rev E. 2008;78(4):046706. doi: 10.1103/PhysRevE.78.046706. [DOI] [PubMed] [Google Scholar]
- 26.Popel AS, Johnson PC. Microcirculation and hemorheology. Annu Rev Fluid Mech. 2005;37:43–69. doi: 10.1146/annurev.fluid.37.042604.133933. [DOI] [PMC free article] [PubMed] [Google Scholar]
- 27.Pries AR, Ley K, Claassen M, Gaehtgens P. Red cell distribution at microvascular bifurcations. Microvasc Res. 1989;38:81–101. doi: 10.1016/0026-2862(89)90018-6. [DOI] [PubMed] [Google Scholar]
- 28.Pries AR, Neuhaus D, Gaehtgens P. Blood viscosity in tube flow: dependence on diameter and hematocrit. Am J Physiol. 1992;263(6):H1770–H1778. doi: 10.1152/ajpheart.1992.263.6.H1770. [DOI] [PubMed] [Google Scholar]
- 29.Pries AR, Secomb TW, Gessner T, Sperandio MB, Gross JF, Gaehtgens P. Resistance to blood flow in microvessels in vivo. Circ Res. 1994;75:904–915. doi: 10.1161/01.res.75.5.904. [DOI] [PubMed] [Google Scholar]
- 30.Reinke W, Gaehtgens P, Johnson PC. Blood viscosity in small tubes: effect of shear rate, aggregation, and sedimentation. Am J Physiol. 1987;253:H540–H547. doi: 10.1152/ajpheart.1987.253.3.H540. [DOI] [PubMed] [Google Scholar]
- 31.Reinke W, Johnson PC, Gaehtgens P. Effect of shear rate variation on apparent viscosity of human blood in tubes of 29 to 90 microns diameter. Circ Res. 1986;59:124–132. doi: 10.1161/01.res.59.2.124. [DOI] [PubMed] [Google Scholar]
- 32.Seung HS, Nelson DR. Defects in flexible membranes with crystalline order. Phys Rev A. 1988;38(2):1005–1018. doi: 10.1103/physreva.38.1005. [DOI] [PubMed] [Google Scholar]
- 33.Sharan M, Popel AS. A two-phase model for flow of blood in narrow tubes with increased effective viscosity near the wall. Biorheology. 2001;38:415–428. [PubMed] [Google Scholar]
- 34.Sun C, Munn LL. Particulate nature of blood determines macroscopic rheology: a 2D lattice-Boltzmann analysis. Biophys J. 2005;88:1635–1645. doi: 10.1529/biophysj.104.051151. [DOI] [PMC free article] [PubMed] [Google Scholar]
- 35.Vink H, Duling BR. Identification of distinct luminal domains for macromolecules, erythrocytes, and leukocytes within mammalian capillaries. Circ Res. 1996;79:581–589. doi: 10.1161/01.res.79.3.581. [DOI] [PubMed] [Google Scholar]
- 36.Weinbaum S, Tarbell JM, Damiano ER. The structure and function of the endothelial glycocalyx layer. Annu Rev Biomed Eng. 2007;9:121–167. doi: 10.1146/annurev.bioeng.9.060906.151959. [DOI] [PubMed] [Google Scholar]
- 37.Yamaguchi S, Yamakawa T, Niimi H. Cell-free plasma layer in cerebral microvessels. Biorheology. 1992;29:251–260. doi: 10.3233/bir-1992-292-305. [DOI] [PubMed] [Google Scholar]
Associated Data
This section collects any data citations, data availability statements, or supplementary materials included in this article.


