

Abstract
We describe the draft genome of the microcrustacean Daphnia pulex, which is only 200 Mb and contains at least 30,907 genes. The high gene count is a consequence of an elevated rate of gene duplication resulting in tandem gene clusters. More than 1/3 of Daphnia’s genes have no detectable homologs in any other available proteome, and the most amplified gene families are specific to the Daphnia lineage. The co-expansion of gene families interacting within metabolic pathways suggests that the maintenance of duplicated genes is not random, and the analysis of gene expression under different environmental conditions reveals that numerous paralogs acquire divergent expression patterns soon after duplication. Daphnia-specific genes – including many additional loci within sequenced regions that are otherwise devoid of annotations – are the most responsive genes to ecological challenges.
Introduction
Daphnia pulex, or the waterflea, is a keystone species of freshwater ecosystems – a principal grazer of algae, a primary forage for fish (1) and a sentinel of lentic inland waters. Their populations are defined by the boundaries of ponds and lakes, are sensitive to modern toxicants in the environment, and thus are used to assess the ecological impact of environmental change (2-3). Daphnia exhibit a range of context-dependent development of specialized phenotypes, such as switching between clonal and sexual reproduction in response to environmental conditions (4). They are phenotypically plastic, in that some species alter diurnal migration behavior and develop exaggerated morphological defenses in response to predators (5). Physiological responses to abiotic environmental fluctuations can include the rapid rise of hemoglobin levels when ambient oxygen levels fall (6). The genus Daphnia is speciose with multiple lineages independently colonizing and adapting to diverse habitats (7). Their short generation time, large brood sizes and ease of laboratory and field manipulation have assured their importance for setting regulatory standards by environmental protection agencies, for testing chemical safety, for monitoring water quality (2-3) and as a model for ecological and evolutionary research (8).
Daphnia pulex, as a crustacean arthropod, is the closest ally to the insects (9) and thus allows the cataloguing of genes that likely evolved in the pancrustacean ancestor of at least some lineages of insects and Crustacea (Fig. S1). Although the branchiopod D. pulex represents only a single crustacean lineage – which contains over 40,000 known species with striking levels of phenotypic diversity – the genus and its order (the Cladocera) date to the Permian (10).
Because Daphnia’s ecology is superbly understood, access to its genome sequence (Fig. S2; Table S1) allows studying environmental influences on gene functions in ways that are difficult in even the best-developed genomic model species. Traits observed in laboratories are likely a small subset of the phenotypic variation that is expressed in natural ecosystems, and a focus on laboratory studies may partly explain why over 50% of many eukaryotic genomes are without experimentally determined functional annotations (11).
Genome Sequence, Assembly and Mapping to Chromosomes
The D. pulex genome was assembled using JAZZ (12) from 1,554,564 quality-filtered nuclear sequence reads (8.7-fold coverage) from a naturally inbred isoclonal daphniid dubbed “The Chosen One” (TCO; SOM I.1). The v1.1 draft genome assembly comprises19,008 contigs arranged within 5,191 scaffolds that sum to a genome size of ~200 Mb (Table S2). Two-hundred-eighty scaffolds link to construct 118 super-scaffolds (Tables S3-4). Microsatellite markers (13) place 73 large scaffolds (73.9 Mb total) on the 12 chromosomes (Table S5). We estimate that the draft assembly is high quality and includes approximately 80% of Daphnia’s nuclear genome (SOM I.2; Tables S6-7; Figs. S3-5). We determine that 3,598missing regions (59%) contain duplicated genes while others are heterochromatic regions, including the centromeres and telomeres. We estimate that 25% of the genome may be heterochromatic (Table S8, Fig. S6). The ends of D. pulex chromosomes appear to consist of long stretches of TTAGG repeats with flanking regions (30-40 Kb) internal to these repeats consisting of repetitive sequences, including at least two kinds of satellite sequences (SOM 1).
Gene Inventory
A minimum set of 30,907 protein-encoding genes were predicted for D. pulex, with 26,867 gene models having the following support (Tables S9-14; Fig. S7): (1) 145,578 ESTs from 37 separate conditions validating 10,578 genes; (2) whole-genome tiling microarrays examining gene expression under six different conditions that detect 186,269 Transcriptionally Active Regions (TARs) validating 57,294 exons from 14,135 genes (additional TARs suggest gene models not yet included within the minimum set); (3) similarity to proteins from other (non-daphniid) genomes that detects 19,641 D. pulex genes (blast e < 10-5); (4) 18,765 genes identified in protein similarity searches against a preliminary draft genome sequence for D. magna (SOM 2), which belongs to a separate subgenus (7); (5) more than 11,000 D. pulex peptide sequences detected by tandem mass spectrometry, of which 93% map to 1,273 gene models in the minimum set; (6) 716 highly conserved single-copy eukaryotic genes, of which D. pulex is missing only two (Table S15), confirming that expected genes are included in the assembly; and (7) 13,105 loci identified as paralogs by nucleotide sequence similarity searches for each predicted gene against the complete gene list (e < 10-20). Measures of the relative rate of non-synonymous nucleotide substitutions to the substitution rate at synonymous sites (Ka/Ks) indicate that the paralogs within our gene set generally show evidence of purifying selection (Fig. S8).
To ensure that the gene-count was not inflated by the erroneous assembly of alleles of the same locus as unique gene copies, we conducted comparative genomic hybridizations of labeled TCO DNA on microarrays. We detected no correlation between the read coverage and the mean fluorescing units of probes representing genes (Fig. S9). Counts can also be inflated by inclusion of pseudogenes. However, manual annotations suggest that pseudogenes account for only 4-6% of large paralogous family members in Daphnia [see companion studies (14)].
Many non-protein-encoding genes were also identified in the D. pulex genome (SOM 3). Fifty miRNA genes are annotated and 27 are validated using tiling microarrays (Table S16; Fig. S10). We estimate 468 rRNA loci and find 3,798 transfer-RNA (tRNA) genes. As in Drosophila melanogaster and Caenorhabditis elegans, these loci are clustered (Fig. S11). Transposable elements constitute 9.4% of the assembled genome (Table S17) consisting of 275 families of retrotransposons (Class I) and DNA transposons (Class II) (Table S18). Intra-element pair-wise divergence among termini for intact elements of Long Terminal Repeat (LTR) retrotransposons ranges from 0-25.3% among the three superfamilies, BEL, gypsy and copia (averaging 2%), indicating many recent transpositions (Fig. S12).
Attributes of a Compact Genome
Comparison with gene-structure statistics for insects, nematode and mouse, reveals reduced intron size in Daphnia (Table S19; Fig. S13), resulting in a mean gene span of approximately 1,000 bp shorter than the mean Drosophila gene length. However, average protein length is similar in these two species. Aside from introns, most other structures of the D. pulex genome are approximately equal in size or in number to those of the nematode, or exceed measurements in other species. The reduced intergenic regions compared to insects may partly be attributed to smaller repeated elements (Table S19).
The average length of EST-validated D. pulex introns is 170 bp; only 10% of introns are larger than 210 bp. The intron density of Daphnia pulex genes is similar to that of Apis mellifera, having >2× more introns per gene than Drosophila. Approximately 50% of introns are shared among respective orthologs in Daphnia and Apis (Tables S19-23; Fig. S14). The Daphnia lineage shows an estimated intron gain/loss ratio substantially greater than 1 (Table S24; Fig. S15). We estimate that 78% of these intron gains are unique to this lineage and that 22% occurred in parallel with gains in other lineages (Fig. S16).
Origin and Preservation of Daphnia pulex Genes
Daphnia’s gene catalog shows more universal bilaterian genes than other arthropods (8,096; black in Fig. 1A) and thus shares the highest number of genes with human (Table S25). Only 1,383 genes (4.5%) appear pancrustacean (green in Fig. 1A). Remarkably, over 36% of the minimal set of D. pulex genes have no detectable homology to those in the other species (Fig. 1A), which can partly be explained by the disproportionate expansion of gene families distinctive to this crustacean lineage (χ2 = 450.55, p < 0.0001; Table S26; Fig. 1B) and fast divergence for some genes (enlarged beige fraction in Fig. 1A). A phylogenetic accounting of the expansions and contractions of all gene families within pancrustacean and representative deuterostome genomes (Tables S27-28) suggests a net increase in the number of paralogs within the lineage leading to Daphnia (Fig. 1C). By reconstructing gene-family histories across a phylogeny (SOM IV.2), we count 17,424 new and 1,079 lost genes in the branch leading to Daphnia. By contrast, the sum of inferred gains and loss along the longest series of branches in the insect phylogeny – originating from the shared pancrustacean ancestor with Daphnia – only reaches 8,981 gained loci with 3,040 gene losses. Therefore, the overall elevated Daphnia gene count appears to result from both gaining and retaining more genes.
Figure 1.
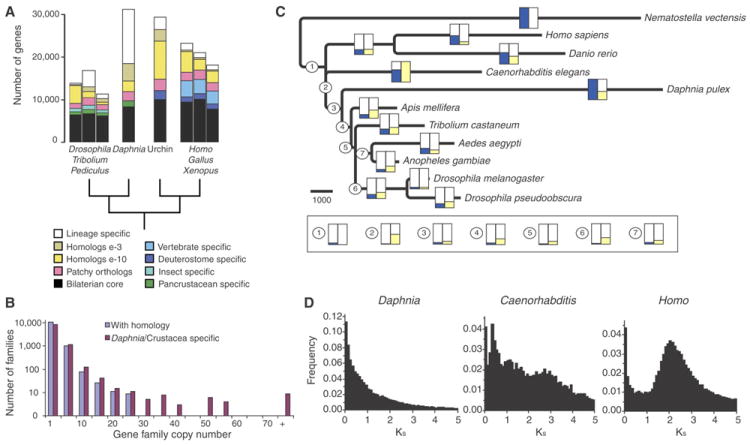
The Daphnia pulex gene repertoire. A. Comparison of genes among D. pulex, Drosophila melanogaster, Pediculus humanus, Tribolium castaneum, and Strongylocentrotus purpuratus (urchin), and Gallus gallus, Xenopus tropicalis and Homo. sapiens, showing the core bilaterian genes (black), vertebrate (blue), insect (aqua) and pancrustacean (green) specific genes, patchy or ancient orthologs present in at least one arthropod and one deuterostome genome but lost in other lineages (pink), multiple copy homologs (yellow and beige) and species-specific genes (white). B. Distribution of D. pulex gene family sizes comparing genes with and without detectable homology to other genomes. C. History of gene family expansions and losses among pancrustacean plus representative deuterostome genomes with the outgroup Nematostella vectensis. Tree topology is fixed from the assumed species phylogeny and used to map gene family histories by a combination of gene similarity and character-state optimization with Dollo parsimony (SOM IV.2). Branch-lengths scaled to differences between inferred gene gains and losses. Scale bar corresponds to 1,000 genes gained. Gene gains along each branch of the tree, relative to the largest measured gain along the branch leading to D. pulex scaled to have the maximum value of 1 (blue), gene losses along each branch, scaled by the maximum loss along the branch leading to Caenorhabditis elegans (yellow). D. Frequency of pair-wise genetic divergence at silent sites (Ks) among all gene duplicates in the D. pulex, C. elegans and H. sapiens genomes, for genes with >100 aligned amino acids and percent identity >40%. (66,502, 12,570 and 64,783 pair-wise comparisons for the three genomes, respectively). The vertical axis differs for D. pulex.
To better understand gene duplication in the Daphnia genome, we examined the age distribution of gene duplicates, by estimating Ks for 66,502 pair-wise combinations of paralogs showing >40% sequence similarity, and by comparing this distribution to that of 12,570 nematode and 64,783 human gene pairs (Fig. 1D). The single-pair duplicates within the youngest cohort (Ks < 0.01) suggests that D. pulex genes duplicate at a rate 3× greater than those measured for fly and nematode, and 30% greater than human, even when we exclude nearly identical gene copies that may be biased by gene conversion (Table S29; Figs. S17-18).
In the genomes of many species, new duplicate genes are found in clusters (Fig. S19) (15). The D. pulex genome shows ~ 20% (Table S30) of all genes tightly arranged in clusters of 3 to 80 paralogs, and with elevated numbers of tandemly duplicated genes at intervening intervals of 1,000 to 2,000 bp (Fig. S20). The age distribution and positioning of gene duplicates indicate that Daphnia has not experienced whole-genome duplication, but the genome is instead characterized by a high and historically steady rate of tandem duplication (Fig. 1D).
Nine gene families have expanded independently in Daphnia and aquatic lineages including vertebrates (Tables S26, S31). These include photo-reactive or photo-responsive gene families (cryptochromes, opsins, G proteins). The D. pulex genome shows 46 opsins (Table S32; Figs. S21-22) of which 42 derive from two rhabdomeric subfamilies, one ciliary pteropsin subfamily, and a newly discovered lineage that forms a sister group to rhabdomeric opsins that we name arthropsins (SOM 4). Arthropsins are ancestral to the chordate melanopsin lineage and thus appear to have been retained in Daphnia, despite their loss from all other available bilateral animal genomes. The expansion of these gene families suggest that adaptations to a more complex light regime in aquatic environments (16-17) can be influential in shaping the gene content of these organisms.
Implications of Daphnia’s Genome Structure
Tandemly duplicated gene clusters are predisposed to homogenization by gene conversion and unequal crossing-over (18). If common, concerted evolution can maintain sequence and functional similarities among paralogs. We examined copied DNA segments among all paralogs in the genome (SOM V.1) and observed that 47% of the genes show tracts of non-allelic gene conversion compared to 12-18% of genes in five Drosophila species (Tables S33-38; Figs. S23-24). Thus, concerted evolution is affecting more than 1 Mb (8%) of all protein-coding sequences in Daphnia, especially when duplicates are oriented on the same strand, with a similar conversion rate (converted pairs of paralogs/total pairs of paralogs analyzed) and number of events per pair as Drosophila. The greater proportion of converted genes in D. pulex is mainly attributed to the greater number of targets for gene conversion within the genome, including tandemly duplicated gene clusters with intervening genes. Conversion events in Daphnia are less common among the youngest duplicates, and within gene families containing only two paralogs.
One example of widespread gene conversion is found in the di-domain hemoglobin genes. Hemoglobin levels in the hemolymph of daphniids can rise by more than one order of magnitude in response to reduced oxygen availability in aquatic habitats, which fluctuates in diurnal and seasonal cycles (Fig. 2A). In Daphnia, a tandemly duplicated gene cluster of hemoglobin (Hb) genes contributes to the protein’s varying composition (19). We sequenced and assembled the full D. magna cluster to compare with the arrangement of eight clustered D. pulex hemoglobin genes (Figs. S25-27). (D. pulex also has three non-clustered Hb genes.) Notably, the two species show almost identical gene arrangements within an interval of ~23.5 Kb (Table S39) except for the obvious absence of Hb6 from the D. magna cluster (Fig. 2B). In both species, a non-coding RNA gene interrupts the cluster between Hb4 and Hb5, and hypoxia response elements plus ancillary sequences are preserved within the regulatory regions of each gene. Thus, the duplication and subsequent divergence of hemoglobins must have occurred prior to the divergence time of D. pulex and D. magna.
Figure 2.
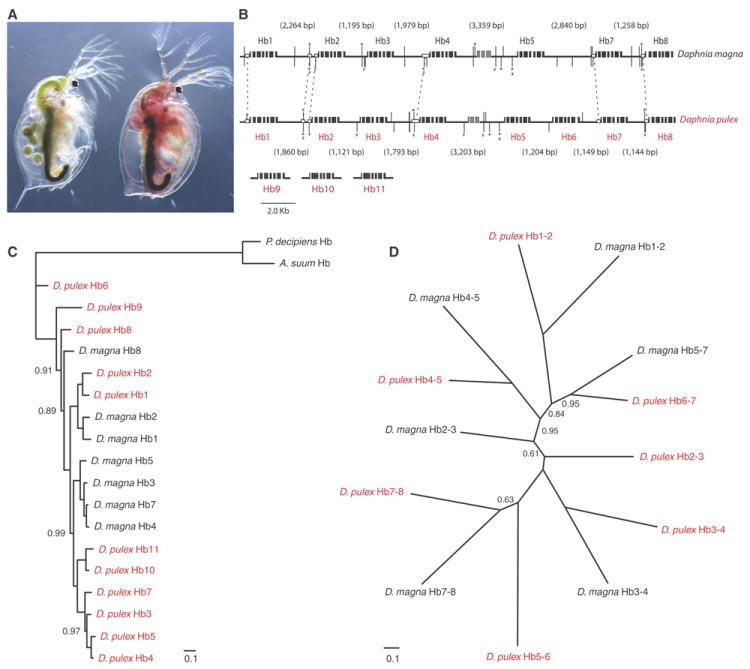
Evolution of Daphnia di-domain hemoglobin (Hb) genes. A. When deprived of oxygen, many species (here D. magna) increase hemoglobin concentration in the hemolymph by 15-20 fold within a single molting, coloring the body red. B. Organization of the Hb gene cluster in the D. magna and the D. pulex genomes. Black boxes are exons. Gray boxes are exons of an RNA gene. Vertical bars are Hypoxia Response Elements (HRE) and asterisks show ancillary elements. Conserved HREs are linked by hatches. Open boxes represent highly similar sequences. The lengths of intergenic regions are shown in parentheses. Daphnia pulex genes Hb9-11 are located on separate sequence scaffolds. C. Phylogenetic tree (SOM V.2) from nucleotide sequences of Hb genes in D. pulex (red) and in D. magna (black). Outgroup Hb cDNA sequences are from Ascaris suum and Pseudoterranova decipiens. Scale bar shows mean number of differences (0.1) per nucleotide along each branch. Posterior probability node support <100% are shown. D. Phylogenetic tree based on nucleotide sequences of intergenic regions between the stop codons and the downstream TATA of the neighboring gene. Posterior probabilities <100% are shown.
However, a phylogenetic analysis of protein-coding sequences (SOM V.2) suggests that most hemoglobin genes have duplicated independently within each species (Fig. 2C). A separate phylogenetic reconstruction using sequences from intergenic regions recovers a tree that is consistent with duplication prior to speciation (Fig. 2D). Because the support values at nodes for both trees are equally strong, we conclude that gene conversion tracts are homogenizing the protein coding regions. The hemoglobin gene clusters in both species are homologs because of ancestral gene duplications, yet the duplication history of genes is obfuscated by independent gene conversions facilitated by their ordered arrangement in the genomes.
Evolutionary Diversification of Duplicated Genes
Gene duplication is an important source of evolutionary novelty. After duplication, one copy is commonly disabled by mutation and becomes a pseudogene. This fate may be avoided if selection maintains both copies via gene dosage, novel function, or by subdividing the gene’s original function into multiple components (20). We conducted microarray experiments to determine the magnitude of functional divergence among paralogs, then traced (21) and tested (22) whether their patterns of gene transcription differ in 1 to 12 ecologically relevant conditions as a function of Ks (Table S40; SOM VI.1). As expected, many recent duplicates (Ks < 0.05) have indistinguishable gene expression patterns for the tested conditions (47%; Fig. 3A). Within many gene families, divergence in expression patterns correlate with age (Figs. S28-29). We found that long-wavelength opsins most similar in sequence have the same expression patterns (correlation > 0.9) but then diverge in their response to shared conditions as they age, at an estimated rate of 0.6% per 10% synonymous nucleotide substitutions. A similar pattern is observed for the di-domain hemoglobins, albeit with more rapid divergence in expression.
Figure 3.
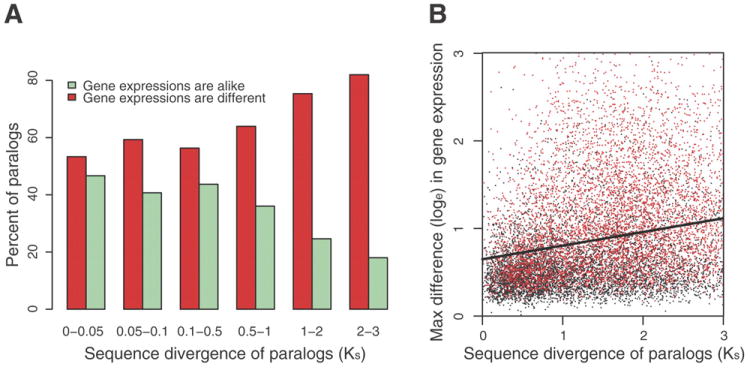
Functional diversification of duplicated genes, from 12 microarray experiments. A. The fraction of duplicated genes with similar versus divergent DE patterns as a function of their pair-wise divergence at silent sites (Ks). B. Regression (r = 0.29) of the maximum observed difference (treatment versus control) between duplicated genes among the 12 conditions as a function of the age of duplicated genes inferred from Ks. Red points are significant values (p < 0.05, ANOVA). The regression line Y-axis intercept (ln 0.642 ± 0.009) suggests that, on average, newly duplicated genes may differ in expression by as much as 1.9 fold at particular conditions, which is significantly different from zero (t = 68.7, p < 2 × e-16) and validated by tiling microarray data (r = 0.16; t = 75.3, p < 2 × e-16).
In contrast to the steady expression divergence of many duplicates, we observed an equally large fraction of recently arisen paralogs – with nearly identical sequences – that differ in their expression in at least one condition (Fig. 3A). While we could confidently detect locus specific expression for only a fraction of the youngest duplicates represented on the microarray (Table S40), a plot of the maximum difference in the expression response of paralogs to an identical condition suggests that, on average, newly duplicated genes may differ in expression by as much as 1.9 fold (Fig. 3B). These may be cases where new regulatory programs were created by the gene duplication itself; through a failure to copy regulatory elements or when a duplicate is integrated within a new genomic location (23).
Gene conversion, homogenizing non-regulatory nucleotide sequences, can contribute to this class of highly Differentially Expressed (DE) paralogs at low sequence divergence (Ks). We tested whether gene conversion accounts for the differences in the evolutionary rates of expression divergence by comparing duplicates (Ks < 2) on the basis of their structural arrangements in the genome (SOM VI.2). Neighboring paralogs within tandem gene clusters were just as likely to diverge in expression as dispersed duplicates outside of clusters (χ2 = 0.027, p = 0.87). Globally, gene conversion reduces the expression-level divergence of paralogs (χ2 = 11.9, p = 0.0005; Table S41), yet we detected no significant impact on the observed fractions of divergently expressed paralogs when we removed duplicated genes with signatures of gene conversion (Table S42). Although adjacent genes are often co-expressed (24), the local placement of genes within tandem gene clusters has no clear effect on gene expression divergence in D. pulex. We thus conclude that paralogs, even in tandem, frequently acquire divergent expression patterns at, or soon after, the time of duplication.
Functional Significance of Expanded Gene Families
To investigate the functional role of paralogs and their preservation, we examined interacting genes with known function. A total of 1,908 genes representing 563 enzymes were charted onto the global metabolic pathway for D. pulex by referencing the metabolic enzyme networks of three insects and four vertebrates (Fig. 4; SOM VII.1). Of these, 38 gene families were amplified in Pancrustacea, of which 32 are expanded in the lineage leading to Daphnia (Figs. S30-31; Tables S43-44). Half (19/38) of the amplified genes are non-randomly clustered within seven distinct pathways (p < 0.03 by exact binominal test and p < 0.03 by network permutation analysis; Fig. 4 panels A-G; Fig. S32). These data, showing co-expansion of genes within pathways, suggest that duplicated genes can be interdependent.
Figure 4.
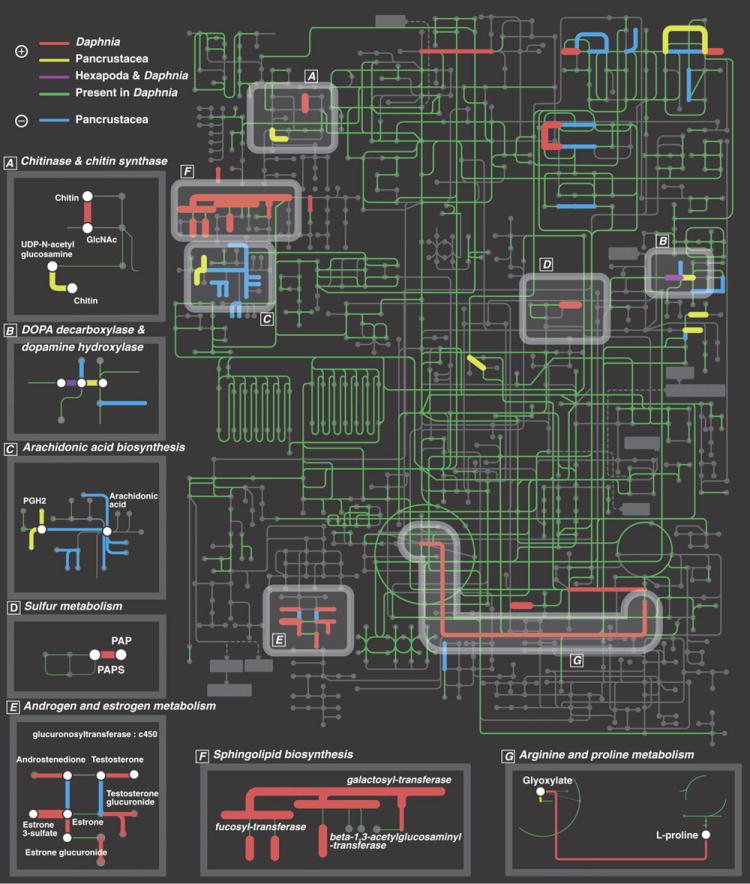
Map of global KEGG metabolic pathway in D. pulex showing significantly expanded or contracted gene families in metabolic pathways. Nodes and edges represent compounds and enzymes respectively. Expanded gene families in D. pulex (red); expanded gene families in Pancrustacea (yellow); independently expanded gene families in D. pulex and in insects (purple); contracted gene families in Pancrustacea (blue); and genes present in D. pulex (green). Amplification of gene families encoding each highlighted enzyme is supported by the Fisher exact test (thick edges are supported by Bonferroni correction), on the basis of the distribution of the number of genes encoding corresponding enzymes among Homo sapiens, Mus musculus, Gallus gallus and Tetraodon nigroviridis, Drosophila melanogaster, Apis mellifera and Anopheles gambiae. Emphasized pathways (A-G) include at least two cases of expanded interacting enzymes. The non-random co-expansion of interacting enzymes is supported by exact binomial test (p < 0.03) and by the node permutation test on 1,000 randomized metabolic networks (p<0.03).
A study of the expression-patterns of duplicated genes from this metabolic network (SOM VII.2) reveals greater average similarity between genes from co-expanding and interacting families (same KEGG map ID in Table S43) than between genes from non-associating families (t = 3.30, p = 0025). This pattern suggests non-independent functional divergence of expanding genes within pathways (e.g. Tables S45-48; Figs. S33-34). One example involves nine clades of fucosyltransferase paralogs that share 95% amino acid similarity (colored lines in Fig. S35) and have independently diversified to express seven transcriptional profiles shared with interacting glycosyltransferase paralogs. Such a pattern of co-divergence suggests a decoupling of duplication history and functional association. To test this prediction, we estimated the ratio of among-group variance to total variance in differential expression (Dst) for phylogroups of fucosyltransferase paralogs and for expression profile clusters (SOM VII.2). We detect no significant subdivision of expression patterns for fucosyltransferase paralogs based on phylogeny (blue nodes in Fig. S35; Dst = 0.0042, p = 0.89). By contrast, clusters based on transcriptional profiles, and including distantly related paralogs and interacting glycosyl transferase paralogs, show significant subdivision (Dst = 0.0836, p = 0.002).
Ecoresponsive Genes
The D. pulex genome contains many duplicated genes with unknown homology. Although this may diminish with the availability of more crustacean genomes, these unknown genes appear to play important roles in the animal’s ecology. ESTs from 37 cDNA libraries representing transcriptomes of daphniids exposed to biotic ecological challenges, abiotic ecological stressors and different life-history stages in laboratory environments (Table S10) show that genes unique to the Daphnia lineage, and genes that reside within tandemly duplicated gene clusters, are significantly over-represented within transcriptomes under ecological conditions (Fig. 5A; Table S49; χ2 = 265.1 p = 2.66 × e-58 and χ2 = 41.0 p = 1.23 × e-09, respectively). Whole-genome tiling-expression microarray experiments show differential expression to be twice as frequent in genomic regions devoid of gene models (intergenic) when D. pulex are exposed to ecological conditions compared to conditions of life-history (Table S50; Fig. S36).
Figure 5.
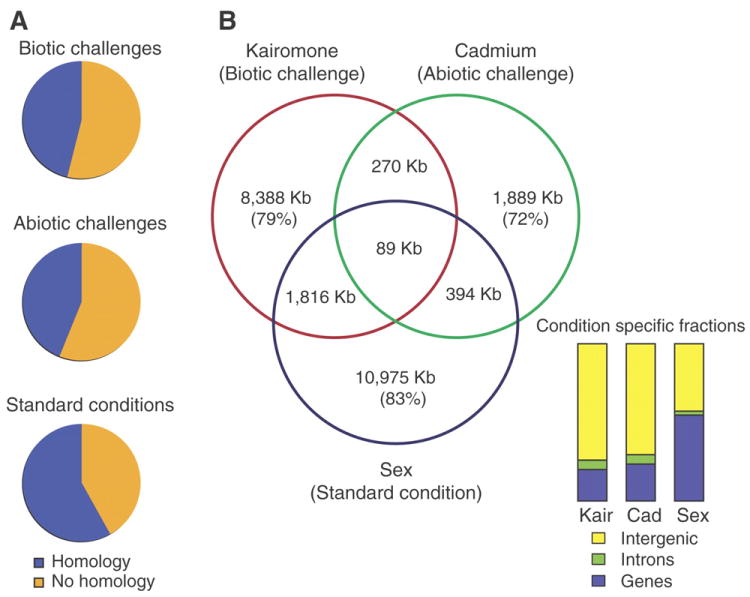
Function of genes unique to the D. pulex lineage. A. Pie charts show the distribution of ESTs from genes without detectable homology to other sequenced genomes, sampled under exposure to bacterial infection, predators, hormones, varying diets (biotic challenges), environmental toxicants, elevated UV, hypoxia, acid, salinity and calcium starvation (abiotic challenges), in addition to various stages of life-history within a controlled laboratory environment (standard conditions). B. Differential expression of the genome upon exposure to Chaoborus kairomone (Kair), cadmium (Cad), and by sex, measured as nucleotides in kilobases (Kb) on genome tiling microarrays. Comparing three experimental conditions, 79%, 72% and 83% of transcriptomes are condition-specific (Venn diagram) and twice as pronounced in genomic regions that are currently void of gene models (yellow) when D. pulex are exposed to ecological conditions.
We count 34,844 transcriptionally active regions (TARs) within unannotated regions of the genome, showing predictable exon-intron intervals supporting additional gene models not yet included within the minimum set (TAR-genes, Table S12) and that are condition-dependent in their regulation. By partitioning the differentially expressed genome by experimental conditions, between 72% and 85% of the transcriptome uniquely responded to one of the three conditions (Fig. 5B). In all, 73% of differential regulation under biotic or abiotic stressors requires additional gene models or extensions.
Evolutionary Perspectives
Daphnia pulex paralogs follow different evolutionary trajectories that are determined, in part, by their initial transcriptional expression patterns. At least half appear to acquire divergent expression patterns at or near the time of origin. Interacting and co-expanding genes can also appear to be co-diverging in their responses to environmental conditions. These observations suggest that the persistence of this distinctive class of functionally divergent gene duplicates is due to preservation by entrainment (PBE). Entrainment is defined as the process of increasing the initial probability of preserving a duplicated gene through its functional interaction with existing or newly interacting genes sharing regulatory programs. Because biological processes can be governed by interdependent regulation of interacting genes, there are three likely evolutionary outcomes for these interacting duplicated genes (Fig. 6). Genes with expression patterns unchanged at the time of duplication may continue to share the condition-specific regulation of existing interacting genes (Fig. 6A). In this scenario, selection for gene dosage may increase the probability that gene duplicates are preserved (25). Alternatively, duplicates may initially have divergent expression patterns, but have inappropriate transcriptional responses to environmental conditions, or lack appropriately co-regulated interacting genes (Fig. 6B). Duplicates within this category are most likely lost. In contrast, genes with divergent expression patterns at the time of duplication, yet with regulation sufficiently similar to the expression patterns of a different interacting gene, may have combined products that are beneficial under a distinct environmental condition (Fig. 6C). In this scenario, the likelihood for preservation of these new gene duplicates is increased. Thus, when genes are advantageous at the time of duplication, their coding regions are subject to purifying selection from the start, and are entrained to a distinct regulatory pattern dictated by condition-specific gene-gene interactions. Although the likelihood of converging on a beneficial gene expression profile near the time of duplication is very small, in the case of Daphnia, PBE is facilitated by the high rate of gene duplication, resulting in co-regulated interacting genes that can potentially define environment-specific transcriptomes, which may increase with the complexity of interactions between organisms and their environments.
Figure 6.
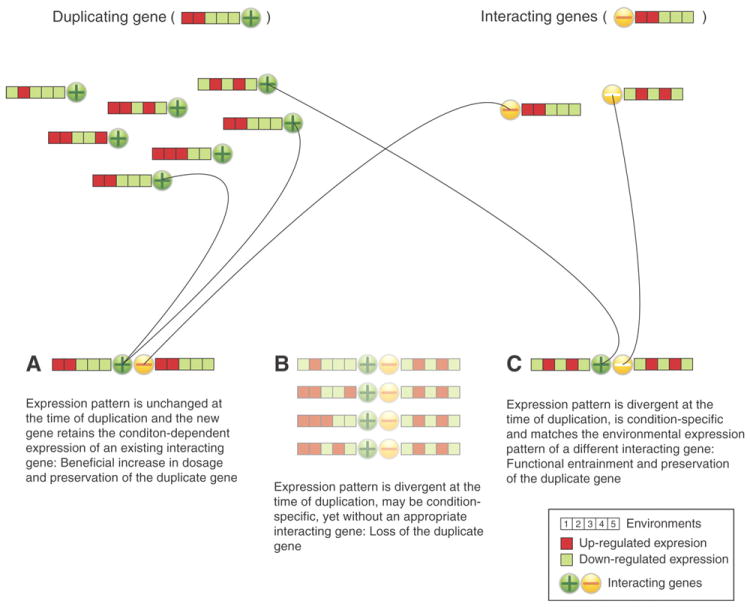
Model of gene duplication under the preservation by entrainment (PBE) model. A. B2BA (Born to be Alike), shows duplicated genes with unaltered expression patterns that are preserved because of beneficial increase in dosage (20) in association with the condition-dependent expression of an interacting gene. B. B2BU (Born to be Useless) genes with initially divergent expression patterns, and with inappropriate condition-dependent responses, or interacting genes are most likely lost. C. B2BD (Born to be Different) when the derived expression pattern of a paralog at the time of duplication is shared with a different interacting gene (white negative sign), and when the effect of their combined products is beneficial under a distinct environmental condition the likelihood for preservation is increased. Color-coding represents condition-dependent expression patterns across multiple environments; empty boxes indicate no interacting gene with appropriate expression pattern. Lines represent the process of functional entrainment.
In conclusion, by examining genome structure and the functional responses of genes to environmental conditions within species with tractable ecologies, we further our understanding of gene-environment interactions in an evolutionary context. Many responsive genes to ecological conditions have unknown function, and information from laboratory model species may be insufficient because of a lack of homology or experimentally demonstrated functions in response to the environment. Thus, ecological genomics requires empirical annotations of new genome sequences from a broader diversity of species, tested under a variety of natural conditions.
Supplementary Material
Acknowledgments
We thank Marvin Frazer (JGI), Peter Cherbas (CGB), Roland Green and Tsetska Takova (Roche NimbleGen, Inc.). The work conducted by the U.S. Department of Energy Joint Genome Institute (JGI) was supported by the Office of Science of the U.S. Department of Energy under Contract No. DE-AC02-05CH11231, and in collaboration with the Daphnia Genomics Consortium (DGC). This project was also supported by major NSF grants 0221837 and 0328516, and NIH grant IR24GM07827401A1. Coordination infrastructure for the DGC is provided by The Center for Genomics and Bioinformatics (CGB) at Indiana University, which is supported in part by the METACyt Initiative of Indiana University, funded in part through a major grant from the Lilly Endowment, Inc. Additional contributions and acknowledgements are provided in the SOM. Our work benefits from, and contributes to the Daphnia Genomics Consortium.
Footnotes
References
- 1.Carpenter SR, et al. Ecology. 1987 Dec;68:1863. doi: 10.2307/1939878. [DOI] [PubMed] [Google Scholar]
- 2.Shaw JR, et al. In: Advances in experimental biology on toxicogenomics. Hogstrand C, Kille P, editors. 165-219. Elsevier Press; 2008. pp. 165–219. [Google Scholar]
- 3.Martins J, Teles LO, Vasconcelos V. Environ Int. 2007 Apr;33:414. doi: 10.1016/j.envint.2006.12.006. [DOI] [PubMed] [Google Scholar]
- 4.Hebert PDN. In: Daphnia. Peters RH, de Bernardi R, editors. Vol. 45. Memorie dell’Istituto Italiano di Idrobiologia; 1987. pp. 439–460. [Google Scholar]
- 5.Tollrian R, Dodson SI. In: The ecology and evolution of inducible defenses. Tollrian R, Harvell CD, editors. Princeton University Press; 1999. pp. 177–202. [Google Scholar]
- 6.Zeis B, Schwerin S, Pirow R, Lamkemeyer T, Paul RJ. Comp Biochem Phys A. 2008 Sep;151:S38. [Google Scholar]
- 7.Colbourne JK, Hebert PDN, Taylor DJ. In: Molecular Evolution and Adaptive Radiation. Givnish TJ, Sytsma KJ, editors. Cambridge University Press; Cambridge: 1997. pp. 163–188. [Google Scholar]
- 8.Lynch M, Sptize K. In: Ecological Genetics. Real L, editor. Princton University Press; Princeton, New Jersey: 1994. pp. 109–128. [Google Scholar]
- 9.Boore JL, Lavrov DV, Brown WM. Nature. 1998 Apr 16;392:667. doi: 10.1038/33577. [DOI] [PubMed] [Google Scholar]
- 10.Taylor DJ, Crease TJ, Brown WM. P Roy Soc Lond B Bio. 1999 Apr 22;266:791. [Google Scholar]
- 11.Pena-Castillo L, Hughes TR. Genetics. 2007 May;176:7. doi: 10.1534/genetics.107.074468. [DOI] [PMC free article] [PubMed] [Google Scholar]
- 12.Aparicio S, et al. Science. 2002 Aug 23;297:1301. [Google Scholar]
- 13.Cristescu MEA, Colbourne JK, Radivojc J, Lynch M. Genomics. 2006 Oct;88:415. doi: 10.1016/j.ygeno.2006.03.007. [DOI] [PubMed] [Google Scholar]
- 14.Colbourne JK, Pfrender M. BioMed Central. 2009 [Google Scholar]
- 15.Zhou Q, et al. Genome Res. 2008 Sep;18:1446. doi: 10.1101/gr.076588.108. [DOI] [PMC free article] [PubMed] [Google Scholar]
- 16.Storz UC, Paul RJ. Journal of Comparative Physiology a-Neuroethology Sensory Neural and Behavioral Physiology. 1998 Dec;183:709. [Google Scholar]
- 17.Wang FY, Yan HY, Chen JSC, Wang TY, Wang DY. Vision Res. 2009 Jul;49:1860. doi: 10.1016/j.visres.2009.04.023. [DOI] [PubMed] [Google Scholar]
- 18.Hoffmann FG, Opazo JC, Storz JF. Mol Biol Evol. 2008 Mar;25:591. doi: 10.1093/molbev/msn004. [DOI] [PubMed] [Google Scholar]
- 19.Kimura S, Tokishita S, Ohta T, Kobayashi M, Yamagata H. J Biol Chem. 1999 Apr 9;274:10649. doi: 10.1074/jbc.274.15.10649. [DOI] [PubMed] [Google Scholar]
- 20.Innan H, Kondrashov F. Nat Rev Genet. 2010 Feb;11:97. doi: 10.1038/nrg2689. [DOI] [PubMed] [Google Scholar]
- 21.Casneuf T, De Bodt S, Raes J, Maere S, Van de Peer Y. Genome Biol. 2006;7 doi: 10.1186/gb-2006-7-2-r13. [DOI] [PMC free article] [PubMed] [Google Scholar]
- 22.Gu ZL, Rifkin SA, White KP, Li WH. Nat Genet. 2004 Jun;36:577. doi: 10.1038/ng1355. [DOI] [PubMed] [Google Scholar]
- 23.Katju V, Lynch M. Mol Biol Evol. 2006 May;23:1056. doi: 10.1093/molbev/msj114. [DOI] [PubMed] [Google Scholar]
- 24.Lercher MJ, Blumenthal T, Hurst LD. Genome Res. 2003 Feb;13:238. doi: 10.1101/gr.553803. [DOI] [PMC free article] [PubMed] [Google Scholar]
- 25.Kondrashov FA, Rogozin IB, Wolf YI, Koonin EV. Genome Biol. 2002;3 doi: 10.1186/gb-2002-3-2-research0008. [DOI] [PMC free article] [PubMed] [Google Scholar]
Associated Data
This section collects any data citations, data availability statements, or supplementary materials included in this article.