

Abstract
In many mammals, body weight increases continuously throughout adulthood until late middle age. The hormone leptin is necessary for maintaining body weight, in that high levels of leptin promote negative energy balance. As animals age, however, their increase in body weight is accompanied by a steady rise in circulating leptin levels, indicating the progressive development of counterregulatory mechanisms to antagonize leptin's anorexigenic effects. Hypothalamic neurons coexpressing agouti-related peptide (AgRP) and neuropeptide Y are direct leptin targets. These neurons promote positive energy balance, and they inhibit anorexigenic proopiomelanocortin (POMC) neurons via direct neuropeptide action and release of γ-aminobutyric acid. We show here that AgRP and neuropeptide Y innvervation onto POMC neurons increases dramatically with age in male mice. This is associated with progressive increase of inhibitory postsynaptic currents and decrease of POMC firing rate with age. Neuronal activity is significantly attenuated in POMC neurons that receive a high density of AgRP puncta. These high-density AgRP inputs correlate with leptin levels in normal mice and are nearly absent in mice lacking leptin. The progression of increased AgRP innervation onto POMC somas is accelerated in hyperleptinemic, diet-induced obese mice. Together our study suggests that modulation of hypothalamic AgRP innervation constitutes one mechanism to counter the effects of the age-associated rise in leptin levels, thus sustaining body weight and fat mass at an elevated level in adulthood.
In humans, men and women 40–59 yr of age in every major racial and ethnic group have much greater prevalence of obesity compared with those 20–39 yr of age (1). Age is an important contributing factor in the development of obesity in the general population and may reflect the biological regulation of body weight at an individual level (2, 3). Leptin, an adipose-derived hormone, circulates at levels proportional to the body's fat mass to convey the abundance of peripheral energy stores to the brain. Administration of leptin into the hypothalamus of mice reduces food intake and body weight. Most obese humans and rodents exhibit hyperleptinemia yet are resistant to leptin's effects on food intake and weight loss, a condition termed leptin resistance (4). Recent studies have demonstrated that hyperleptinemia, but not obesity alone, is required for the development of leptin resistance (5). Chronic elevation of leptin levels via transgenic overexpression of leptin predisposes lean mice to develop leptin resistance and diet-induced obesity later in life (6–9). These studies suggest that leptin plays a role in the development of leptin resistance. In many mammals, body adiposity as well as plasma leptin concentrations increases from early adulthood through late middle age (10, 11), suggesting the development of leptin resistance with age. Functional age-associated leptin resistance has been demonstrated in rodents, in which leptin's weight loss effects are attenuated in middle-aged vs. young adult rats when leptin is directly injected into the brain (12). Despite the realization of age-dependent leptin resistance, the underlying mechanisms are undefined.
Located in the arcuate nucleus (ARC) of the hypothalamus, the anorexigenic proopiomelanocortin (POMC), and the orexigenic agouti-related peptide (AgRP)-expressing neuronal subpopulations are essential for body weight regulation. POMC and AgRP neurons express leptin receptor long form (LepRb) and are regulated by leptin in an opposing fashion. High levels of leptin promote negative energy balance by activating POMC neurons and inhibiting AgRP neuronal function (13). These AgRP neurons are exclusively located within the ARC, release γ-aminobutyric acid (are GABAergic), and coexpress another potent orexigen, neuropeptide Y (NPY). AgRP neurons function by directly inhibiting downstream targets, including POMC neurons (14, 15). The release of NPY and γ-aminobutyric acid (GABA) from AgRP neurons potently hyperpolarizes POMC neurons (15, 16). Thus, AgRP neurons exert their orexigenic effects to an important extent by tonically inhibiting the activity of POMC neurons. In this study, we show that AgRP and NPY innervation onto POMC neurons undergoes a progressive and pronounced increase with age, which may constitute a mechanism to counter the effects of rising plasma leptin levels during age progression.
Materials and Methods
Animal use and care
Male mice used were of C57BL/6J background except LepRb-Cre, Stat3f/f mutants were on mixed genetic background (17). Body composition was measured using dual-energy x-ray absorptiometry with a PIXImusII scanner (Lunar, Madison, WI). Mice were housed in a pathogen-free, temperature- (22 C), humidity-, and light (lights on 0700–1900 h)-controlled environment with ad libitum chow (Purina mouse diet 5058, 21.6% kcal from fat; Purina, St. Louis, MO) and water access. Wild-type plasma leptin levels were acquired using the same cohort of mice and were measured with leptin ELISA kits (Crystal Chem, Chicago, IL). For the high-fat feeding experiment, 16-wk-old C57BL/6Tac wild-type male mice were obtained from Taconic Farms (Hudson, NY). Diet-induced obese mice had been placed on high-fat diet (Research Diets, D12492, 60% kcal from fat; Research Diets Inc., New Brunswick, NJ) at 6 wk of age, whereas controls were fed regular chow (NIH no. 31M Rodent Diet; National Institutes of Health, Bethesda, MD). All procedures were approved by the University of California, San Francisco, Institutional Animal Care and Use Committee.
Immunofluorescence
Mouse brains were perfused with paraformaldehyde, cryosectioned, and immunostained as previously described (18–20). To reveal POMC cell bodies and/or projections, the antibodies used were mouse anti-ACTH (Abcam, Cambridge, MA), guinea pig anti-ACTH (National Hormone and Peptide Program, Torrance, CA), or rabbit anti-ACTH (National Hormone and Peptide Program). The mouse and guinea pig anti-ACTH antibodies required a citrate boiling unmasking step. Guinea pig anti-AgRP (Abcam), rabbit anti-NPY (Peninsula Laboratories, Belmont, CA), and rabbit anti-c-fos (Abcam) antibodies were also used. c-Fos immunoreactivity was best revealed after serial 10-min unmasking steps of base solution (1% NaOH, 1% H2O2), PBS with 0.3% glycine, and PBS with 0.3% sodium dodecyl sulfate. Neuronal somas were detected using an antihuman neuronal protein HuC/D antibody (Invitrogen, Carlsbad, CA). Secondary antibodies used included Alexa 488, 555, 594, and 633 (Molecular Probes, Eugene, OR). Sections were mounted using Vectashield with 4′,6′-diamino-2-phenylindole (DAPI; Vector Laboratories, Burlingame, CA). Images were blinded for analysis.
Radioimmunoassays
Hypothalami were dissected from 2-month-old and 14- to 16-month-old male mice, homogenized in an acetic acid solution containing peptide inhibitors. ACTH was measured by an RIA developed in the laboratory of Dr. Eduardo Nillni (Division of Endocrinology, The Warren Alpert Medical School of Brown University/Rhode Island Hospital, Providence, RI) using commercially available peptides and primary antibodies as previously described (21).
Quantification of immunofluorescence images
Quantification of high-density AgRP/NPY puncta clusters
Fluorescence images were captured using a Zeiss Axioscope2 wide-field microscope equipped with an AxioCam digital camera(Carl Zeiss, New York, NY). Images were viewed as followed, using either Adobe Photoshop (San Jose, CA) or ImageJ (National Institutes of Health, Bethesda, MD). AgRP/NPY and DAPI stains were viewed and high-density clusters were quantified. High-density clusters were counted if they met the following criteria: 1) contained more than 10 distinct puncta; 2) had a diameter that was approximately the width of a cell soma (10–20 μm); 3) formed a full circle; and 4) contained a single nucleus within the structure. When POMC staining was also used, the AgRP/NPY stains were hidden, and the ACTH staining was observed to quantify and locate the POMC somas. Finally, the AgRP/NPY staining was overlaid with the POMC staining to reveal which POMC somas were surrounded by previously identified clusters. Counting of the same images on separate occasions yielded approximately 90–95% confidence. Sections were grouped according to region as follows: posterior, bregma −2.30 to −2.46 mm; medial, bregma −1.94 to −2.06 mm; and anterior, bregma −1.58 to −1.70 mm. At least two sections per mouse per region were quantified and then averaged to obtain a value for that particular mouse. Values for at least three mice were averaged to obtain the high-density input cluster count for a specific age/region group.
Confocal analysis and quantification of puncta density
Optical sections were acquired using a Leica SL upright confocal microscope (Buffalo Grove, IL). Because the medial/anterior regions of the ARC are more densely populated with POMC neurons than the posterior regions, brain sections between bregma −1.76 to −1.88 mm were stained for POMC and AgRP or NPY. Images were taken every 3 μm using the same laser, photomultiplier tube, and pinhole settings. Color channels were kept separate as images were analyzed with ImageJ. For each immunoreactive POMC cell, the image containing the soma with the widest circumference was manually identified. To eliminate selection bias, all somas that immunostained for POMC were analyzed. The circumference of each soma was traced and measured. The trace of that soma was then transferred to the image of the AgRP or NPY puncta within the same focal plane. The number of distinct inputs that came directly into contact with the trace were manually counted and then normalized to the circumference of the POMC soma. Sixteen to 72 cells per animal were analyzed, averaged per mouse, and then grouped according to age/condition. Averages and percentages were configured based on individual mice within a particular group. The threshold of AgRP input density onto POMC neurons was determined at the beginning of the project as 3 sd above the median for high density (27 or more puncta per 100 μm membrane of POMC perikarya) and 1 sd for low density (1.5 or less puncta per 100 μm membrane of POMC perikarya). These criteria resulted in an even proportion of high- and low-density neurons for 9-month-old fed mice and were used throughout the entire study. The cutoff for high density in the confocal analysis corresponded to a density similar to that as a high-density cluster in a wide-field image.
Comparing c-fos reactivity with AgRP puncta density
Nine-month-old C57BL6/J male mice that expressed a microtubule-associated protein tau (MAPT)-topaz green fluorescent protein under the transcriptional control of the mouse POMC-α promoter (Jackson Laboratories, Bar Harbor, ME) were used to identify the POMC somas. Mice were injected with 3 mg/kg of leptin 45 min before perfusion. Confocal analysis was performed as described above, with images taken every 1 μm. In addition, somatic POMC/Topaz and c-fos staining were then viewed simultaneously to determine c-fos reactivity. A total of 123 cells from three different animals were quantified.
Electrophysiology
Brain slice preparation for electrophysiology
Coronal mouse brain slices (250–300 μm) were cut with a vibration microtome (Thermo Scientific, Waltham, MA) under cold (4 C), carbogenated (95% O2 and 5% CO2), glycerol-based modified artificial cerebrospinal fluid (22) to enhance the viability of neurons. Glycerol-based modified artificial cerebrospinal fluid contained the following (in millimoles): 250 glycerol, 2.5 KCl, 2 MgCl2, 2 CaCl2, 1.2 NaH2PO4, 10 HEPES, 21 NaHCO3, 5 glucose (pH 7.2, ∼310 mOsm). Brain slices were transferred into carbogenated artificial cerebrospinal fluid (aCSF), first kept for 20 min at 35 C (recovery bath) and then at room temperature (24 C) for at least 30 min before recording. Slices were transferred to the recording chamber (∼3 ml volume) and continuously superfused with carbogenated aCSF at a flow rate of approximately 2 ml/min−1. aCSF contained the following (in millimoles): 125 NaCl, 2.5 KCl, 2 MgCl2, 2 CaCl2, 1.2 NaH2PO4, 21 NaHCO3, 10 HEPES, and 5 glucose (pH 7.2, ∼310 mOsm).
Patch clamp recordings
Current and voltage clamp recordings were performed in mice that expressed enhanced green fluorescent protein selectively in POMC neurons of the hypothalamus (14), either in the whole-cell or perforated patch clamp configuration. Neurons were visualized with a fixed stage upright microscope (BX51WI; Olympus, Tokyo, Japan) using with infrared differential interference contrast optics (23) and fluorescence optics. Electrodes with tip resistances between 3 and 5 mΩ were fashioned from borosilicate glass (0.86 mm inner diameter; 1.5 mm outer diameter; Science Products, Hofheim, Germany) with a vertical pipette puller (Narishige, Tokyo, Japan). Recordings were made at room temperature. All recordings were performed with an EPC10 patch-clamp amplifier (HEKA, Lambrecht, Germany) controlled by the program Patch-Master (version 2.32; HEKA). Data were sampled at 10 kHz and low-pass filtered at 2 kHz with a four-pole Bessel filter. The calculated liquid junction potential between intracellular and extracellular solution was also compensated.
Perforated-patch clamp recordings
Perforated patch recordings were conducted using modified protocols (24, 25). aCSF was used as extracellular solution. Recordings were performed with ATP and GTP free pipette solution containing the following (in millimoles): 128 K-gluconate, 10 KCl, 10 HEPES, 0.1 EGTA, 2 MgCl2 (pH 7.3, ∼300 mOsm). The liquid junction potential (+14.6 mV) was compensated. ATP and GTP were omitted from the intracellular solution to prevent uncontrolled permeabilization of the cell membrane (26). The patch pipette was tip filled with internal solution and backfilled with 0.02% tetraethylrhodamine-dextran (Invitrogen). Amphotericin B (Sigma, St. Louis, MO) was dissolved in dimethyl sulfoxide (27). The dimethyl sulfoxide concentration (0.1–0.3%) had no obvious effect on the investigated neurons. Amphotericin B had a final concentration of was approximately 200 μg/ml and was added to the modified pipette solution shortly before use. During the perforation process, access resistance was constantly monitored and experiments were started after access resistance and the action potential amplitudes were stable (∼15–30 min). A change to the whole-cell configuration was indicated by diffusion of tetraethylrhodamine-dextran into the neuron, and because we used an ATP-free pipette solution, a change to the whole-cell configuration was obvious by a spontaneous hyperpolarization of the neuron (due to ATP-sensitive potassium channel activation). Such experiments were rejected. Firing rate and membrane potential were determined as the mean over a 5-min interval after they had reached stable values after the perforation process (15–30 min).
Measurements of postsynaptic currents
Postsynaptic currents (PSCs) were measured in the whole-cell configuration. aCSF was used as extracellular solution. Patch pipettes were filled with the following (in millimoles): 140 KCl, 10 HEPES, 0.1 EGTA, 5 MgCl2, 5 K-ATP, 0.3 Na-GTP (pH 7.3, ∼300 mOsm). The high intracellular chloride concentration in the recording pipettes shifted the chloride equilibrium potential to a more depolarized potential, which reversed the polarity of GABAA receptor-mediated currents from outward to inward, and made their detection easier by increasing the driving force on the chloride ions. Cells were voltage clamped at −60 mV and data were sampled at 10 kHz. The liquid junction potential (+3.6 mV) was compensated. The contribution of excitatory (EPSCs) and inhibitory PSCs (IPSCs) to the synaptic input was determined in three steps. First, the overall frequency of PSCs was measured. Second, glutamatergic EPSCs were blocked with DL-2-amino-5-phosphonopentanoic acid (d-AP5; 50 μm; Sigma) and 6-cyano-7-nitroquinoxaline-2,3-dione (CNQX; 10 μm; Sigma) to isolate the IPSCs, which were identified as GABAergic (inhibitory) PSCs by their sensitivity to picrotoxin (100 μm; Sigma). The overall PSC frequency was determined after the recording had stabilized (>10 min after break in) for a 2-min interval. The IPSC frequency was measured after 10–15 min of d-AP5/CNQX application for a 2-min interval. The EPSC frequency was determined by subtracting the IPSC frequency from the overall frequency. The data were digitally filtered and the DC component was removed using the smooth (10 msec time period) and the DC remove (10 msec time period) functions in the Spike2 software (CED, Milwaukie, OR). PSCs were automatically detected when the signal crossed a threshold that was set and adjusted manually depending on the noise level of the signal. This semiautomated detection procedure was verified by visual inspection.
Statistical analyses
SPSS software (Chicago, IL) was used for statistical analysis. Unless noted, analysis was performed by a two-tailed Student's t test. For the leptin vs. age curves, repeated-measures ANOVA with multiple pairwise comparisons were configured using estimated marginal means with least significant difference adjustment. For statistics involving percentages, a nonparametric independent samples Mann-Whitney U test was performed. Significance in difference of distribution plots was calculated by an independent-samples two-tailed Kolmogorov-Smirnov test. Linear regression analysis was used to calculate the significance of a correlation. For the c-fos reactivity experiment, significance was determined by a χ2 test based on the number of cells in each group. Groups being compared are described in the figure legends. For the electrophysiology studies, data analysis was performed with Spike2 (version 6; CED), Igor Pro 6 (Wavemetrics, Lake Oswego, OR), and GraphPad Prism (version 5.0b; GraphPad Software Inc., San Diego, CA). To determine differences in means, a one-way ANOVA was performed; post hoc pairwise comparisons were performed using Student's t tests with the Newman-Keuls method for P value adjustment. A significance level of P = 0.05 was accepted for all tests (*, P ≤ 0.05; **, P ≤ 0.01;***, P ≤ 0.001 vs. controls). Data are presented as the mean ± sem.
Results
Body weight gain in mice during adulthood is associated with a progressive increase in AgRP innervation in the hypothalamus
In C57BL/6 male mice, body weight as well as fat mass increased with age (Fig. 1, A and B). Circulating leptin levels rose steadily and significantly with age (Fig. 1C). The coexistence of high leptin levels and elevated body weight indicates the development of counterregulatory mechanisms to antagonize leptin's effects on weight loss. To gain an understanding of the age-dependent regulation of energy balance, we first examined projection patterns of POMC as well as AgRP/NPY neurons in the hypothalami of young adult (2 months old) and late middle-aged (9–12 months old) male mice. There were no differences in the number of NPY or POMC cell bodies found within the arcuate nucleus of young adult vs. late middle-aged mice (data not shown). No gross morphological alterations in either NPY (Fig. 2A) or POMC projection patterns were detected. However, upon close inspection, a number of clusters containing a high-density of NPY puncta were observed in the hypothalami of middle-aged but not in young adult mice (Fig. 2, B and C). No such clustering of POMC innervations was observed in similar hypothalamic regions of middle-aged animals.
Fig. 1.
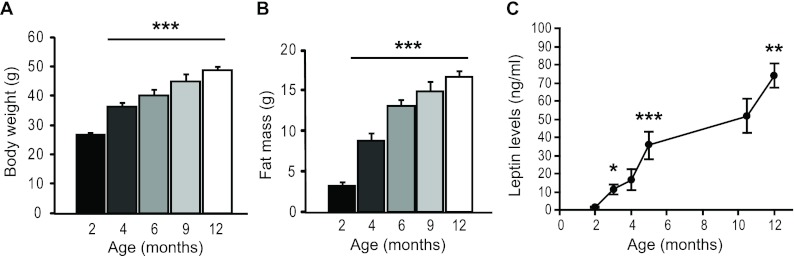
Age-associated increases in body weight, fat mass, and circulating leptin levels. A and B, Body weight and fat mass increase during adulthood (n = 6–10 for ages 2–6 months, n = 15–26 for ages 9–12 months). C, Leptin levels continually rise into middle age. Plasma leptin levels were measured at different ages from the same cohort of mice under normal chow-fed condition (n = 6). Data are presented as mean ± sem. *, P < 0.05, **, P ≤ 0.01, ***, P ≤ 0.001 compared with 2 months of age (A and B) and compared with previous leptin level (C).
Fig. 2.

Age-dependent appearance of clusters containing a high density of NPY puncta within the arcuate nucleus of the hypothalamus. Immunofluorescence images of NPY fibers and puncta in the medial basal hypothalamus of young adult (2 months) and middle-aged (12 months) mice. A, Low magnification showing projection NPY projection patterns in young and middle age mice. B and C, A notable number of clusters containing a high density of NPY inputs (marked by arrows) was present in the arcuate nucleus of middle aged mice but not in young adults (2 month). 3V, Third ventricle; ME, median eminence; FX, fornix. Scale bar, 25 μm.
Because NPY and AgRP are coexpressed in the same neurons in the ARC (28), we examined AgRP projection and puncta patterns in young and middle-aged mice using an AgRP-specific antibody. Consistent with the above observation, numerous high-density puncta clusters were detected in the hypothalamus of middle-aged but not in the young adults (Fig. 3A). By double-immunofluorescence analysis, AgRP and NPY immunoreactivity was completely colocalized in projections and puncta including all of the aforementioned high-density clusters (Fig. 3B). These clusters were not observed in the cortex, in which the NPY-expressing cells do not express AgRP. Because AgRP neurons are exclusively expressed in the arcuate nucleus, the above results indicate that the high-density puncta clusters are innervations originating from the AgRP neurons within the arcuate nucleus. These high-density structures were most abundant in the arcuate nucleus and also present in dorsomedial and lateral hypothalamus. No such structures were discernible in the parabrachial nucleus or in the paraventricular hypothalamus, possibly due to the high degree of AgRP innervation the paraventricular hypothalamus normally receives. These AgRP puncta in these clusters surround neurons because the receiving cells were positive for HuC/D (Fig. 3C). To gain an understanding of the relationship between age and occurrence of these AgRP-containing clusters, we quantified the number of clusters in various regions of the arcuate nucleus from 2-, 6-, and 9-month-old mice, as described in Materials and Methods. Age progression was accompanied by a continual and significant increase in the number of AgRP-positive clusters (Fig. 3D).
Fig. 3.

NPY and AgRP puncta are colocalized in the same clusters and their number increases with age. A, Representative AgRP immunoreactivity in the arcuate nucleus of a young (2 months) and middle aged (12 months) wild-type male mouse. Note the numerous, visually identifiable, high-density AgRP clusters (indicated by arrows) in the middle-aged mouse. 3V, Third ventricle; ME, median eminence. B, Double-immunofluorescence analysis showing colocalization of AgRP and NPY immunoreactivity in high puncta clusters. A representative field showing clusters containing a high density of AgRP/NPY puncta (marked by arrows) in the arcuate nucleus of a 12-month-old wild-type male mouse. DAPI marks all nuclei in the field. C, High-density puncta clusters represent a dense degree of AgRP innervation onto neuronal cell bodies. Examples of neuronal somas (indicated by a HuC/D positive cytoplasmic region) receiving a high density of AgRP contacts are marked by arrows. Scale bar, 25 μm for A–C. D, Average number of high-density AgRP clusters per section in the arcuate nucleus of 2-, 6-, and 9-month-old mice (n = 3–4 mice per group; n = 2–4 sections per region per mouse). Error bars denote sem. *, P < 0.05, **, P < 0.01 compared with previous age group.
POMC neurons are among the targets of the age-dependent increase in AgRP and NPY innervation
POMC neurons are known to be direct inhibitory targets of AgRP neurons (14, 16). No significant age-related differences were detected in the expression of the POMC derivative, ACTH (young: 0.36 ± 0.04 vs. middle-aged: 0.40 ± 0.11 pg ACTH per milligram total protein, P = 0.77). In the anterior arcuate nucleus in which POMC neurons are most abundant, close to 90% of the clusters containing a high-density of AgRP puncta were found on POMC neurons in 9- to 12 month-old mice (Fig. 4A). Confocal Z-stack reconstruction showed that these visibly identifiable clusters represented dense AgRP puncta juxtaposing the POMC perikarya. Confocal quantification of the density of NPY inputs onto POMC perikarya revealed that the percentage of POMC neurons with a high density (27 or more puncta per 100 μm membrane of POMC perikarya, see Materials and Methods for further details) of NPY inputs increased significantly in 9-month-old compared with 2-month-old mice. This magnitude is similar to the increase in percentage of POMC neurons surrounded by the visually identifiable high-density AgRP/NPY clusters (Fig. 4, B and C). On average, POMC perikarya from 9-month-old mice received twice as many NPY puncta compared with young adult mice (Fig. 4D). The distribution of POMC neurons categorized by density of AgRP inputs was significantly shifted with age, in that, as a population, POMC neurons in 9-month-old mice received a higher density of AgRP inputs compared with 2-month-old animals (Fig. 4, E and F). Thus, the age-related increase in proportion of POMC neurons receiving a high density of inputs is indicative of a progressive increase in AgRP and NPY innervation with age.
Fig. 4.

POMC neurons are among the targets of age-dependent increase in AgRP/NPY innervation. A, Wide-field image from a middle-aged mouse (9 months) depicting POMC neurons in the arcuate nucleus receiving a dense degree of NPY inputs. NPY immunoreactivity is shown in red and ACTH (POMC product) is in green. Scale bar, 25 μm. B, Percentage of POMC neurons that were surrounded by clusters containing a high density of AgRP/NPY puncta in young adult (2 months) and middle-aged (9 months) mice. C, Confocal quantification of the percentage of POMC neurons that received a high density of NPY inputs. D, Average number of NPY puncta per 100 μm POMC soma in young and middle-aged mice. E and F, Distribution plots for the percentage of POMC cells receiving a given density of NPY inputs in 2-month-old and 9-month-old mice. C–E, n = 3–5, n ≥ 16. Error bars denote sem. *, P < 0.05, **, P < 0.01, ***, P ≤ 0.001 compared with 2 months.
POMC firing frequency decreases with age with concomitant increase in inhibitory tone onto POMC neurons
To evaluate whether POMC neuronal activity correlates with the extent of AgRP innervation onto these neurons, we first compared the expression of c-fos, a commonly used marker for neuronal excitation, in POMC neurons that received either a high or low density (1.5 or less inputs per 100 μm POMC soma) of AgRP inputs in 9-month-old mice. Mice were injected with leptin (3 mg/kg) 45 min before perfusion to increase c-fos reactivity of leptin-responsive cells. We showed that POMC neurons receiving a low density of AgRP innervation exhibited significantly higher c-fos immunoreactivity compared with POMC neurons that received a high density (Fig. 5A). These results suggest that high-density AgRP innervation onto POMC neurons inhibits the activity of these neurons.
Fig. 5.

Inhibitory tone on POMC neurons increases, whereas POMC firing frequency decreases with age. A, POMC somas that receive a high density of AgRP inputs have reduced c-fos expression. A collapsed z-stack confocal immunofluorescence image of c-fos expression in POMC cell somas receiving different degrees of AgRP innervation is shown. Quantification of the percentage of cells within the given density group that display c-fos reactivity is also shown. A total of 123 cells from three animals were analyzed. B–E, Perforated patch clamp recordings of POMC neurons. In older mice the action potential frequency gradually decreased (B), the membrane potential hyperpolarized (C), and the percentage of silent POMC neurons (F < 0.5 Hz) increased (D). E, Original POMC neuron recordings in mice of the age groups shown in B–E. F, Whole-cell patch clamp recordings of POMC neurons. In the 20-wk-old mice, the absolute frequency of IPSCs and the ratio of IPSCs to EPSCs are increased. G, Original PSC recordings in mice of the age groups shown in F. The left panels show the recordings under control conditions with IPSCs and EPSCs. In the right panels, the EPSCs are pharmacologically blocked with CNQX and D-AP5. Number of POMC neurons recorded is shown in parentheses. W, Weeks in age. Error bars denote sem. *, P < 0.05; **, P < 0.01; ***, P < 0.001.
AgRP neurons can hyperpolarize and inhibit POMC neurons through the release of the neuropeptides AgRP and NPY as well as through classical fast-acting inhibitory neurotransmitter such as GABA. To this end, we performed perforated patch-clamp recordings on POMC neurons from mice of different ages. This analysis revealed that action potential frequency of POMC neurons was highest at 2 wk of age, gradually decreased at 15 wk of age, and was significantly reduced by 70% at the age of 30 wk (Fig. 5, B and E). Concomitantly, the membrane potential gradually hyperpolarized with age, resulting in a significant decrease of resting membrane potential at 30 wk of age (Fig. 5, C and E). Consistent with the above findings, the proportion of electrically silent POMC neurons gradually increased with age, from 0% at 2 wk of age to 23% at 15 wk and 53% at 30 wk (Fig. 5D). We next performed whole-cell patch clamp recordings to analyze PSCs on POMC neurons. This experiment revealed that the absolute frequency of IPSCs (in the presence of d-AP5 and CNQX) also increased with age (Fig. 5, F and G). Similarly, the ratio of IPSCs to EPSCs significantly increased, indicating that both the GABAergic inputs and overall inhibitory tone onto POMC neurons increases with age.
Mice deficient in leptin or leptin signaling do not exhibit the age-associated increase in AgRP innervation
As described in Fig. 1, leptin levels increase steadily with age. To determine whether leptin contributed to the age-dependent increase in AgRP innervations, we used two mouse models of leptin signaling deficiency: Lepob/ob mice, which lack leptin; and mutant mice lacking signal transducer and activator of transcription 3 (Stat3), a major leptin signaling mediator, in cells expressing leptin receptor long form (LepRb-Cre, Stat3flox/flox mice) (17). In stark contrast to wild-type animals, the number of high-density AgRP puncta clusters was greatly reduced in both middle aged Lepob/ob and LepRb-Cre,Stat3flox/flox mutant mice (Fig. 6, A and B), indicating that chronic leptin action is required for the age-associated increase in clusters containing a high-density of NPY inputs. To dissociate obesity from the lack of leptin signaling, we quantified the density of NPY innervation in 9- to 10-month-old diet-induced obese (DIO) mice. These DIO mice had similar body weights (59.4 ± 1.5 g) to those of the LepRb-Cre,Stat3flox/flox mice (57.8 ± 7.7 g) of the same age. However, the number of high-density AgRP/NPY puncta clusters was similar between these DIO mice and age-matched, chow-fed control mice (not shown). Because DIO and leptin signaling deficiency exerted opposite effects on AgRP innervation, it suggests that deficiency in leptin signaling, rather than obesity alone, is responsible for the lack of age-dependent increase of AgRP innervation onto POMC neurons. The requirement of leptin on age-associated increase in AgRP puncta suggests that differences in leptin levels in early adulthood could influence the development of AgRP innervation later in life. To this end we measured leptin levels in 5-month-old mice and quantified the number of these clusters in the same mice at 12 months of age. Leptin levels at 5 months of age varied among different animals, but they positively correlated with the number of the AgRP-containing clusters at 12 months of age (Fig. 6C). This result suggests that elevation of leptin levels in early adulthood may promote the age-dependent increase of AgRP innervation later in life, thus supporting the notion that this is a progressive phenomenon.
Fig. 6.

Age-associated increase of AgRP/NPY innervations is leptin dependent. A, Representative NPY immunostaining of the arcuate nucleus of control mice, mice lacking leptin (Lepob/ob), and mice lacking functional Stat3 in leptin receptor neurons (LepRb-Cre, Stat3flox/flox). Note the lack of visually identifiable NPY-containing clusters in the arcuate nucleus of Lepob/ob and LepRb-Cre, Stat3flox/flox mice. Scale bar, 25 μm. 3V, Third ventricle; ME, median eminence. B, Quantification of AgRP/NPY-positive clusters in the arcuate nucleus (n = 3–4; n = 2–4 sections per region per mouse). All mice were 9–12 months of age. C, Leptin levels measured in 5-month-old mice correlated with the number of clusters that contained a high density of AgRP/NPY puncta from the same mice at 12 months of age (n = 6; n = 2–4). Error bars denote sem. **, P ≤ 0.01, compared with controls.
Consumption of a high-fat diet accelerates an increase in AgRP innervation onto POMC neurons in early adulthood
We next evaluated whether consumption of a high-fat diet would accelerate the progression of AgRP innervation in younger animals. Using mice that had been fed a high-fat diet since 6 wk of age, we examined the density of AgRP puncta onto POMC cells at 3.5 months of age. The POMC neurons from diet-induced obese animals received more AgRP inputs compared with age-matched, chow-fed mice, especially at higher densities (Fig. 7), indicating that diet-induced obesity accelerates the increase of AgRP innervations in young adulthood.
Fig. 7.

Young diet-induced obese mice have a premature increase in the density of AgRP innervation onto POMC cells. A, Terminal plasma leptin levels of the chow-fed and high-fat diet-fed mice. HFD, High-fat diet. B, Percentage of POMC neurons that received a high density of AgRP inputs. C, Distribution plot for the percentage of POMC cells receiving a given density of AgRP puncta in 3.5-month-old mice either fed regular chow or high-fat diet for 10 weeks (n = 4, n > 25 cells per animal). Error bars denote sem. *, P < 0.05; ***, P < 0.001.
Discussion
An age-associated increase in body adiposity in the face of elevated leptin levels is widely observed in mammals, but its underlying mechanisms are poorly understood. In this study, we describe an age-dependent remodeling of the hypothalamic feeding circuit, accounting for one potential mechanism to explain the age-dependent regulation of adiposity. On the one hand, increasing leptin levels should act to enhance the anorexigenic actions of POMC neurons; on the other hand, chronic elevation of leptin could promote an increase in AgRP innervation onto the POMC neurons, thereby inhibiting their activity. The inhibition of POMC neuronal activity would act to counter leptin's weight-reducing effects and to allow the maintenance of elevated body adiposity associated with normal age progression. Although our findings are not mutually exclusive to cell-autonomous, age-related changes, they introduce a model in which progressive changes of inputs onto target cells play a role in age-associated decrease of POMC function. Our current study focuses POMC neurons as a key AgRP target, but other AgRP target neurons could undergo similar age-dependent regulation and further contribute to the increased body weight.
Although the percentage of POMC neurons surrounded by high-density AgRP clusters is low (10–15%), they represent cells with the heaviest innervations, and hence, they are visually identifiable in wide-field fluorescence images. However, the age-related increase in AgRP innervation is not restricted to only this percentage of neurons. POMC neurons in 9-month-old mice receive, on average, a 2-fold increase in the number of AgRP/NPY puncta compared with 2-month-old mice. The density distribution plot shows that there is a significant shift of the entire POMC population toward higher densities in 9-month-old mice when compared with 2-month-old mice. Thus, a much higher proportion of the POMC neurons, not just 10–15%, receive increased AgRP/NPY innervations with age at various degrees. In addition, although this study focused on AgRP innervation onto POMC neuronal somas, inputs from AgRP neurons onto other parts of POMC neurons, such as dendrites, could also influence membrane potential and neuronal activity. It is highly likely that AgRP, NPY, and GABA act in concert to exert inhibitory effects on POMC neurons. NPY and GABA have been shown to colocalize in the same boutons (14), but GABA released onto POMC somas could also come from non-AgRP/NPY neurons. The inhibitory role of AgRP/NPY peptides on POMC activity is also supported by the previous finding that NPY inhibits POMC firing (16) and our observation that AgRP input density inversely correlates with c-fos expression in POMC neurons.
One finding of this study is the requirement of leptin for the age-associated changes in hypothalamic feeding circuits. The lack of the age-related increase in AgRP innervation in Lepob/ob and LepRb-Cre, Stat3flox/flox mice does not appear to be caused by reduced fiber density in the arcuate nucleus, in which most of the clusters containing AgRP puncta are observed. Obesity in leptin signaling-deficiency models also does not account for the lack of age-related increase in AgRP innervation because wild-type mice with diet-induced obesity exhibit the opposite phenotype. There are, however, several potential mechanisms by which leptin underlies this age-associated phenotype. One such mechanism could be that leptin exerts effects on AgRP neurons such that increasing leptin levels directly promote synaptogenesis from AgRP neurons. In support of this hypothesis, leptin administration in postnatal animals stimulates expression of synaptic proteins syntaxin-1 and synaptosomal-associated protein-25 (29). Leptin has also been shown to exert trophic effects on neuronal projection outgrowth during the early postnatal period (30). Interestingly, leptin has more pronounced effects on projection outgrowth from the AgRP neurons than that from the POMC neurons (30). Alternatively, the increase in AgRP inputs on POMC somas could result from homeostatic plasticity. By this logic, leptin-induced increases in POMC neuronal activity would promote the recruitment of inhibitory inputs, such as those from AgRP neurons. Therefore, leptin could exert its action on presynaptic AgRP/NPY neurons, postsynaptic POMC neurons, or both. More comprehensive studies will be required to understand the detailed mechanisms that underlie leptin's effects on remodeling AgRP innervation.
Chronic elevation of leptin levels has been shown to produce an effect that is distinct from that caused by acute leptin administration. Although acute leptin administration causes anorexia and weight loss (4), transgenic mice that overexpress leptin in skin, liver, or adipose tissues are predisposed to leptin resistance and diet-induced obesity (6–9). It has been shown that acute leptin administration to Lepob/ob mice rapidly increases stimulatory synaptic input onto POMC neurons and simultaneously reduces inhibitory synaptic input onto these neurons (31). Our study suggests that leptin may promote AGRP innervation with increasing age. Opposing effects of acute and chronic hormonal treatment have also been observed in animals that receive insulin administration (32–34). The underlying mechanism for these opposing effects is not clear, but it could be due to differences in the duration and magnitude of hormonal treatments. Although the phenomenon of an increased density of AgRP inputs is observed in middle-age mice as well as younger obese mice, its development is likely a gradual process that begins weeks to months before the specific time points we have observed.
Our finding that chronic high-fat feeding accelerates this phenomenon in young adult animals suggests that the same mechanism may contribute to the development of leptin resistance in diet-induced obesity. Similar to age progression, POMC neuronal firing rates are reduced in diet-induced obesity (35). Leptin resistance often manifests as reduction of signaling response to exogenous leptin. Although it is true that diet-induced obese animals show reduced phosphorylated STAT3 activation in response to leptin administration, levels of phosphorylated STAT3 signaling in the basal fed state are not reduced but rather elevated in the hypothalamus of obese mice when compared with chow-fed lean controls (5, 36). Although changes in various signal transduction pathways could play a role in maintaining an elevated body adiposity (4), our study shows that organizational changes of the hypothalamic feeding circuit could be involved.
Leptin's contribution to its own resistance could represent a type of antagonistic pleiotropy. This notion proposes that genes that are beneficial for the fitness of an organism and propagation of the species can eventually exert effects that are antagonistic to the gene's function and the organism's health once the organism is out of reproductive age (37). Among its many roles, leptin is important for proper maintenance of energy balance, glycemia, and sexual reproduction, all of which ultimately contribute to quality of health and life span of an animal. Mice and humans lacking leptin or its receptor often have reduced fertility and exhibit premature mortality (38). Thus, leptin is beneficial for the survival of the species but, as we report here, may eventually contribute to its own resistance.
Alternatively, a progressive elevation of leptin levels may promote mechanisms that counter the anorexigenic effects of increased leptin levels so that body adiposity can be maintained at an elevated level. Upon food deprivation, leptin levels fall significantly, which induces a potent hyperphagic response when food becomes available to ensure rapid replenishment of energy reserve. Thus, from an evolutionary perspective, leptin was likely evolved to defend body adiposity in an environment when food availability was often limited. In this regard, leptin's contribution to its own resistance during normal age progression is consistent with leptin's overall physiological role in preserving body adiposity. This notion is consistent with the recent finding that hyperleptinemia, but not obesity alone, is required for the development of leptin resistance in diet-induced obesity (5). In addition, overexpression of leptin receptors in hypothalamic POMC neurons increases susceptibility to diet-induced obesity (39). It is further supported by the evidence that transgenic animals overexpressing leptin are predisposed to development of leptin resistance and diet-induced obesity (6–9). Development of age-dependent leptin resistance may thus represent a normal physiological process that allows growth to continue and body adiposity to be maintained at elevated levels in times of food surplus.
Acknowledgments
We thank Dr. James Warne for proofreading of the manuscript and providing useful discussion.
This work was supported in part by funds from the National Institutes of Health (NIH), National Institutes of Diabetes and Digestive and Kidney Diseases (Grant R01DK080427) and Weston Havens Foundation (to A.W.X.); a fellowship from the National Institute of General Medical Sciences (Grant 5K12GM081266-02, to J.N.); and in part by NIH-National Institutes of Diabetes and Digestive and Kidney Diseases (Grants R01 DK58148 and 5R01DK085916-02, to E.N.). This work was also supported in part by core facilities funded by NIH Diabetes and Endocrinology Research Center Grant P30 DK063720.
Disclosure Summary: The authors have no conflicts of interest to disclose.
Footnotes
- aCSF
- Artificial cerebrospinal fluid
- ARC
- arcuate nucleus
- AgRP
- agouti-related peptide
- CNQX
- 6-cyano-7-nitroquinoxaline-2,3-dione
- d-AP5
- DL-2-amino-5-phosphonopentanoic acid
- DAPI
- 4′,6′-diamino-2-phenylindole
- DIO
- diet-induced obese
- EPSC
- excitatory PSC
- GABA
- γ-aminobutyric acid
- GABAergic
- GABA-releasing
- IPSC
- inhibitory PSC
- LepRb
- leptin receptor long form
- NPY
- neuropeptide Y
- POMC
- proopiomelanocortin
- PSC
- postsynaptic current
- Stat3
- signal transducer and activator of transcription 3.
References
- 1. Ogden CL, Carroll MD, Curtin LR, McDowell MA, Tabak CJ, Flegal KM. 2006. Prevalence of overweight and obesity in the United States, 1999–2004. JAMA 295:1549–1555 [DOI] [PubMed] [Google Scholar]
- 2. Kuk JL, Saunders TJ, Davidson LE, Ross R. 2009. Age-related changes in total and regional fat distribution. Ageing Res Rev 8:339–348 [DOI] [PubMed] [Google Scholar]
- 3. Mizuno T, Shu IW, Makimura H, Mobbs C. 2004. Obesity over the life course. Sci Aging Knowledge Environ 2004:re4. [DOI] [PubMed] [Google Scholar]
- 4. Myers MG, Cowley MA, Münzberg H. 2008. Mechanisms of leptin action and leptin resistance. Annu Rev Physiol 70:537–556 [DOI] [PubMed] [Google Scholar]
- 5. Knight ZA, Hannan KS, Greenberg ML, Friedman JM. 2010. Hyperleptinemia is required for the development of leptin resistance. PLoS ONE 5:e11376. [DOI] [PMC free article] [PubMed] [Google Scholar]
- 6. Rico L, Del Rio M, Bravo A, Ramirez A, Jorcano JL, Page MA, Larcher F. 2005. Targeted overexpression of leptin to keratinocytes in transgenic mice results in lack of skin phenotype but induction of early leptin resistance. Endocrinology 146:4167–4176 [DOI] [PubMed] [Google Scholar]
- 7. Tanaka T, Hidaka S, Masuzaki H, Yasue S, Minokoshi Y, Ebihara K, Chusho H, Ogawa Y, Toyoda T, Sato K, Miyanaga F, Fujimoto M, Tomita T, Kusakabe T, Kobayashi N, Tanioka H, Hayashi T, Hosoda K, Yoshimatsu H, Sakata T, Nakao K. 2005. Skeletal muscle AMP-activated protein kinase phosphorylation parallels metabolic phenotype in leptin transgenic mice under dietary modification. Diabetes 54:2365–2374 [DOI] [PubMed] [Google Scholar]
- 8. Ogus S, Ke Y, Qiu J, Wang B, Chehab FF. 2003. Hyperleptinemia precipitates diet-induced obesity in transgenic mice overexpressing leptin. Endocrinology 144:2865–2869 [DOI] [PubMed] [Google Scholar]
- 9. Qiu J, Ogus S, Lu R, Chehab FF. 2001. Transgenic mice overexpressing leptin accumulate adipose mass at an older, but not younger, age. Endocrinology 142:348–358 [DOI] [PubMed] [Google Scholar]
- 10. Wolden-Hanson T, Marck BT, Smith L, Matsumoto AM. 1999. Cross-sectional and longitudinal analysis of age-associated changes in body composition of male Brown Norway rats: association of serum leptin levels with peripheral adiposity. J Gerontol A Biol Sci Med Sci 54:B99–B107 [DOI] [PubMed] [Google Scholar]
- 11. Ahrén B, Månsson S, Gingerich RL, Havel PJ. 1997. Regulation of plasma leptin in mice: influence of age, high-fat diet, and fasting. Am J Physiol 273:R113–R120 [DOI] [PubMed] [Google Scholar]
- 12. Qian H, Azain MJ, Hartzell DL, Baile CA. 1998. Increased leptin resistance as rats grow to maturity. Proc Soc Exp Biol Med 219:160–165 [DOI] [PubMed] [Google Scholar]
- 13. Schwartz MW, Woods SC, Porte D, Jr, Seeley RJ, Baskin DG. 2000. Central nervous system control of food intake. Nature 404:661–671 [DOI] [PubMed] [Google Scholar]
- 14. Cowley MA, Smart JL, Rubinstein M, Cerdán MG, Diano S, Horvath TL, Cone RD, Low MJ. 2001. Leptin activates anorexigenic POMC neurons through a neural network in the arcuate nucleus. Nature 411:480–484 [DOI] [PubMed] [Google Scholar]
- 15. Tong Q, Ye CP, Jones JE, Elmquist JK, Lowell BB. 2008. Synaptic release of GABA by AgRP neurons is required for normal regulation of energy balance. Nat Neurosci 11:998–1000 [DOI] [PMC free article] [PubMed] [Google Scholar]
- 16. Roseberry AG, Liu H, Jackson AC, Cai X, Friedman JM. 2004. Neuropeptide Y-mediated inhibition of proopiomelanocortin neurons in the arcuate nucleus shows enhanced desensitization in ob/ob mice. Neuron 41:711–722 [DOI] [PubMed] [Google Scholar]
- 17. Piper ML, Unger EK, Myers MG, Jr, Xu AW. 2008. Specific physiological roles for signal transducer and activator of transcription 3 in leptin receptor-expressing neurons. Mol Endocrinol 22:751–759 [DOI] [PMC free article] [PubMed] [Google Scholar]
- 18. Unger EK, Piper ML, Olofsson LE, Xu AW. 2010. Functional role of c-Jun-N-terminal kinase in feeding regulation. Endocrinology 151:671–682 [DOI] [PMC free article] [PubMed] [Google Scholar]
- 19. Reed AS, Unger EK, Olofsson LE, Piper ML, Myers MG, Jr, Xu AW. 2010. Functional role of suppressor of cytokine signaling 3 upregulation in hypothalamic leptin resistance and long-term energy homeostasis. Diabetes 59:894–906 [DOI] [PMC free article] [PubMed] [Google Scholar]
- 20. Olofsson LE, Pierce AA, Xu AW. 2009. Functional requirement of AgRP and NPY neurons in ovarian cycle-dependent regulation of food intake. Proc Natl Acad Sci USA 106:15932–15937 [DOI] [PMC free article] [PubMed] [Google Scholar]
- 21. Perello M, Stuart RC, Nillni EA. 2007. Differential effects of fasting and leptin on proopiomelanocortin peptides in the arcuate nucleus and in the nucleus of the solitary tract. Am J Physiol Endocrinol Metab 292:E1348–E1357 [DOI] [PubMed] [Google Scholar]
- 22. Ye JH, Zhang J, Xiao C, Kong JQ. 2006. Patch-clamp studies in the CNS illustrate a simple new method for obtaining viable neurons in rat brain slices: glycerol replacement of NaCl protects CNS neurons. J Neurosci Methods 158:251–259 [DOI] [PubMed] [Google Scholar]
- 23. Dodt HU, Zieglgänsberger W. 1990. Visualizing unstained neurons in living brain slices by infrared DIC-videomicroscopy. Brain Res 537:333–336 [DOI] [PubMed] [Google Scholar]
- 24. Horn R, Marty A. 1988. Muscarinic activation of ionic currents measured by a new whole-cell recording method. J Gen Physiol 92:145–159 [DOI] [PMC free article] [PubMed] [Google Scholar]
- 25. Akaike N, Harata N. 1994. Nystatin perforated patch recording and its applications to analyses of intracellular mechanisms. Jpn J Physiol 44:433–473 [DOI] [PubMed] [Google Scholar]
- 26. Lindau M, Fernandez JM. 1986. A patch-clamp study of histamine-secreting cells. J Gen Physiol 88:349–368 [DOI] [PMC free article] [PubMed] [Google Scholar]
- 27. Rae J, Cooper K, Gates P, Watsky M. 1991. Low access resistance perforated patch recordings using amphotericin B. J Neurosci Methods 37:15–26 [DOI] [PubMed] [Google Scholar]
- 28. Broberger C, Johansen J, Johansson C, Schalling M, Hökfelt T. 1998. The neuropeptide Y/agouti gene-related protein (AGRP) brain circuitry in normal, anorectic, and monosodium glutamate-treated mice. Proc Natl Acad Sci USA 95:15043–15048 [DOI] [PMC free article] [PubMed] [Google Scholar]
- 29. Ahima RS, Bjorbaek C, Osei S, Flier JS. 1999. Regulation of neuronal and glial proteins by leptin: implications for brain development. Endocrinology 140:2755–2762 [DOI] [PubMed] [Google Scholar]
- 30. Bouret SG, Draper SJ, Simerly RB. 2004. Trophic action of leptin on hypothalamic neurons that regulate feeding. Science 304:108–110 [DOI] [PubMed] [Google Scholar]
- 31. Pinto S, Roseberry AG, Liu H, Diano S, Shanabrough M, Cai X, Friedman JM, Horvath TL. 2004. Rapid rewiring of arcuate nucleus feeding circuits by leptin. Science 304:110–115 [DOI] [PubMed] [Google Scholar]
- 32. Benoit SC, Air EL, Coolen LM, Strauss R, Jackman A, Clegg DJ, Seeley RJ, Woods SC. 2002. The catabolic action of insulin in the brain is mediated by melanocortins. J Neurosci 22:9048–9052 [DOI] [PMC free article] [PubMed] [Google Scholar]
- 33. De Souza CT, Araujo EP, Bordin S, Ashimine R, Zollner RL, Boschero AC, Saad MJ, Velloso LA. 2005. Consumption of a fat-rich diet activates a proinflammatory response and induces insulin resistance in the hypothalamus. Endocrinology 146:4192–4199 [DOI] [PubMed] [Google Scholar]
- 34. Koch L, Wunderlich FT, Seibler J, Könner AC, Hampel B, Irlenbusch S, Brabant G, Kahn CR, Schwenk F, Brüning JC. 2008. Central insulin action regulates peripheral glucose and fat metabolism in mice. J Clin Invest 118:2132–2147 [DOI] [PMC free article] [PubMed] [Google Scholar]
- 35. Diano S, Liu ZW, Jeong JK, Dietrich MO, Ruan HB, Kim E, Suyama S, Kelly K, Gyengesi E, Arbiser JL, Belsham DD, Sarruf DA, Schwartz MW, Bennett AM, Shanabrough M, Mobbs CV, Yang X, Gao XB, Horvath TL. 2011. Peroxisome proliferation-associated control of reactive oxygen species sets melanocortin tone and feeding in diet-induced obesity. Nat Med 17:1121–1127 [DOI] [PMC free article] [PubMed] [Google Scholar]
- 36. Martin TL, Alquier T, Asakura K, Furukawa N, Preitner F, Kahn BB. 2006. Diet-induced obesity alters AMP kinase activity in hypothalamus and skeletal muscle. J Biol Chem 281:18933–18941 [DOI] [PubMed] [Google Scholar]
- 37. Bartke A. 2011. Pleiotropic effects of growth hormone signaling in aging. Trends Endocrinol Metab 22:437–442 [DOI] [PMC free article] [PubMed] [Google Scholar]
- 38. Houseknecht KL, Baile CA, Matteri RL, Spurlock ME. 1998. The biology of leptin: a review. J Anim Sci 76:1405–1420 [DOI] [PubMed] [Google Scholar]
- 39. Gamber KM, Huo L, Ha S, Hairston JE, Greeley S, Bjorbæk C. 2012. Over-expression of leptin receptors in hypothalamic POMC neurons increases susceptibility to diet-induced obesity. PLoS ONE 7:e30485. [DOI] [PMC free article] [PubMed] [Google Scholar]