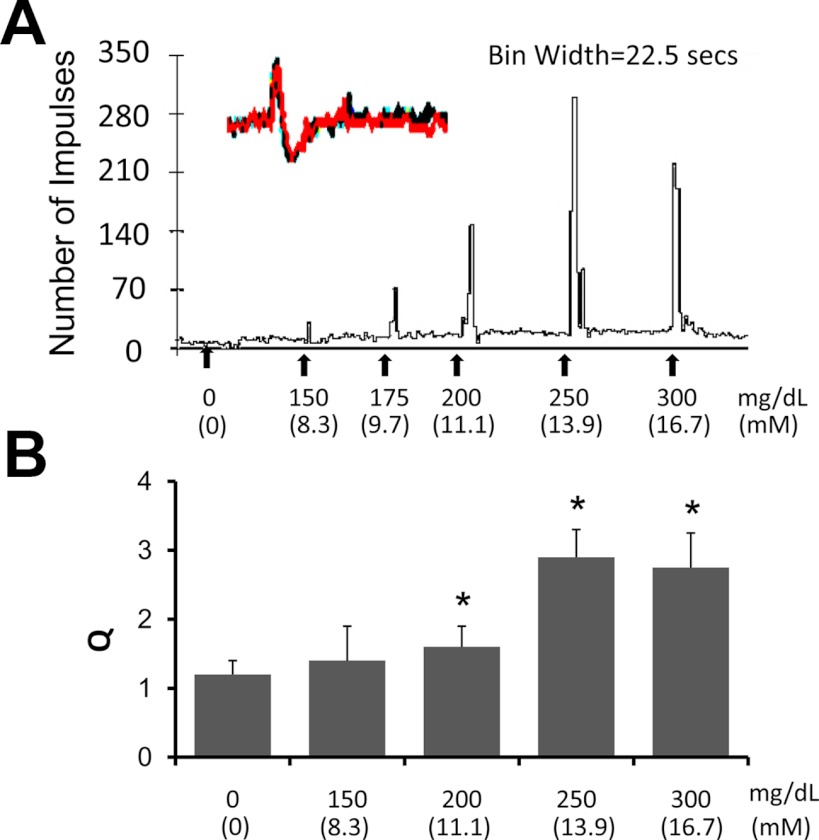
Fig. 6.
Responses of the gastric vagal afferents to changes in glucose concentration in an isolated stomach-vagus nerve preparation. A, Example of a glucose dose-response study obtained from gastric vagal afferent terminal recordings. The inset at the upper left shows the superimposed waveforms of the individual unit action potentials traced at the beginning and at the end of the recording. This ensured that the same unit was studied. B, Histogram shows a dose-response relationship with maximal response at a glucose level of 250 mg/dl. *, P < 0.05 compared with control.

