Abstract
The use of traditional capillary electrophoresis (CE) to detect weak binding complexes is problematic due to the fast-off rate resulting in the dissociation of the complex during the separation process. Additionally, proteins involved in binding interactions often nonspecifically stick to the bare-silica capillary walls, which further complicates the binding analysis. Microchip CE allows flexibly positioning the detector along the separation channel and conveniently adjusting the separation length. A short separation length plus a high electric field enables rapid separations thus reducing both the dissociation of the complex and the amount of protein loss due to nonspecific adsorption during the separation process. Thrombin and a selective thrombin-binding aptamer were used to demonstrate the capability of microchip CE for the study of relatively weak binding systems that have inherent limitations when using the migration shift method or other CE methods. The rapid separation of the thrombin-aptamer complex from the free aptamer was achieved in less than 10 s on a single-cross glass microchip with a relatively short detection length (1.0 cm) and a high electric field (670 V/cm). The dissociation constant was determined to be 43 nM, consistent with reported results. In addition, aptamer probes were used for the quantitation of standard thrombin samples by constructing a calibration curve, which showed good linearity over two orders of magnitude with a limit of detection for thrombin of 5 nM at a 3-fold signal-to-noise ratio.
Keywords: Microchip, Affinity capillary electrophoresis, Aptamer, Binding study
1 Introduction
The lab-on-a-chip concept miniaturizes analytical instrumentation, resulting in rapid analysis and reduced consumption of expensive biological materials [1-3]. Microchip capillary electrophoresis (CE) has attracted significant attention for the development of high-throughput microseparation instrumentation [3, 4]. The potential use of plastic as a microchip substrate material [5, 6] instead of glass may significantly reduce microfabrication expenses and encourage expansion of microchip CE applications in the fields of pharmaceuticals [7], clinical diagnostics [8] and routine separations. One attractive application area for microchip CE is affinity capillary electrophoresis (ACE), which is widely employed in traditional CE to determine the dissociation constants of complexes, as well as providing a means for quantitative analysis of proteins and other biomolecules by using antibodies and aptamer probes [9-12].
Based on the stability of the complex, reported ACE methods in capillary zone electrophoresis may be classified into two distinct modes [13, 14]. Pre-equilibrium mixture analysis [12, 15-18]: The complex is formed by pre-incubating the analyte and the binding probe, and then the resulting equilibrium mixture is analyzed under non-equilibrium separation conditions based on electrophoresis. Mobility-shift analysis [19-22]: In this approach, the separation buffer contains the binding ligand while the sample contains the analyte; following injection, the analyte-ligand complex continuously undergoes dynamic dissociation/association cycles during CE separation; the migration time of the analyte is shifting with the concentrations of the ligand in the separation buffer. Pre-equilibrium-mixture analysis is preferred for relatively strong binding systems in which the complex has a slow-off rate and can be detected before it dissociates to a significant extent. In this approach, the peak size of the free probe in the mixture decreases with the increase in the original analyte concentration in the mixture. For very strong binding (e.g. Kd < 10 nM, off-rate of the complex is very slow), the complex loss due to dissociation is negligible when a short separation time is used, and the complex peak area represents the total amount of the complex in the originally incubated mixture. On the other hand, mobility-shift analysis is favorable for relatively weak binding systems in which the complex has a fast on-and-off rate. To use this approach for accurate dissociation studies, the complex on-and-off rate is required to be relatively rapid so that distinct concentrations of ligands in the separation buffer could lead to diverse migration shifts of the analyte peak [23], thus ensuring the statistical description of analyte zone migration.
The binding system of thrombin and thrombin-binding aptamer is a well-known weak binding pair with Kd values reported between 20 ∼ 450 nM [12, 15, 24, 25]. Equilibrium mixture analysis was reported by German et al. [12] with the complex peak being detected in a migration time of approximately 50 s by using vacuum-assisted traditional CE at a separation length of 7 cm. Similarly, Huang et al. [15] also detected the complex peak in about 25 s by using PEG-assisted ACE at a separation length of 5 cm. In these two approaches, the thrombin-aptamer complex was detected before it completely dissociated by reducing its migration time or by stabilizing the complex with polymers. Traditional CE, however, has practical limitations on further reduction of the detection length to shorten the complex migration time.
The integration of injection and separation channels in a chip format using microfabrication techniques can significantly reduce the length of the separation channel relative to traditional CE and allows light-based detectors, such as laser induced fluorescence (LIF), to be pointed anywhere along the separation channel so that the detection length can be as short as microns [26, 27]. Therefore, relatively weak binding systems (Kd ∼ μM) can be studied by using pre-equilibrium mixture analysis in microchip CE through a combination of a short separation length and a high electric field.
In this paper, we used a microchip-ACE method to study protein-DNA binding on a borofloat glass microchip using thrombin and a fluorescently-labeled thrombin-binding aptamer. The complex peak was detected without any special treatment to the separation process or the separation buffer. The Kd and the off-and-on rate kinetics of the complex were determined through a single electropherogram for given concentrations of the binding pairs. Additionally, the use of ACE for the trace analysis of thrombin using the fluorescently-labeled aptamer probe was demonstrated.
2 Materials and methods
2.1 Instrumentation
All experiments were performed on a Microfluidic Tool Kit (μTK) purchased from Micralyne (Edmonton, AB, Canada). The system consists of a high voltage power supply and a LIF detection system with excitation at 532 nm from a frequency-doubled Nd:YAG diode-pumped solid-state laser (4 mW). The laser beam was focused onto the separation channel through a 20× microscope objective, and the emission was collected with the same objective and was filtered by a 550 nm long-pass filter and a 568.2 nm bandpass filter before it reached the photomultiplier tube detector. Single-cross glass microchips were purchased from Micralyne. Four plastic reservoirs cut from 200 μL polypropylene pipette tips (5.0 mm I.D.) were attached at the access holes with two-part epoxy. For equilibrium dissociation constant determination, two cuboid reservoirs (width 4.0 mm, length 16.0 mm) were attached at the two sides of the short channel. The voltage configurations, controlled by the LabVIEW software (National Instruments, Austin, TX, USA), were applied to the four reservoirs on the glass microchip through platinum electrodes. Data were recorded by the Turbochrome 6.2.1 software from Perkin-Elmer Corp. (Cupertino, CA, USA).
2.2 Chemicals and reagents
Tris, glycine, and potassium chloride were obtained from Fisher Scientific Company (Fair Lawn, NJ, USA). α-Thrombin was obtained from Haematologic Technologies (Essex Junction, VT, USA). The thrombin-binding aptamer (5′-GGT TGG TGT GGT TGG-3′) [28] labeled at the 5′ end with 6-carboxy-2′,4,4′,5′,7,7′-hexachlorofluorescein, succinimidyl ester (HEX) was synthesized and HPLC-purified by Integrated DNA Technologies (Coralville, IA, USA).
Stock solutions of Tris, glycine, and potassium chloride were prepared with deionized water from a Milli-Q system (Millipore Corp., Bedfopprd, MA, USA) at concentrations of 250, 1920, and 100 mM, respectively. The final Tris/glycine buffers (pH 8.4) containing 25 mM Tris and 192 mM glycine and appropriate salt additives were prepared by combining appropriate aliquots of the stocks and by diluting with deionized water. Thrombin and aptamer stock solutions were prepared in deionized water at the concentrations of 6.4 μM and 200 μM, respectively.
2.3 Voltage configuration
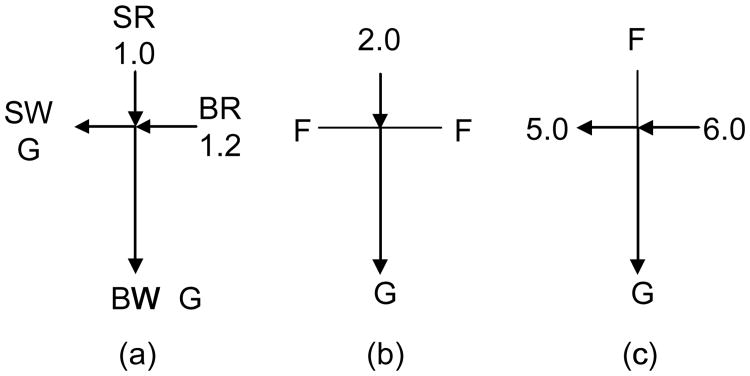
A modified gated injection scheme was used for most experiments unless otherwise stated. The voltage configuration is shown in Fig. 1 where the potentials are in kilovolts (kV). The loading voltage configuration (Fig. 1a, 30 s) confined the sample solution flow from the sample reservoir (SR) to the sample waste reservoir (SW) until the sample solution flow reached a steady state and was ready for injection. The injection was carried out by applying a voltage between the SR and the buffer waste reservoir (BW) while floating the buffer reservoir (BR) and SW (Fig. 1b, 1 or 2 s). During the separation process, the SR was floated to protect the sample solution from the impact of the high voltage, while sample leaking from the channel connecting the SR was flushed to the SW (Fig. 1c). Before each injection, sample loading (Fig. 1a) for 10 s was carried out. For Kd determination, a hydrodynamic injection method [29] was used so that all the electrodes in Fig. 1b were floated for 20 s for sample injection.
Figure 1.
Voltage configuration. (a) Sample loading, 10 s. (b) Injection, 1 or 2 s. (c) Dispensing/separation, 30 s. The unit of voltage is kV. For hydrodynamic injection, all voltages in (b) were floated for 20 s. BR, buffer reservoir; SR, sample reservoir; BW, buffer waste reservoir; SW, sample waste reservoir; F, floating; and G, ground.
2.4 Procedure
All samples were prepared in an incubation buffer composed of 25 mM Tris, 192 mM glycine and 5 mM KCl with pH 8.4 unless otherwise stated. Aptamer was first added into the incubation buffer and kept for at least 10 min to form the G-quadruplex structure at the presence of potassium ions in the buffer. Then, a specific volume of thrombin was added to the aptamer solution after adjusting a final total sample volume of 100 μL. After being vortexed for several seconds, samples were incubated for >60 min at room temperature in dark to avoid degradation of the HEX labels.
All liquids loaded into the microchip reservoirs were filtered through 0.22 μm filters. The separation buffer was degassed by applying a vacuum in a syringe. The glass microchip was conditioned by sequentially loading 1.0 M NaOH, deionized water and separation buffer in the SR, SW and BR while applying a vacuum on the BW for 5 min for each solution. Aliquots (40 μL) of separation buffer were pipetted into the BR and BW while SW was filled with 38 μL of separation buffer and SR was loaded with 40 μL of a sample solution. After focusing the laser beam onto the separation channel, the voltage configuration (Fig. 1) and the Turbochrome software were simultaneously activated.
For Kd determination, loading volumes were 60 μL in the BW, 80 μL in the BR and SW, and 100 μL sample solution in the SR. The liquid level difference in the SR to the BR or the SW was ca 3.5 mm. Peak areas were obtained using PeakFit software (V4.12) from Systat Software (Point Richmond, CA, USA).
3 Results and discussion
3.1 Injection scheme
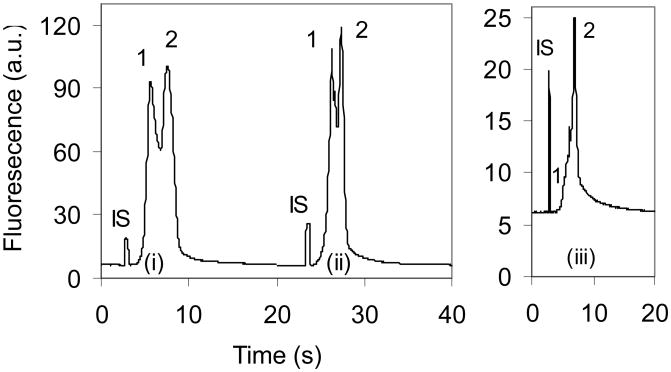
There are several injection schemes available for sample loading/injection on microchip CE, including pinched or floating loading/injection [30], dynamic injection [31] and gated injection [32]. All methods have assets and liabilities. The pinched injection provides high performance with respect to accuracy and precision, but injects a limited volume of sample solution depending on the dimension of the intersection region. The floating, dynamic or gated injection is able to introduce various volumes of sample solution [30, 33]. For weak binding systems, a larger sample plug is relatively important to provide more complex thus enhancing the detectability of the complex using pre-equilibrium mixture analysis although it may decrease the separation efficiency. As shown in Fig. 2, the thrombin-aptamer complex peak was just detected as fronting on the free aptamer peak when pinched loading/injection was used, while floating or gated injection produced a distinct complex peak. There are two possible factors affecting the complex detectability with pinched injection. First, the injection volume is so small that most complexes dissociate before arriving at the detection window; second, the pinched electric field [34] accelerates the complex dissociation during the sample loading process. Therefore, floating or gated injection is preferred for studies of the thrombin-aptamer complex formation, and a modified gated injection was chosen as shown in Fig. 1.
Figure 2.
Comparison of injection methods. The separation buffer consisted of 25 mM Tris, 192 mM glycine and 5.0 mM KCl (pH 8.4). Sample solution contained 500 nM aptamer and 300 nM thrombin prepared in the separation buffer and incubated for >1 h at room temperature in the dark. Groups (i), (ii) and (iii) were obtained with floating, gated, and pinched injections, respectively. Peaks 1 and 2 are the free and the bound aptamers, respectively. Internal standard (IS) was 400 nM rhodamine B.
3.2 Cation effect
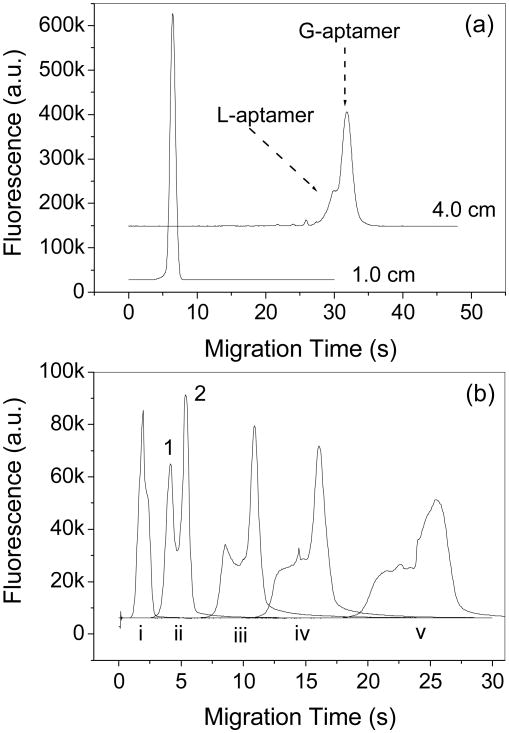
Thrombin aptamer is the most well-studied aptamer at present [12, 15, 24, 35, 36]. The formation of a G-quadruplex (G-aptamer) structure versus a linear (L-aptamer) structure depends, to a great extent, on the existence of specific cations, such as K+, Sr2+, Rb+ and NH4+, in the incubation solution [28, 37]. The predominance of the G-aptamer in solution is attributed to the stabilizing effect of the metal ions that have the right size (1.3∼1.5 Å) to fit into the quadruplex center and coordinate with the two G-quartets [28, 38]. This tertiary G-quadruplex structure is essential for the aptamer to bind thrombin molecules [39, 40]. Among all the cations, K+ is most commonly used due to its optimal effect on the G-quadruplex and its propensity to have little interaction with the inner surfaces of the capillary or microchip channels. It has been shown that the G-quadruplex stability depends on K+ concentrations in solution [15, 28]. However, if the K+ concentration is too high there can be a shielding effect of charges which can decrease the binding [41]. Therefore, the K+ concentration should be optimized so that the thrombin-aptamer binding can be at its strongest. In our experiments, the L-aptamer was separated from the G-aptamer and appeared as a fronting of the G-aptamer peaks when a relatively long detection distance was used as shown in Fig. 3a, which is consistent with the reported results [15].
Figure 3.
(a) Separation of L- and G-aptamers based on the separation length. The run buffer was Tris/glycine (25/192 mM, pH 8.4) with 10 mM KCl; (b) Complex peak versus the detection length. Electropherograms i-v were obtained at 0.5, 1.0, 2.0, 3.0 and 5.0 cm, respectively, from the intersection. Other conditions are the same as in Fig. 2. Peaks 1 and 2 are the free and bound aptamers, respectively.
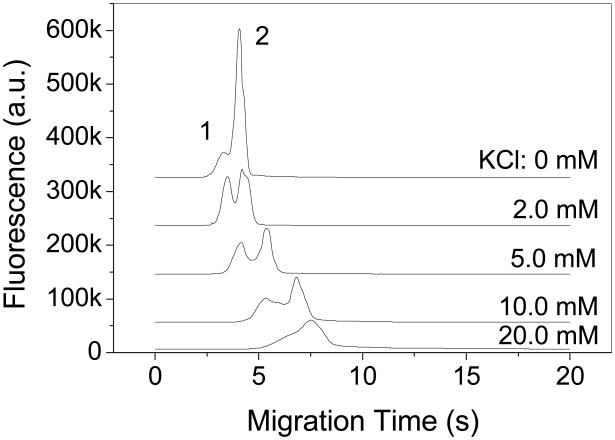
The effect of K+ concentration was also studied by separating the complex peak from the free aptamer. As can be seen in Fig. 4, the thrombin-aptamer complex formation also occurs in the absence of K+; however, the complex amount is small relative to the free aptamer, which is consistent with previous studies [42]. The complex peak was detected at the K+ concentration between 2 and 20 mM, but the detectability of the complex was decreasing with increasing K+ concentrations and the complex peak appeared only as fronting when 20 mM KCl was used (Fig. 4). One possible reason is that the electroosmotic flow decreases with the increase of the ionic strength, resulting in a longer migration time for the complex to dissociate before being detected. The other possible cause is the weakening effect of the ionic strength on the complex stability [41]. Therefore, a KCl concentration between 2 and 5 mM is reasonable, and 5 mM was selected for all the other experiments.
Figure 4.
KCl effect on thrombin-aptamer complex formation and microchip CE separation. Separation buffer contained 25 mM Tris, 192 mM glycine and various concentrations of KCl (pH 8.4). Sample solution contained 500 nM aptamer and 300 nM thrombin prepared in the separation buffer. Peaks 1 and 2 are the bound and free aptamers, respectively.
3.3 Detection length and thrombin adsorption
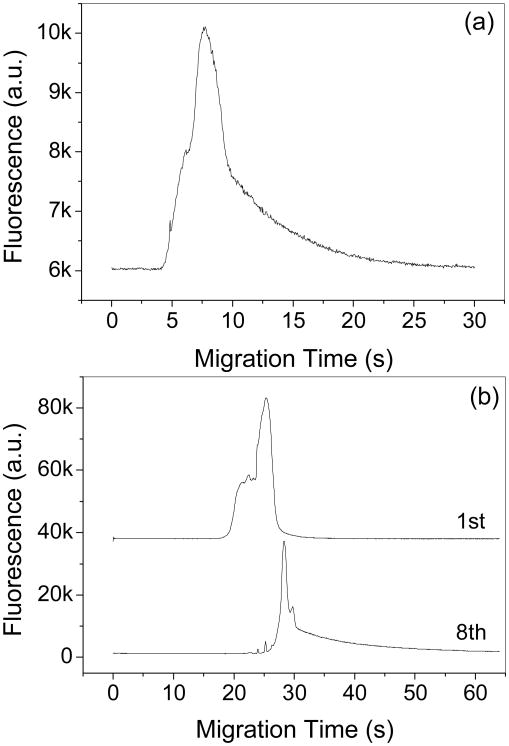
One advantage of microchip CE over traditional CE is the ability to place the detection point anywhere along the separation channel by simply moving the detection light beam. A short detection length reduces analysis time, increases the detection sensitivity and reduces the adsorption of analyte on the channel walls by decreasing the thrombin-channel contact time/surface area. Therefore, when the resolution is sufficient, the shortest detection length is preferred. The thrombin-aptamer system involves complex dissociation, which is related to time as shown in Fig. 3b. A too short separation distance, such as 0.5 cm, is unable to resolve the complex and free aptamer, while a too long distance, such as 3.0 and 5.0 cm, promotes the dissociation of the complex as indicated by a dissociated complex plateau before the free aptamer peak (Fig. 3b). Moreover, thrombin adsorption on the bare capillary walls becomes significant and results in peak tailing and broadening instead of separating the complex from the free aptamers when the thrombin concentration (1.28 μM) is much higher than the aptamer concentration (200 nM) as shown in Fig. 5a. This effect is attributed to the adsorbed thrombin molecules that subsequently retain the aptamers migrating along the thrombin-embellished channel. The thrombin adsorption also has a cumulative effect produced by repeated injections of the thrombin-aptamer mixture and finally these adsorbed thrombin molecules result in significant tailing in the following injections as shown in Fig. 5b.
Figure 5.
Thrombin adsorption effect on complex peaks. (a) The sample contained 200 nM aptamer and 1280 nM thrombin. Peaks were detected at 1.0 cm. (b) Comparison of the first and the eighth injections. The sample contained 500 nM aptamer and 300 nM thrombin. Repeated injections were detected at 5.0 cm. Other conditions are the same as in Fig. 2.
Considering the rapid dissociation kinetics of the thrombin-aptamer complex and thrombin adsorption on channel walls, a short detection length is preferred to reduce complex dissociation and the retaining effect of the adsorbed thrombin molecules to aptamers. Therefore, a detection length of 1.0 cm was selected for the other experiments.
3.4 Kd Estimation
The peak area ratio R of the free and bound aptamers is sufficient to calculate Kd with Equation 1 [15, 43]
| (1) |
Where Toand Ao are the original thrombin and aptamer concentrations in the incubation solution, respectively. R is the concentration ratio of the free (Cf) and the bound aptamers (Cb) in the incubated sample solution as expressed in Equation 2
| (2) |
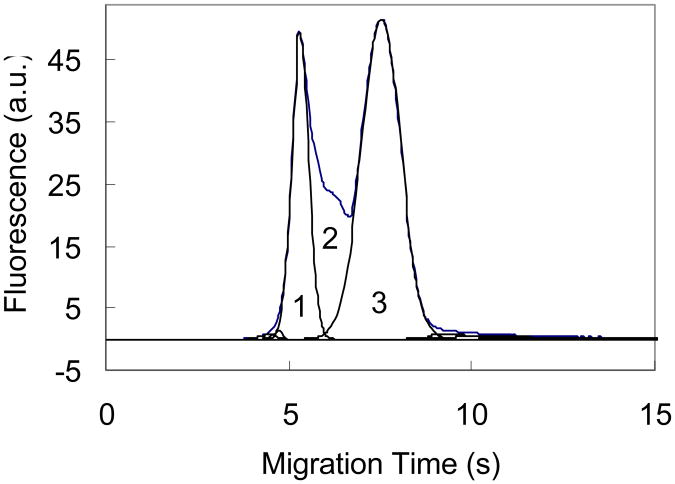
where A1, A2 and A3 are the areas of the complex, dissociated and free aptamers, respectively, as shown in Fig. 6; Afront and Atail are the areas of complex fronting and free-aptamer tailing, respectively; tf and tc are the migration times of the free aptamer and complex, respectively; and α is an adjusting factor due to the dependence of the fluorescence intensity on the migration velocity of analytes [44]. The thrombin-aptamer complex dissociates during separation due to its rapid off-rate. The dissociated aptamers produce a bridging signal between the complex and free aptamer peaks as shown in Fig. 6 (Part 2). The peak area of each part in Fig. 6 was obtained using PeakFit software (Version 4.12). Peak fronting or tailing was also fitted and added to the complex or free aptamer peaks. The final fitted peaks account for 99.99% of the original peaks. The complex peak area was adjusted according to the migration times of the complex and the free aptamer. The value of α was determined experimentally: The migration velocity ratio of the complex and the free aptamer was determined to be ∼1.35 at the electric field of 670 V/cm (Fig. 1c); to have the same migration velocity as that of the complex, the aptamer should be pumped at 905 V/cm (= 670 × 1.35); therefore, the α value was determined to be ∼90% by calculating the ratio of the fluorescence signals (plateau heights) when pumping a sample solution (500 nM aptamer in Tris/glycine buffer with 5.0 mM KCl) under 670 V/cm and then 905 V/cm.
Figure 6.
Peak area assignment. Parts 1, 2, and 3 are complex, dissociated aptamer, and free aptamer, respectively. Fronting was added to part 1 and tailing was added to free aptamer. The electropherogram was obtained using hydrodynamic injection with the sample containing 250 nM thrombin and 500 nM aptamer. Other conditions are the same as in Fig. 2.
To obtain an accurate peak area ratio R, an unbiased sample injection is essential in the determination of the free and bound aptamer concentrations in the pre-equilibrium mixture. Therefore, a hydrodynamic injection method [29] was used. This hydrodynamic injection was performed by adding a higher liquid level of sample solution in the SR than the others. Although a dispensing bias still exists, it may be negligible when two analytes have close electrophoretic mobilities.
At the same time, the dissociation rate constant (k−) can also be determined using Equation 3 since it is a first-order reaction
| (3) |
where rc is the remaining complex ratio after a dissociation time of tc, and tc is the complex migration time. rc can be determined with Equation 4.
| (4) |
The association rate constant (K+) can accordingly be calculated with Equation 5.
| (5) |
Using Equations 1-5, the results were determined at different concentrations of thrombin and are summarized in Table 1. As can be seen, the determined Kd values (37∼50 nM) are comparable with the average of 43 nM when thrombin concentrations are in the range of 150∼350 nM that is smaller than the aptamer concentration (500 nM), while 600 nM thrombin resulted in a much larger Kd value (198 nM). There are several possible factors that may affect the magnitude of the measured Kd. The first and most important factor is the thrombin adsorption on the microchip channel walls, especially when the sample contains a significant amount of free thrombin molecules that have a larger tendency to be adsorbed than their complexes (Fig. 5a). For example, a greater concentration of thrombin (600 nM) than the aptamer (500 nM) promotes thrombin adsorption on the walls and thus decreases the complex peak while increasing free aptamer peak. The total effect results in a larger determined Kd value (198 nM). On the contrary, smaller concentrations of thrombin (150∼350 nM) than the aptamer (500 nM) reduce thrombin adsorption and accordingly produce comparable Kd values. Secondly, peak area integration error can play a role. The Kd value determined with Equation 1 is R sensitive, so a small change in R may produce a large error in Kd. Thirdly, sample injection bias can also impact the results. Although a hydrodynamic injection was used to avoid injection bias, there could still be an electrokinetic dispensing bias. Finally, impurities in the aptamer solution, especially the L-aptamers that do not form complexes with thrombin as described by Huang et al. [15], can affect the results. We also noticed that there was 10 to 20% aptamer in the L-configuration when the detection length was 4 or 6 cm. Theoretically, the equilibrium dissociation constant is determined by Equation 6
Table 1.
Results of thrombin-aptamer dissociation constant and kinetic rate constants.
| T0 (nM) | 150 | 250 | 300 | 350 | 600 |
|---|---|---|---|---|---|
| Kd (nM) | 37 ± 4 | 38 ± 8 | 46 ± 7 | 50 ± 8 | 198 ± 36 |
| k− (s−1) | 0.15±0.01 | 0.09±0.00 | 0.12±0.02 | 0.08±0.01 | 0.08±0.01 |
| k+ (pM−1s−1) | 4.1 ± 0.7 | 2.4 ± 0.6 | 2.7 ± 0.3 | 1.7 ± 0.1 | 0.4 ± 0.1 |
Note: The aptamer concentration was fixed at 500 nM.
| (6) |
Where AG is the concentration of the aptamer in the G-configuration that favors complex formation with thrombin, T0 is the original thrombin concentration, and x is the complex concentration at equilibrium. Suppose the L-aptamer concentration is AL, then the original aptamer concentration is A0 = AG + AL. The measured R according to Equation 3 actually is the concentration ratio as shown in Equation 7
| (7) |
Or
| (8) |
By substituting Equation 8 into Equation 6,
| (9) |
However, the measured Kd according to Equation 1 is determined by Equation 10.
| (10) |
Therefore, the systematic error of Kd determined according to Equation 1 is ΔKd as shown in Equation 11.
| (11) |
For the determination of Kd, the aptamer concentration used here was 500 nM. Suppose that the real value of Kd is 30 nM, and suppose 10% L-aptamer is in the incubation solution. The determined Kd's are 35, 38, 56 and 206 nM at thrombin concentrations of 150, 300, 600 and 2000 nM, respectively. Similarly, if 20% L-aptamer exists, the determined Kd's are 41, 50, 98 and 439 nM at thrombin concentrations of 150, 300, 600, and 2000 nM, respectively. Therefore, for the determination of Kd using Equation 1, the thrombin concentration should be as low as possible, and the aptamer concentration as high as possible to reduce systematic error. On the other hand, thrombin concentration cannot be too low to be detected, and the concentration difference between free and bound aptamers cannot be too large considering the possibility of a non-linear peak area response.
As shown in Table 1, the dissociation of the thrombin-aptamer complex is rapid with the rate of ca 0.1 s−1. This dissociation may be accelerated by the high electric field strength as discussed by Buchanan et al. [10]. The complex can be stabilized by adding some polymer, such as PEG [15]. The large difference in the calculated association constant at different thrombin concentrations is due to the large error of Kd when a high thrombin concentration was used.
3.5 Quantitation of thrombin
Due to the rapid dissociation of thrombin-aptamer complex, direct detection of the complex peak is often impossible in traditional CE if there is no specific way to stabilize the complex [12, 15, 25]. In microchip CE, the detection length was reduced to 1.0 cm, so that the complex peak was easily detected without any modification of the separation buffer and the inner channel walls. A calibration curve for thrombin using standard samples was constructed in terms of the peak area ratio (r) of the complex to the internal standard rhodamine B versus the thrombin concentration (C). A linear function was obtained as r = 0.018C + 1.306 with a correlation coefficient of 0.9996 (R2) using least–square regression. The limit of detection at the 3-fold signal to noise ratio was determined to be ca 5.0 nM, which is lower than the previously reported value of 40 nM obtained by traditional CE [12].
4 Concluding remarks
The capability of microchip CE for studying weak binding is demonstrated using a thrombin-aptamer binding pair as a model binding system. The free selection of detection point along the separation channel in microchip CE is advantageous over traditional CE when rapid analysis is required. The adsorption effect can also be reduced by using a short detection length when a sticky protein, such as thrombin, is involved in the analysis. The Kd determination using the ratio of free and bound aptamer peak areas is transferred onto microchip CE by using a hydrodynamic injection method. The thrombin adsorption effect and systematic error produced by L-aptamer are discussed and the proposed solution to this issue is by appropriately selecting thrombin and aptamer concentrations for the determination of Kd.
The detection of complex peaks is achieved for standard thrombin samples, and the calibration curve using the increase of complex peaks is superior and preferred to the curve in terms of the decrease of free aptamer peaks in practical applications. To obtain more complexes at a specific concentration of the target, a much higher concentration of aptamer probe than the target is generally used to promote equilibrium shifts favoring the complex formation based on the binding reaction equation. Moreover, a small variation of the probe peak incurred by the complex formation usually demonstrates low sensitivity relative to the original large probe peak. One should also be aware that real samples from human blood plasma are a complex mixture containing many proteins and salts, thus complicating the detection of thrombin with the method described here. A sample preparation step should be performed to clean real samples before being determined with microchip CE.
Acknowledgments
Thanks to April Dupre (Department of Chemistry, University of Cincinnati) for valuable discussion. This work was supported by an NIH Grant GM 69547.
Abbreviations
- CE
capillary electrophoresis
- ACE
affinity capillary electrophoresis
- LIF
laser-induced fluorescence
- BR
buffer reservoir
- SR
sample reservoir
- BW
buffer waste reservoir
- SW
sample waste reservoir
References
- 1.Khandurina J, Guttman A. J Chromatogr A. 2002;943:159–183. doi: 10.1016/s0021-9673(01)01451-0. [DOI] [PubMed] [Google Scholar]
- 2.Lion N, Rohner TC, Dayon L, Arnaud IL, Damoc E, Youhnovski N, Wu ZY, Roussel C, Josserand J, Jensen H, Rossier J, Przybylski M, Girault HH. Electrophoresis. 2003;24:3533–3562. doi: 10.1002/elps.200305629. [DOI] [PubMed] [Google Scholar]
- 3.Dolnik V, Liu S. J Sep Sci. 2005;28:1994–2009. doi: 10.1002/jssc.200500243. [DOI] [PubMed] [Google Scholar]
- 4.Gao Q, Shi Y, Liu S. Fresen J Anal Chem. 2001;371:137–145. doi: 10.1007/s002160100957. [DOI] [PubMed] [Google Scholar]
- 5.Becker H, Gärtner C. Electrophoresis. 2000;21:12–26. doi: 10.1002/(SICI)1522-2683(20000101)21:1<12::AID-ELPS12>3.0.CO;2-7. [DOI] [PubMed] [Google Scholar]
- 6.Becker H, Locascio LE. Talanta. 2002;56:267–287. doi: 10.1016/s0039-9140(01)00594-x. [DOI] [PubMed] [Google Scholar]
- 7.Wang A, Fang Y. Electrophoresis. 2000;21:1281–1290. doi: 10.1002/(SICI)1522-2683(20000401)21:7<1281::AID-ELPS1281>3.0.CO;2-7. [DOI] [PubMed] [Google Scholar]
- 8.Verpoorte E. Electrophoresis. 2002;23:677–712. doi: 10.1002/1522-2683(200203)23:5<677::AID-ELPS677>3.0.CO;2-8. [DOI] [PubMed] [Google Scholar]
- 9.Tao L, Kennedy RT. Electrophoresis. 1997;18:112–117. doi: 10.1002/elps.1150180121. [DOI] [PubMed] [Google Scholar]
- 10.Buchanan DD, Jameson EE, Perlette J, Malik A, Kennedy RT. Electrophoresis. 2003;24:1375–1382. doi: 10.1002/elps.200390176. [DOI] [PubMed] [Google Scholar]
- 11.Tao L, Kennedy RT. Anal Chem. 1996;68:3899–3906. doi: 10.1021/ac960560+. [DOI] [PubMed] [Google Scholar]
- 12.German I, Buchanan DD, Kennedy RT. Anal Chem. 1998;70:4540–4545. doi: 10.1021/ac980638h. [DOI] [PubMed] [Google Scholar]
- 13.Shimura K, Kasai K. Anal Biochem. 1997;251:1–16. doi: 10.1006/abio.1997.2212. [DOI] [PubMed] [Google Scholar]
- 14.He X, Ding Y, Li D, Lin B. Electrophoresis. 2004;25:697–711. doi: 10.1002/elps.200305727. [DOI] [PubMed] [Google Scholar]
- 15.Huang CC, Cao Z, Chang HT, Tan W. Anal Chem. 2004;76:6973–6981. doi: 10.1021/ac049158i. [DOI] [PubMed] [Google Scholar]
- 16.Pavski V, Le XC. Anal Chem. 2001;73:6070–6076. doi: 10.1021/ac0107305. [DOI] [PubMed] [Google Scholar]
- 17.Drabovich A, Berezovski M, Krylov SN. J Am Chem Soc. 2005;127:11224–11225. doi: 10.1021/ja0530016. [DOI] [PubMed] [Google Scholar]
- 18.Berezovski M, Drabovich A, Krylova SM, Musheev M, Okhonin V, Petrov A, Krylov SN. J Am Chem Soc. 2005;127:3165–3171. doi: 10.1021/ja042394q. [DOI] [PubMed] [Google Scholar]
- 19.El-Shafey A, Zhong H, Jones G, Krull IS. Electrophoresis. 2002;23:945–950. doi: 10.1002/1522-2683(200203)23:6<945::AID-ELPS945>3.0.CO;2-F. [DOI] [PubMed] [Google Scholar]
- 20.Chu YH, Avila LZ, Gao J, Whitesides GM. Acc Chem Res. 1995;28:461–468. [Google Scholar]
- 21.Stettler AR, Schwarz MA. J Chromatogr A. 2005;1063:217–225. doi: 10.1016/j.chroma.2004.11.079. [DOI] [PubMed] [Google Scholar]
- 22.Heegaard NHH, Nissen MH, Chen DDY. Electrophoresis. 2002;23:815–822. doi: 10.1002/1522-2683(200203)23:6<815::AID-ELPS815>3.0.CO;2-V. [DOI] [PubMed] [Google Scholar]
- 23.Heegaard NHH, Nilsson S, Guzman NA. J Chromatogr B. 1998;715:29–54. doi: 10.1016/s0378-4347(98)00258-8. [DOI] [PubMed] [Google Scholar]
- 24.Bock LC, Griffin LC, Latham JA, Vermaas EH, Toole JJ. Nature. 1992;355:564–566. doi: 10.1038/355564a0. [DOI] [PubMed] [Google Scholar]
- 25.Berezovski M, Nutiu R, Li Y, Krylov SN. Anal Chem. 2003;75:1382–1386. doi: 10.1021/ac026214b. [DOI] [PubMed] [Google Scholar]
- 26.Jacobson SC, Culbertson CT, Daler JE, Ramsey JM. Anal Chem. 1998;70:3476–3480. [Google Scholar]
- 27.Jacobson SC, Hergenroder R, Koutny LB, Ramsey JM. Anal Chem. 1994;66:1114–1118. [Google Scholar]
- 28.Kankia BI, Marky LA. J Am Chem Soc. 2001;123:10799–10804. doi: 10.1021/ja010008o. [DOI] [PubMed] [Google Scholar]
- 29.Gong M, Wehmeyer KR, Stalcup AM, Limbach PA, Heineman WR. Electrophoresis. doi: 10.1002/elps.200600616. Accepted. [DOI] [PMC free article] [PubMed] [Google Scholar]
- 30.Jacobson SC, Hergenroder R, Koutny LB, Warmack RJ, Ramsey JM. Anal Chem. 1994;66:1107–1113. [Google Scholar]
- 31.Sinton D, Ren L, Li D. J Colloid Interface Sci. 2003;266:448–456. doi: 10.1016/s0021-9797(03)00630-1. [DOI] [PubMed] [Google Scholar]
- 32.Jacobson SC, Koutny LB, Hergenroeder R, Moore AW, Jr, Ramsey JM. Anal Chem. 1994;66:3472–3476. [Google Scholar]
- 33.Slentz BE, Penner NA, Regnier F. Anal Chem. 2002;74:4835–4840. doi: 10.1021/ac020301m. [DOI] [PubMed] [Google Scholar]
- 34.Ermakov SV, Jacobson SC, Ramsey JM. Anal Chem. 2000;72:3512–3517. doi: 10.1021/ac991474n. [DOI] [PubMed] [Google Scholar]
- 35.Baldrich E, O'Sullivan CK. Anal Biochem. 2005;341:194–197. doi: 10.1016/j.ab.2005.02.031. [DOI] [PubMed] [Google Scholar]
- 36.Datta B, Armitage BA. J Am Chem Soc. 2001;123:9612–9619. doi: 10.1021/ja016204c. [DOI] [PubMed] [Google Scholar]
- 37.Kumar N, Maiti S. Biochem Biophys Res Co. 2004;319:759–767. doi: 10.1016/j.bbrc.2004.05.052. [DOI] [PubMed] [Google Scholar]
- 38.Vairamani M, Gross ML. J Am Chem Soc. 2003;125:42–43. doi: 10.1021/ja0284299. [DOI] [PubMed] [Google Scholar]
- 39.Wang KY, McCurdy S, Shea RG, Swaminathan S, Bolton PH. Biochemistry. 1993;32:1899–1904. doi: 10.1021/bi00059a003. [DOI] [PubMed] [Google Scholar]
- 40.Wang KY, Krawczyk SH, Bischofberger N, Swaminathan S, Bolton PH. Biochemistry. 1993;32:11285–11292. doi: 10.1021/bi00093a004. [DOI] [PubMed] [Google Scholar]
- 41.Gao JY, Dubin PL, Muhoberac BB. Anal Chem. 1997;69:2945–2951. doi: 10.1021/ac970026h. [DOI] [PubMed] [Google Scholar]
- 42.Spiridonova VA, Rog EV, Dugina TN, Strukova SM, Kopylov AM. Russ J Bioorg Chem. 2003;29:450–453. doi: 10.1023/a:1026001609421. [DOI] [PubMed] [Google Scholar]
- 43.Berezovski M, Krylov SN. J Am Chem Soc. 2002;124:13674–13675. doi: 10.1021/ja028212e. [DOI] [PubMed] [Google Scholar]
- 44.Gong M, Wehmeyer KR, Limbach PA, Heineman WR. Electrophoresis. 2007;28:837–842. doi: 10.1002/elps.200600398. [DOI] [PMC free article] [PubMed] [Google Scholar]


