Summary
Reconversion of bone marrow is a reverse process of natural replacement of red marrow by yellow marrow. The occurrence of reconversion can be misleading and challenging in interpretation of musculoskeletal system imaging. Changes of signal intensity in bone marrow are frequently observed in radiological routine and its diversity can cause a suspicion of pathologic findings. Therefore, the knowledge about distribution of red and yellow bone marrow depending on age, concomitant diseases and presentation of the patient are essential for MR image interpretation.
Keywords: marrow reconversion, bone marrow imaging, magnetic resonance
Background
Reconversion of bone marrow is a reverse process of natural replacement of red marrow by yellow marrow. The occurrence of reconversion can be misleading and challenging in interpretation of musculoskeletal system imaging. Changes of signal intensity in bone marrow are frequently observed in radiological routine and its diversity can cause a suspicion of pathologic findings. Therefore, the knowledge about distribution of red and yellow bone marrow depending on age, concomitant diseases and clinical condition, is essential for interpretation of the musculoskeletal system MR images.
Anatomy and Physiology
Bone marrow is one of the biggest organs in the human body. Its main function is hematopoiesis providing the circulating blood with optimal supply of platelets, erythrocytes and leukocytes for coagulation, immunity and oxygen transport. Histologically, bone marrow consists of cellular components, i.e. hematopoietic and fat cells, and supporting structures, i.e. osseous trabeculae, reticular-adventitial cells, and vascular, lymphatic and nervous structures. With regard to physiology, bone marrow occurs in two forms: red marrow – hematopoietically active, and yellow marrow – inactive. The red bone marrow takes its name due to a large number of erythropoietic cells, whereas yellow bone marrow – due to predominance of fat cells. Moreover, the vascular net in the red bone marrow is much thicker than in the yellow bone marrow [1].
Imaging
Magnetic resonance is the basic method of bone marrow imaging since the obtained images depend on chemical composition of the soft tissue. Red bone marrow and yellow bone marrow have different chemical composition. Red marrow contains approx. 40% fat, 40% water and 20% protein. Yellow bone marrow contains 80% fat, 15% water and 5% protein (Table 1). The most sensitive sequence used for imaging of bone marrow changes is T1-weighted sequence (SE), since signal intensity on T1-weighted images is mostly influenced by the presence of fat [2]. Red bone marrow on T1-weighted images shows a less intense signal than normal muscles and intervertebral discs, whereas yellow bone marrow on T1-weighted images has a significantly higher signal intensity than the other structures. T1-weighted images can be completed with sequences with fat suppression in order to confirm its presence [3]. At present, T2-weighted images (T2* GRE) are not regarded as standard for evaluating differences between the intensity of red and yellow bone marrow. Images obtained after contrast administration are also not useful in routine evaluation of bone marrow. Yellow bone marrow does not show enhancement, and red bone marrow shows a minimal (<10%) enhancement, thus, the differences are unimportant [4].
Table 1.
Cellular and chemical components of bone marrow in adults.
| Type of bone marrow | Cellular composition | Chemical composition |
|---|---|---|
| Yellow bone marrow | 95% fat cells | 80% fat |
| 5% non-fat cells | 15% water | |
| 5% protein | ||
|
| ||
| Red bone marrow | 40% fat cells | 40% fat |
| 60% hematopoietic cells | 40% water | |
| 20% protein | ||
Sequences sensitive to the presence of water protons (STIR/FLAIR) are useful in excluding the areas of bone marrow oedema (injury/inflammation) which show a low signal intensity on T1-weighted images. In the case oedema, signal intensity is higher than that for red marrow is observed, since the proportion of water protons and fat protons is higher for oedema.
Radiological examinations (X-ray, Computed Tomography) are import ant for excluding the presence of sclerotic areas which show a low signal intensity on MR images.
Conversion and Reconversion
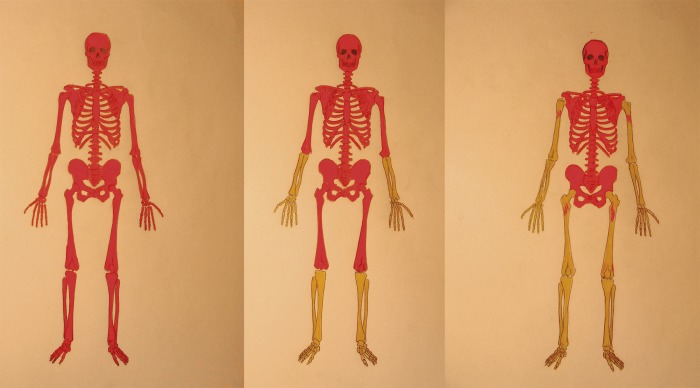
At birth, the whole skeleton is filled with red bone marrow. Physiological conversion of red into yellow bone marrow, lasting for the whole childhood until adulthood and has a constant, predictable pattern in the whole skeleton as well as in individual bones. The entire process is completed by the age of 25 years. Conversion starts from the limbs, next red marrow is replaced by yellow marrow proximally to the axial skeleton [4,5] (Figure 1A).
Figure 1A.
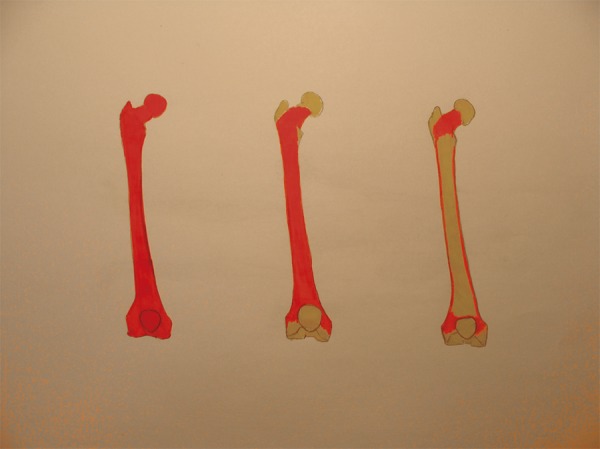
Graphic shows normal developmental transformation of bone marrow in the long bones (courtesy of L. Chudziak-Grędzicki).
Conversion of bone marrow in the long bones occurs as follows: first, yellow bone marrow appears in the epiphysis and it “dissolves” towards the articular ends: first – distal, then – proximal (Figure 1B).
Figure 1B.
Graphic shows process of conversion of red-to-yellow bone marrow in the skeleton. On the left – red marrow fills all marrow cavities (at birth); the middle picture shows fatty conversion in the distal extremities (in childhood); the right picture shows progression of this process in the axial skeleton (courtesy of L. Chudziak-Grędzicki).
At the age of 25 years, red bone marrow distribution shows its adult pattern, characterised by the presence of red bone marrow in the axial skeleton (vertebral bodies, sacral bone and medial parts of hip bones) and articular ends of humeral and femoral bones. However, body ageing is accompanied by further, slow displacement of red marrow by yellow marrow which eventually also prevails in the pelvis and spine. Tiny islets of red marrow may still persist in the long bones (femur head and humerus head) and they should not be misinterpreted as pathology. In the axial skeleton, yellow marrow forms islets inside red marrow. The most distal parts of the skeleton are only filled with yellow bone marrow.
Reconversion of bone marrow is a reverse process of natural replacement of red marrow by yellow marrow. This process involves the appearance of areas of normal red marrow in the places where yellow marrow occurs, and is reverse of conversion.
Reconversion is a physiological response to increased hematopoietic needs of the body, including [6–8]:
-
Non-medical conditions:
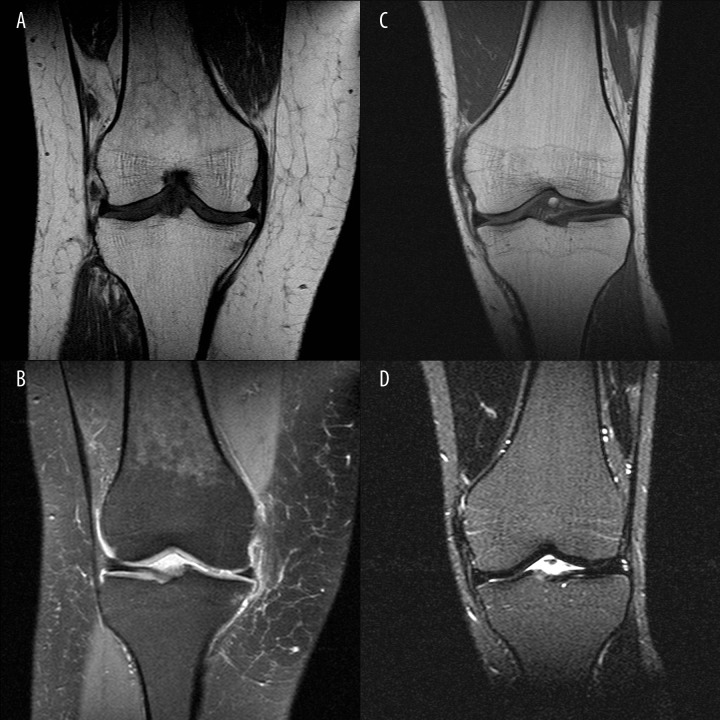
– smoking cigarettes (so called ‘heavy smokers’ >2 pack years) (Figure 2A–D),
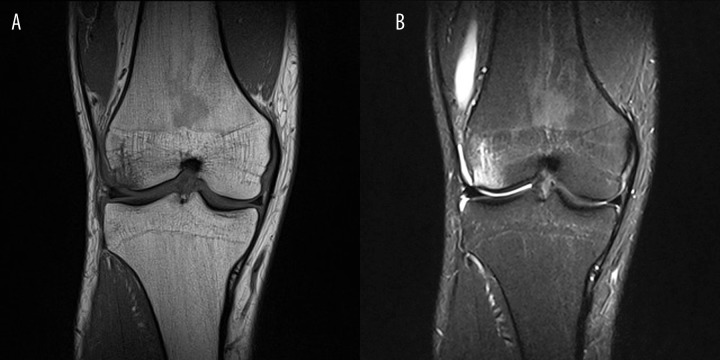
– doing sports with a large oxygen debt (long-distance running, free diving) (Figure3A, B).
-
Medical conditions:
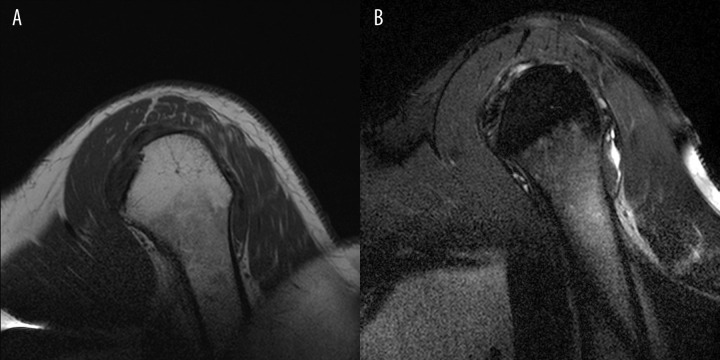
– obesity and related respiratory disorders (OBPS) and diabetes (Figure 4A–D),
– chronic conditions related to anaemia (chronic infectious diseases, hemoglobinopathy) with a special form of reconversion: disperse red marrow hyperplasia (Figure 5A,B),
– patients treated with hematopoietic growth factors.
Figure 2.
(A) Coronal T1-weighted image of the right knee joint in a 43-year old female patient reviewed due to chronic knee pain. In the distal femur there is patchy decrease in signal intensity, not extending beyond the line of growth plate. (B) PD fat saturation image. Clinical data from patient database CM Enel-Med S.A. (MAXIMA): obesity >25 BMI, smoking habit and type 2 diabetes treated with insulin. (C, D) Coronal T1-weighted and PD images of the knee joint in another 40-year old female without any known internal diseases show a typical for adults bone marrow picture in this area. The entire marrow cavity is filled with yellow bone marrow.
Figure 3.
(A) Coronal T1-wieghted images of the knee joint in a 30yo patient after knee injury. Decreased signal intensity is visible in the marrow cavity (signal intensity of the muscles is lower than of marrow cavity), reaching but not extending beyond the growth plate. Patient is an amateur long-distance runner, with weekly routine over 70 km. (B) PD fat saturation images show decreased signal intensity of yellow bone marrow. The image also reveals the presence of bone marrow edema on the lateral femoral epicondyle. Signal intensity of edematous bone marrow is higher than in metaphyseal areas of reconversion.
Figure 4A, B.
(A) Sagital oblique T1-weighted images of a 45 yo patient with shoulder pain shows areas of lower signal intensity in the metaphyseal area corresponding to bone marrow reconversion, which do not extend beyond the growth plate. Clinical data: smoking habit. (B) Sagital oblique PD fat saturation images in the same patient.
Figure 5A, B.
Coronal T1-weighted images show areas of marrow reconversion in the proximal femora of a 33-year old female patient with microcytic anaemia treated with iron supplements.
Conclusions
The knowledge about distribution of red and yellow bone marrow depending on age, concomitant diseases and clinical condition, is essential for interpretation of the musculoskeletal system MR images.
Changes of MR signal intensity in bone marrow are frequently observed in radiological routine and can result from physiological marrow activity or pathologies.
While differentiating physiological marrow reconversion from suspicious pathologies during MR image evaluation, the following aspects should be taken into consideration: nature of signal in T1-weighted and fat saturation sequences, distribution and symmetry of changes in the whole skeleton and in individual bones.
Features indicating marrow reconversion on MR images are:
– symmetry of changes with low signal intensity on T1-weighted images,
– changes do not extend beyond the growth plate line, sparing the articular ends,
– changes have characteristic location in relation to the axial skeleton.
Moreover, anamnesis data concerning smoking, sports, types of used medicines and comorbidities is necessary for a describing radiologist to interpret correctly changes observed on MR images.
Routine sequences (T1-weighted, T2-weighted, PD fat saturation sequences, STIR) used in everyday diagnostics of locomotor diseasess are usually sufficient to evaluate the presence of bone marrow reconversion. In the case of other pathologies involving the marrow cavity, it is usually necessary to extend MR imaging with additional sequences and additional diagnostic imaging (X-ray, Computed Tomography, Scintigraphy, PET).
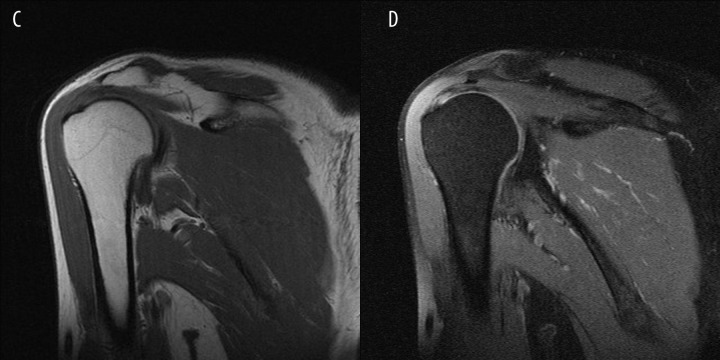
Figure 4C, D.
Coronal oblique T1-weighted and PD fat saturation images in a 40 yo patient – a picture typical for age.
References:
- 1.Vande Berg BC, Malghem J, Lecouvet FE, et al. Magnetic resonance imaging of normal bone marrow. Eur Radiol. 1998;8(8):1327–34. doi: 10.1007/s003300050547. [DOI] [PubMed] [Google Scholar]
- 2.Vande Berg BC, Malghem J, Lecouvet FE, et al. Magnetic resonance imaging of the bone marrow in hematological malignancies. Eur Radiol. 1998;8(8):1335–44. doi: 10.1007/s003300050548. [DOI] [PubMed] [Google Scholar]
- 3.Andrews CL. Evaluation of the Marrow Space in the Adult Hip. RadioGraphics. 2000;20:S27–42. doi: 10.1148/radiographics.20.suppl_1.g00oc11s27. [DOI] [PubMed] [Google Scholar]
- 4.Ricci C, Cova M, Kang YS, et al. Normal Age-related Patterns of Cellular and Fatty Bone Marrow Distribution in the Axial Skeleton: MR Imaging Study. Radiology. 1990;177(1):83–88. doi: 10.1148/radiology.177.1.2399343. [DOI] [PubMed] [Google Scholar]
- 5.Laor T, Jaramillo D. MR imaging Insights into Skeletal Maturation: What Is Normal? Radiology. 2009;250:28–38. doi: 10.1148/radiol.2501071322. [DOI] [PubMed] [Google Scholar]
- 6.Poulton TB, Murphy WD, Duerk JL, et al. Bone Marrow Reconversion in Adults Who Are Smokers: MR Imaging Findings. AJR Am J Roentgenol. 1993;161(6):1217–21. doi: 10.2214/ajr.161.6.8249729. [DOI] [PubMed] [Google Scholar]
- 7.Hwang S, Panicek DM. Magnetic resonance of bone marrow in oncology, Part 1–2. Skeletal Radiol. 2007;36:913–20. doi: 10.1007/s00256-007-0309-3. [DOI] [PubMed] [Google Scholar]
- 8.Cosentini T, Le Donne R, Mancini D, et al. Magnetic Resonance imaging evaluation of bone marrow changes in obstructive sleep apnoea in adults. Radiol Med. 2006;111(4):572–84. doi: 10.1007/s11547-006-0052-1. [DOI] [PubMed] [Google Scholar]


