Abstract
Low endogenous testosterone production, known as hypogonadism is commonly associated with conditions inducing muscle wasting. Akt signaling can control skeletal muscle mass through mTOR regulation of protein synthesis and FoxO regulation of protein degradation, and this pathway has been previously identified as a target of androgen signaling. However, the testosterone sensitivity of Akt/mTOR signaling requires further understanding in order to grasp the significance of varied testosterone levels seen with wasting disease on muscle protein turnover regulation. Therefore, the purpose of this study is to determine the effect of androgen availability on muscle Akt/mTORC1/FoxO3a regulation in skeletal muscle and cultured C2C12 myotubes. C57BL/6 mice were either castrated for 42 days or castrated and treated with the nandrolone decanoate (ND) (6 mg/kg bw/wk). Testosterone loss (TL) significantly decreased volitional grip strength, body weight, and gastrocnemius (GAS) muscle mass, and ND reversed these changes. Related to muscle mass regulation, TL decreased muscle IGF-1 mRNA, the rate of myofibrillar protein synthesis, Akt phosphorylation, and the phosphorylation of Akt targets, GSK3β, PRAS40 and FoxO3a. TL induced expression of FoxO transcriptional targets, MuRF1, atrogin1 and REDD1. Muscle AMPK and raptor phosphorylation, mTOR inhibitors, were not altered by low testosterone. ND restored IGF-1 expression and Akt/mTORC1 signaling while repressing expression of FoxO transcriptional targets. Testosterone (T) sensitivity of Akt/mTORC1 signaling was examined in C2C12 myotubes, and mTOR phosphorylation was induced independent of Akt activation at low T concentrations, while a higher T concentration was required to activate Akt signaling. Interestingly, low concentration T was sufficient to amplify myotube mTOR and Akt signaling after 24h of T withdrawal, demonstrating the potential in cultured myotubes for a T initiated positive feedback mechanism to amplify Akt/mTOR signaling. In summary, androgen withdrawal decreases muscle myofibrillar protein synthesis through Akt/mTORC1 signaling, which is independent of AMPK activation, and readily reversible by anabolic steroid administration. Acute Akt activation in C2C12 myotubes is sensitive to a high concentration of testosterone, and low concentrations of testosterone can activate mTOR signaling independent of Akt.
Keywords: Muscle, Testosterone, raptor, Akt, mTOR, AMPK, FoxO, REDD1, MuRF1, atrophy, IGF-1, castration
1. Introduction
A reduction in circulating testosterone levels, referred to as hypogonadism is associated with a reduction in lean body mass and increased percentage of fat mass (Katznelson, Finkelstein, Schoenfeld et al., 1996). These effects are rescued with supplementation of testosterone or pharmacological derivatives (Bhasin, Storer, Berman et al., 1997, Brodsky, Balagopal and Nair, 1996). In addition, there is a high prevalence of hypogonadism in wasting diseases including human immunodeficiency virus (HIV)/acquired immunodeficiency syndrome (AIDS) (Dobs, Dempsey, Ladenson et al., 1988), end-stage renal disease (Johansen, 2004), COPD (Van Vliet, Spruit, Verleden et al., 2005), cancer (Vigano, Piccioni, Trutschnigg et al., 2010), and type 2 diabetes (Dhindsa, Prabhakar, Sethi et al., 2004). Testosterone replacement therapy has shown to be effective in rescuing the loss of muscle mass in several conditions of muscle wasting (Bhasin, Storer, Javanbakht et al., 2000, Snyder, Peachey, Hannoush et al., 1999, Kenny, Prestwood, Gruman et al., 2001, Morley, Perry, Kaiser et al., 1993, Tenover, 1992, Bhasin, Storer, Asbel-Sethi et al., 1998). Despite hypogonadism underlying several conditions of muscle wasting, the mechanism/s of action and the sensitivity of these processes to androgens are still unclear. Further investigation is warranted to elucidate androgen-induced regulation of anabolic/catabolic signaling in muscle.
Castration is an effective technique for the elimination of endogenous testosterone production in rodents (Rogozkin, 1979). Testosterone loss results in a reduction in body weight gain, muscle atrophy and increased fat stores (Antonio, Wilson and George, 1999, Axell, MacLean, Plant et al., 2006). As little as 2-weeks of castration can result in muscle atrophy and suppression of muscle androgen receptor expression, which can be rescued by Dihydrotestosterone (DHT) treatment (Antonio et al., 1999). Castration induced muscle mass loss is associated with reduced myofiber cross sectional area in both fast and slow muscles, and reduced contractile strength (Axell et al., 2006). Castration has also been shown to induce alteration in the morphology of the soleus muscle that includes irregular Z lines, loss of the lamina externa and glycogen clusters under the sarcomere, which were prevented by testosterone administration (Oner, Oner, Sahin et al., 2008). Although muscle mass and morphology with androgen loss has been well documented, the androgen sensitive mechanisms regulating muscle protein turnover require further investigation.
The IGF/Akt/mTORC1 signaling pathway is an essential regulator of skeletal muscle’s capacity for protein synthesis and degradation (Frost and Lang, 2007). In humans, testosterone deficiency is associated with a reduction in both circulating IGF-1 (Grinspoon, Corcoran, Lee et al., 1996) and intramuscular IGF-1 expression (Mauras, Hayes, Welch et al., 1998). Similar effects were observed in rats as five weeks of castration reduced muscle IGF-1 staining while testosterone administration reversed these effects (Oner et al., 2008). In the canonical IGF-1/Akt/mTORC1 pathway, Akt activation of mTOR and subsequent phosphorylation of p70S6K and 4E-BP1 will induce protein synthesis. Akt can also enhance protein synthesis through inhibition of proteins that impede protein synthesis such as glycogen syntheses kinase-3 beta (GSK3β). Testosterone administration to female rats increased the IGF-1 signaling pathway by increasing muscle IGF-1 mRNA expression and phosphorylation of Akt and GSK3β (Yin, Chai, Yu et al., 2009). The effect of androgen loss and subsequent administration on muscle Akt signaling is currently equivocal, and in need of further clarification. Androgen loss has demonstrated either a reduced or increased phosphorylation of Akt with castration (Ibebunjo, Eash, Li et al., 2011, Haren, Siddiqui, Armbrecht et al., 2011). The response to testosterone supplementation after castration is also equivocal on the activation of Akt (Hourde, Jagerschmidt, Clement-Lacroix et al., 2008). These differences may be related to the muscle examined, dose and type of androgen, and the length of time the rodent was castrated. However, it is clear that further investigation is necessary to understand the sensitivity of muscle IGF-1/Akt/mTORC1 signaling to androgen.
mTORC1 complex activity has emerged as a critical regulator of protein synthesis, as well as several other cellular processes, which can occur independent of upstream Akt activation (Potier, Darcel and Tome, 2009, Sarbassov, Ali and Sabatini, 2005). Although administration of mTORC1 inhibitor rapamycin to L6 myotubes can block testosterone induced increases in protein content (Wu, Bauman, Blitzer et al., 2010), mTORC1 regulation by anabolic steroid administration is not well understood. While regulation of mTORC1 through PI3K/Akt signaling has been extensively documented (Inoki, Zhu and Guan, 2003, Vander Haar, Lee, Bandhakavi et al., 2007), the potential for testosterone to regulate mTOR through other signaling pathways has not been as well defined. mTORC1 consists of raptor (regulated associated protein of mTOR), mLST8, PRAS40 (proline-rich Akt substrate-40) and mTOR. PRAS40, a known repressor of mTOR signaling, can be phosphorylated by Akt and thus relieving inhibition of PRAS40 on mTOR (Sancak, Thoreen, Peterson et al., 2007). An additional well-described negative regulator of mTORC1 activity is the energy sensitive 5`-adenosine monophosphate-activated protein kinase (AMPK) (Bolster, Crozier, Kimball et al., 2002, Horman, Browne, Krause et al., 2002, Chan, Soltys, Young et al., 2004). AMPK can inhibit mTOR signaling by phosphorylation of the tuberous sclerosis complex 2 (TSC2) gene product Tuberin on Thr1227 and Ser1345 (Inoki et al., 2003) and phosphorylation of raptor at Ser792 (Gwinn, Shackelford, Egan et al., 2008). The phosphorylation of raptor prevents binding of and eventual phosphorylation of p70S6K and 4E-BP1. C2C12 cells treated with AICAR to activate AMPK have reduced protein synthesis, polysome aggregation and down steam mTOR signaling proteins 4E-BP1, S6K1 and eEF2 (Williamson, Bolster, Kimball et al., 2006). Although IGF-1 expression and Akt activation have been shown to be sensitive to circulating anabolic steroids, regulation of the mTORC1 complex beyond the canonical IGF-1 pathways need further examination.
In addition to protein synthesis regulation, Akt can inhibit protein degradation through phosphorylation and inhibition of the forkhead box O (FoxO) family of transcription factors. In skeletal muscle, the activation of FoxO1 and 3 have been identified in conditions of muscle atrophy such as starvation (Lecker, Jagoe, Gilbert et al., 2004), diabetes (Lee, Dai, Hu et al., 2004) and cachexia (Lecker et al., 2004, White, Baynes, Welle et al., 2011). The FoxO family of proteins translocates from the cytosol to the nucleus to promote transcription of atrophy related genes, in particular the muscle atrophy F-box (MAFbx; also called atrogin1) (Sandri, Sandri, Gilbert et al., 2004), muscle ring Finger-1 also called MuRF1 (Bodine, Latres, Baumhueter et al., 2001) and regulated in development and DNA damage response 1 (REDD1, also referred to as Rtp801 and DDIT4) (Harvey, Mattila, Sofer et al., 2008). Akt can phosphorylate and inhibit the FoxO proteins from entering the nucleus and prevents gene transcription (Latres, Amini, Amini et al., 2005). REDD1 inhibits mTORC1 signaling through activation of upstream TSC2 (Brugarolas, Lei, Hurley et al., 2004, Reiling and Hafen, 2004, Sofer, Lei, Johannessen et al., 2005). REDD1 protein and mRNA expression are increased in muscle during starvation (McGhee, Jefferson and Kimball, 2009), dexamethasone-induced atrophy (McGhee et al., 2009, Wang, Kubica, Ellisen et al., 2006) and hypoxia (Favier, Costes, Defour et al., 2010). Androgen withdrawal has been reported to cause muscle atrophy (Antonio et al., 1999, Axell et al., 2006, Oner et al., 2008) through ubiquitin-proteasome-dependent proteolysis pathways (Glass, 2005). A purposed mechanism for androgen-induced inhibition of muscle catabolism is through the down regulation of FoxO and FoxO-related genes transcription (Ibebunjo et al., 2011, Pires-Oliveira, Maragno, Parreiras-e-Silva et al., 2010). Testosterone and other pharmacological derivatives prevent dexamethasone-induced muscle atrophy and block gene expression of FoxO1 (Qin, Pan, Wu et al., 2010) and atrogin1/MAFbx (Van Balkom, Dekhuijzen, Folgering et al., 1998). In addition, anabolic steroid treatment can reduce REDD1/2 gene expression during dexamethasone (Wu, Zhao, Zhao et al., 2010) and denervation-induced atrophy (Qin, Pan, Bauman et al., 2010). Although FoxO targets atrogin1/MAFbx and MuRF1 are increased with castration (Ibebunjo et al., 2011), the role of REDD1 expression during castration-induced muscle atrophy has not been explored.
Hypogonadism is common during several conditions associated with muscle wasting, and while acknowledged, its physiological significance in the regulation of muscle wasting is just emerging. The Ak/mTORC1 pathway has been extensively investigated as a regulator of muscle protein turnover, controlling both muscle protein synthesis through mTORC1 and degradation processes through FoxO. However, the testosterone sensitivity of Akt/mTOR signaling requires further understanding in order to grasp the significance of varied testosterone levels seen with wasting disease on muscle protein turnover regulation. Therefore, the purpose of this study is to determine the effect of androgen availability on muscle Akt/mTORC1/FoxO3a regulation in skeletal muscle and cultured C2C12 myotubes. We hypothesized that castration-induced androgen withdrawal would disrupt the regulation of muscle protein turnover through Akt dependent regulation of mTORC1 signaling and FoxO transcriptional targets.
2. Materials and methods
2.1. Animals
C57BL/6 mice were purchased from Jackson Laboratories (Bar Harbor, ME) at approximately 8 weeks of age. The mice were sent in two separate occasions. The first set of mice was used for the sham operated group and the second group of mice was used for the castrated groups (see Castration methodology). All surgeries were performed 1 week after arrival to the University of South Carolina animal facility. Castrated mice were randomly selected to receive oil or nandrolone decanoate administration for 28 days. The 3 treatment groups used in this paper were as follows: 1) Sham, 2) castrated (Cas) and 3) castrated receiving nandrolone decanoate (Cas+ND). All animals were housed individually, kept on a 12:12-h light-dark cycle, and given ad libitum access to normal rodent chow and water for the duration of the study at the fully accredited animal care facilities at the University of South Carolina, Columbia. The University of South Carolina Animal Care and Use Committee approved all procedures used in this study.
2.2. Castration surgery
After 1 week in the animal facility (approximately 9 weeks of age) all mice were subjected to castration surgery as previously described (White, Baltgalvis, Sato et al., 2009). Mice were given a subcutaneous injection of ketamine/xylazine/acepromazine cocktail (1.4 ml/kg BW). A small incision (~2cm) was made in the abdominal wall. Testes were located and pulled up through the incision. A cut through the epididymis was made to remove the testes. Following removal, the vas deferens were tied off and the abdominal incision sealed with suture. All mice were given 2 weeks of recovery to allow a wash out period for endogenous testosterone before steroid treatment (Antonio et al., 1999).
2.3. Anabolic steroid administration
Fourteen days after the castration procedure Nandrolone decanoate (Deca-Durabolin, Oranon) (ND) (6 mg/kg bw) or sesame seed oil control was injected, referred to as day 0. The same volume was injected intramuscularly into the hip region every 7 days, and the right and left hip alternated each week for the duration of the study. Nandrolone decanoate has been used previously in our laboratory to study androgen sensitive pathways in skeletal muscle due to its long half-life and potent anabolic effects in rodent skeletal msucle (White et al., 2009, McClung, Lee, Thompson et al., 2003, Carson, Lee, McClung et al., 2002).
2.4. Grip testing
Forelimb grip strength was assessed at the end of the study. Each mouse was allowed to grab a bar attached to a force transducer as it was pulled by the tail horizontally away from the bar (Model 1027 CSM; Columbus Instrument Co., Columbus, Ohio) (Smith, Hicks, Ortiz et al., 1995). Five repetitions with a 5-s pause between each were averaged to determine grip strength for each mouse.
2.5. Tissue collection
Mice were given a subcutaneous injection of ketamine/xylazine/acepromazine cocktail (1.4 ml/kg BW). Gastrocnemius muscles and tibias were excised. Tibia length was measured as an indicator of animal body size. The gastrocnemius muscles were rinsed in PBS, snap frozen in liquid nitrogen, weighed, and stored at −80 °C until further analysis.
2.6. Morphological Analysis
Myofiber cross sectional area analysis was determined as previously described (Baltgalvis, Berger, Pena et al., 2009). Eight distinct digital images from H&E stained muscle sections (10µm) from the mid-belly of the gastrocnemius muscle at a 40× magnification were taken and analyzed for fiber cross-sectional area using NIH imaging software (Image J). Each fiber was traced with a handheld mouse and the number of pixels traced was calibrated to a defined area in µm2. The researcher, blinded to the treatment groups, traced approximately 150 fibers per sample. All fibers in the crosssection images were quantified unless the sarcolemma was not intact.
2.7. Myofibrillar protein synthesis
Myofibrillar protein synthesis measurements were performed as previously described (White et al., 2011, Welle, Bhatt and Pinkert, 2006). Gastrocnemius muscle samples were homogenized in 1 ml water. Myofibrils and other insoluble proteins were pelleted by centrifugation, and the supernatants containing free amino acids were used to determine the ratio of free 2H5-phenylalanine (m/z 239 fragment) to endogenous (unlabeled) phenylalanine (m/z 234 fragment). The ratios were determined by GC-mass spectrometric analysis of the t-butyldimethylsilyl derivatives of these amino acids. Myofibrillar proteins were washed, hydrolyzed, and analyzed for 2H5-phenylalanine enrichment by monitoring the m/z 237 and 239 fragments.
The fractional rate of myofibrillar synthesis, % per day, was calculated as the % enrichment of tracer in the hydrolysate of myofibrillar protein, divided by the tracer enrichment in the free amino acid pool of muscle tissue. Myofibrillar protein enrichment was determined from the m/z 237 and m/z 239 ions because the lightest isotopomer (m/z 234) saturated the MS detector. The myofibrillar/free enrichment ratio was multiplied by 48 to obtain %/day values because tracer incorporation occurred over a period of 30 min.
2.8. RNA isolation, cDNA synthesis, and real time PCR
RNA isolation, cDNA synthesis, and real-time PCR was performed as previously described [61], using reagents from Applied Biosystems (Foster City, CA). Primers for Atrogin-1, MuRF1, IGF-1, REDD1, PGC-1α, MHC IIa, MHC IIb (FAM dye) and 18s (VIC dye) primers were purchased from Applied Biosystem gene expression assays. Gene expression for these genes were carried out in 25 µl reactions consisting of 2× TaqMan Universal PCR master mix (AmpliTaq Gold DNA Polymerase, AmpErase UNG, dNTPs, Passive Reference I, and buffer), 1 µl of primer, DNase-free water, and 0.09 µl cDNA. Samples were analyzed on an ABI 7300 Sequence Detection System. Reactions were incubated for 2 min at 50°C and 10 min at 95°C, followed by 40 cycles consisting of a 15-s denaturing step at 95°C and 1-min annealing/extending step at 60°C. Data were analyzed by ABI software using the cycle threshold (CT), which is the cycle number at which the fluorescence emission is midway between detection and saturation of the reaction. The 2−ΔΔ CT method (Livak and Schmittgen, 2001) was used to determine changes in gene expression between treatment groups with the 18s CT as the correction factor.
2.9. Western blotting
Western blot analysis was performed as previously described (White, Baltgalvis, Puppa et al., 2010). Briefly, frozen gastrocnemius muscle was homogenized in Mueller buffer and protein concentration determined by the Bradford method (Bradford, 1976). Crude muscle homogenate 40 µg was fractionated on 8%–10% SDS-polyacrylamide gels. Gels were transferred to PVDF membranes overnight. Membranes were Ponceau stained to verify equal loading of each gel. Membranes were blocked overnight in 5% milk in Tris-buffered saline with 0.1% Tween-20 (TBS-T). Primary antibodies for androgen receptor (AR) (Santa Cruz), pAkt (Ser473), Akt, pGKS3b (Ser9) GSK3b, pmTOR (Ser2448), mTOR, pP70 (Thr 389), P70, p4E-BP1 (Thr 37/46), 4E-BP1, pRaptor (ser792), Raptor, pAMPK (Thr 172), AMPK, pFoxo3 (Ser253), Foxo3, pPRAS40 (Thr246), PRAS40, CoxIV, VDAC and GAPDH (Cell signaling) were diluted 1:1000 to 1:500 in 5% Milk in TBS-T followed by 1 hour incubation with membranes at room temperature. Anti-rabbit IgG horseradish-peroxidase conjugated secondary antibodies (Cell Signaling) were incubated with the membranes at 1:2000 dilutions for 1 hour in 5% milk in TBS-T. Enhanced chemiluminescence (ECL) (GE Healthcare Life Sciences, Piscataway, NJ) was used to visualize the antibody-antigen interactions. Images were digitally scanned and blots were quantified by densitometry using scientific imaging software (Scion Image, Frederick, MD).
2.10. Cell culture
C2C12 myoblasts purchased from American Type Culture Collection (Manassas, VA) were cultured in Dulbecco’s modified Eagle’s medium (DMEM), supplemented with 10% FBS, 50U/ml penicillin and 50µg/ml streptomycin. Upon reaching confluence, myoblast differentiation was induced for 72 h in DMEM supplemented with 2% heat-inactivated horse serum (HIHS), 50U/ml penicillin and 50µg/ml streptomycin. After 72h differentiation, 50 nM testosterone (Sigma, T1500) was added to serum-free DMEM and incubated for 24h. To examine the effects of testosterone withdrawal, an additional set of cells had testosterone withdrawn from the media after the initial 24 hour treatment period and incubated for an additional 24hrs in serum-free DMEM. Cells were harvested by washing with ice-cold PBS and then scraped in ice-cold lysis buffer (50mM Tris, 150mM NaCl, 1mM EDTA, 1% Triton X-100, 0.1% SDS, 0.5% sodium deoxycholate, 5mM NaF, 1 mM β-glycerolphosphate, 1mM NaVO3 and 1/200 protease inhibitor cocktail (Sigma, P8340), pH 8.0). After sonication, cell debris was removed by centrifugation, and the supernatant was stored at −80°C. Protein concentrations were measured by the Bradford assay (Bio-Rad), and the samples were used for Western blot analysis.
2.11. Statistical analysis
A one-way ANOVA was used to determine significance among groups. CSA chi-square analysis was used to detect changes in myofiber cross sectional area distribution. Post-hoc analyses were performed with Student-Newman-Keuls methods. T tests were used to determine differences between two groups. Significance was set at p<0.05.
3. Results
3.1. Body and muscle mass
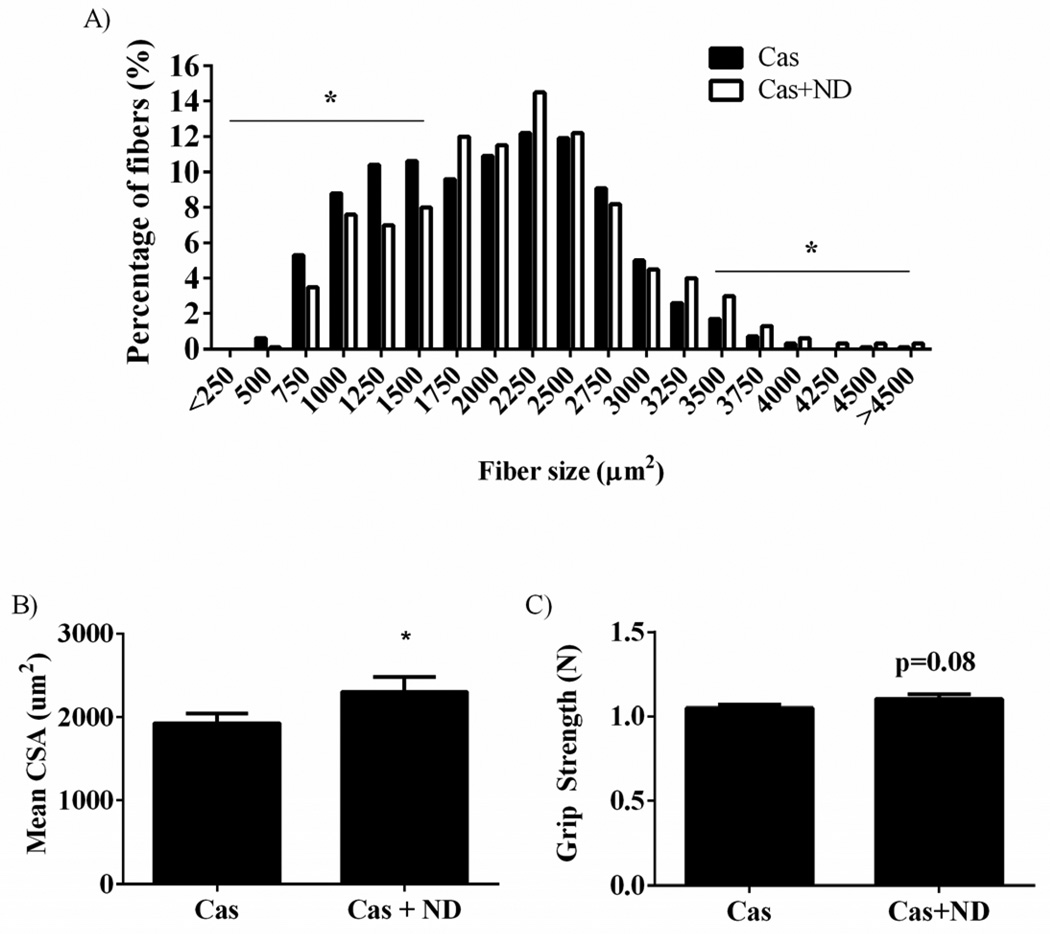
Body weights were measured throughout the study. At the beginning of the study, Sham mice weighed 12% (p= 0.003; Table 1) and 15% (p=0.002) more than the castrated and castrated groups receiving nandrolone decanoate respectively. Throughout the study, Sham mice increased body weight 9% (p = 0.001; Table 1) while castrated mice did not significantly increase body weight. Castrated mice treated with nandrolone decanoate for the final 28 days of the study increased body weight 19% (p < 0.001). Functional testing using forelimb grip strength measurements showed a 5% reduction (p = 0.02; Figure 1D) in castrated mice when compared to sham controls, while nandrolone treatment demonstrated a trend (p = 0.08; Figure 2C) to increase forelimb grip strength.
Table 1.
Body weight, tibia length and muscle mass in Sham operated, Castrated and Castrated mice treated with nandrolone decanoate. Values are means ± SE.
| Body Weight | Body Weight | Tibia | Gastrocnemius | |||
|---|---|---|---|---|---|---|
| Initial | Final | Change | Length (TL) | Weight:BW | ||
| Group | (g) | (g) | (%) | (mm) | (mg/g) | |
| Sham | n=11 | 25.7 ± .6 | 28.3 ± .6 | 10.3 ± 1.7 | 17.6 ± .1 | 5.2 ± 0.16 |
| Castrated | n=11 | 22.5 ± .5* | 23.3 ± .4*# | 3.7 ± 1.1*# | 17.4 ± .2 | 4.8 ± 0.15*# |
| Castrated + ND | n=7 | 22.1 ± .6* | 26.3 ± .6* | 19.4 ± 2.8* | 17.3 ± .1 | 5.3 ± 0.1 |
Signifies different from Sham mice.
Signifies different from castrated mice treated with ND.
ND, nandrolone decanoate.
Figure 1.
Castration decreases muscle cross sectional area, protein synthesis and functional performance in mice. A) Muscle fiber frequency distribution. B) Mean fiber area. C) Myofibrillar rate of protein synthesis. D) Grip strength. Values are means ± SE. Significance was set at p<0.05. *Signifies different from Sham group.
Figure 2.
Nandrolone decanoate administration returns muscle fiber area and functional performance in mice. A) Muscle fiber frequency distribution. B) Mean fiber area. C) Grip strength. Values are means ± SE. Significance was set at p<0.05. *Signifies different from Cas group.
Castration reduced the ratio of gastrocnemius (gastroc) weight normalized to body weight 8% (p = 0.04; Table 1) when compared to the Sham group. Nandrolone decanoate administration increased the ratio of gastroc mass to body weight by 10% (p = 0.01) compared to the castrated mice, returning muscle mass to Sham values. Castration reduced the percentage of large muscle fibers (>3,500µm2) (Figure 1A), increased the percentage of small fibers (<1,500µm2), and decreased mean cross sectional area (CSA) by 11% (p = 0.05; Figure 1B). Nandrolone decanoate administration increased the percentage of large fibers, reduced the percentage of small fibers (Figure 2A), and increased mean CSA by 19% (p = 0.04; Figure 2B) compared to castrated mice.
3.2. Castration reduces muscle Akt/mTORC1 signaling
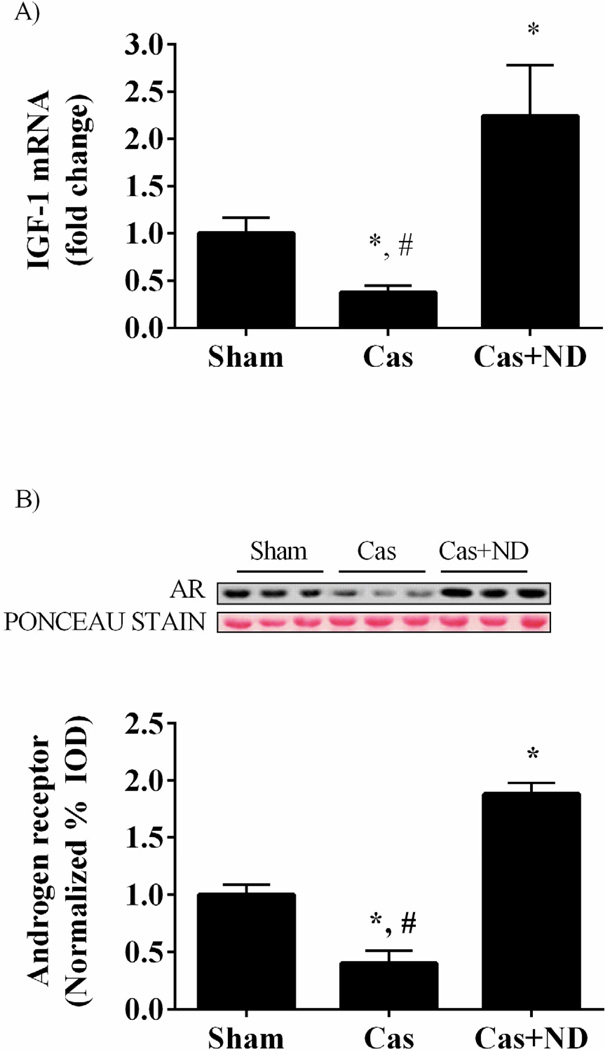
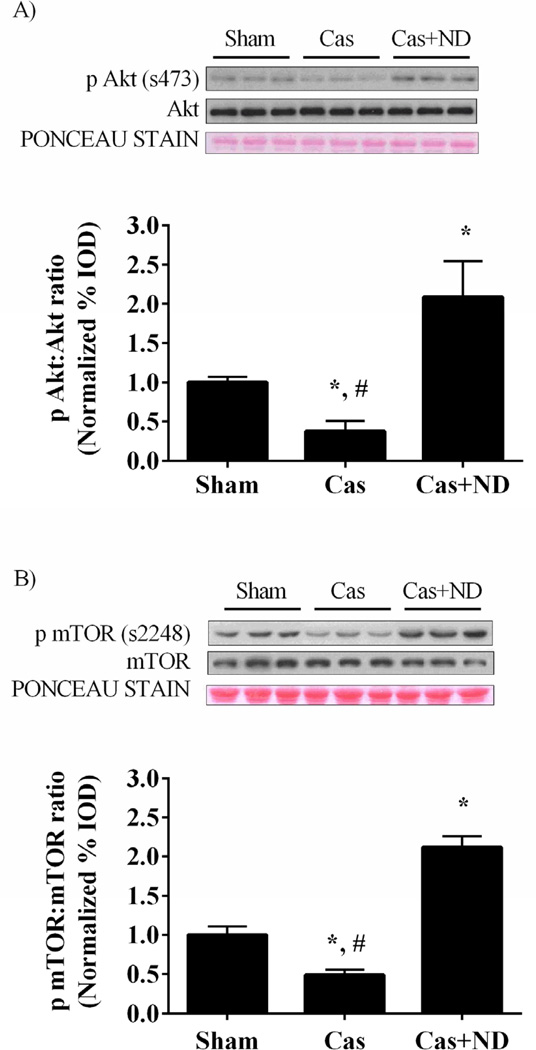
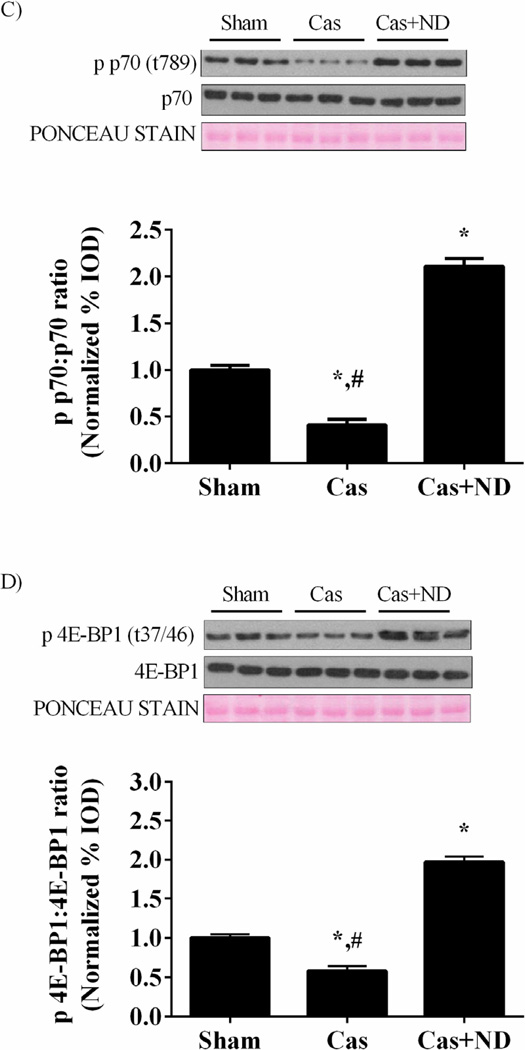
Myofibrillar protein synthesis was reduced 29% (p = 0.001; Figure 1C) by castration, and muscle IGF-1 mRNA expression reduced 60% (p = 0.021; Figure 3A) compared to the sham mice. Castration reduced muscle androgen receptor protein expression 50% (p = 0.011; Figure 3B) when compared to the shams. Nandrolone decanoate administration increased androgen receptor protein expression 2.7 fold when compared to castrated mice and 88% (p = 0.01) compared to the shams. Nandrolone decanoate administration increased muscle IGF-1 mRNA expression by 5 fold (p < 0.001; Figure 3A) compared to castrated mice and 2.4 fold (p = 0.009) compared to sham mice. Akt activation, the ratio of phosphorylated Akt to total Akt, was decreased 60 % by castration (p< .001; Figure 4A) while nandrolone decanoate administration increased Akt activation 4.5 fold (p= 0.004) when compared to castrated mice and 100% compared to the Sham group (p= 0.012; Figure 2A). The ratio of phosphorylated to total mTOR, was reduced approximately 50% (p = 0.02; Figure 4B) by castration. The phosphorylation of mTORC1 target p70Sk6 was reduced 42% (p = 0.007; Figure 4C) and 4E-BP1 reduced 59% (p = 0.01; Figure 4D) compared to sham mice. Nandrolone treatment increased mTOR, p70S6K, and 4E-BP1 phosphorylation levels greater than that in sham mice.
Figure 3.
IGF-1 gene expression and AR protein expression in castrated gastrocnemius muscle. Data are normalized to Sham group. Values are means ± SE. Significance was set at p<0.05. *Signifies difference from Sham group. # Signifies difference from Cas+ND group.
Figure 4.
Akt/mTORC1 signaling in castrated gastrocnemius muscle. A) Upper: representative western blot of phosphorylated and total forms of Akt (Ser 473). Lower: The ratio of phosphorylated and total Akt in the gastrocnemius muscle normalized to the Sham group. B) Upper: representative western blot of phosphorylated and total forms of mTOR (Ser2448). Lower: The ratio of phosphorylated and total mTOR. C) Upper: representative western blot of phosphorylated and total forms of p70S6K (Thr389). Lower: The ratio of phosphorylated and total p70S6K. D) Upper: representative western blot of phosphorylated and total forms of 4E-BP1 (Thr37/46). Lower: The ratio of phosphorylated and total 4E-BP1 normalized to the Sham group. Values are means ± SE. Significance was set at p<0.05. *Signifies difference from Sham group. # Signifies difference from Cas+ND group.
3.3. Castration is associated with muscle mTORC1 inhibition independent of AMPK signaling
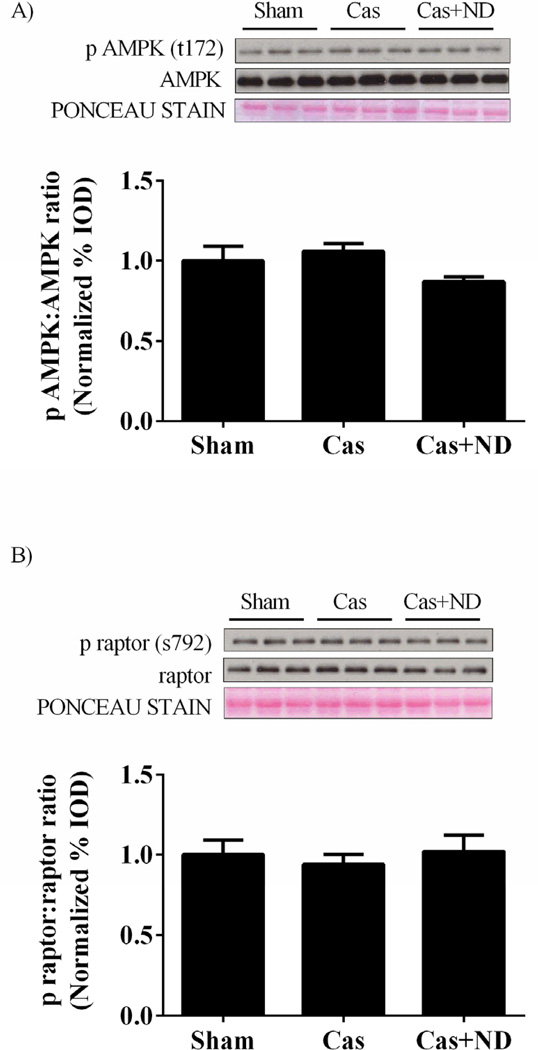
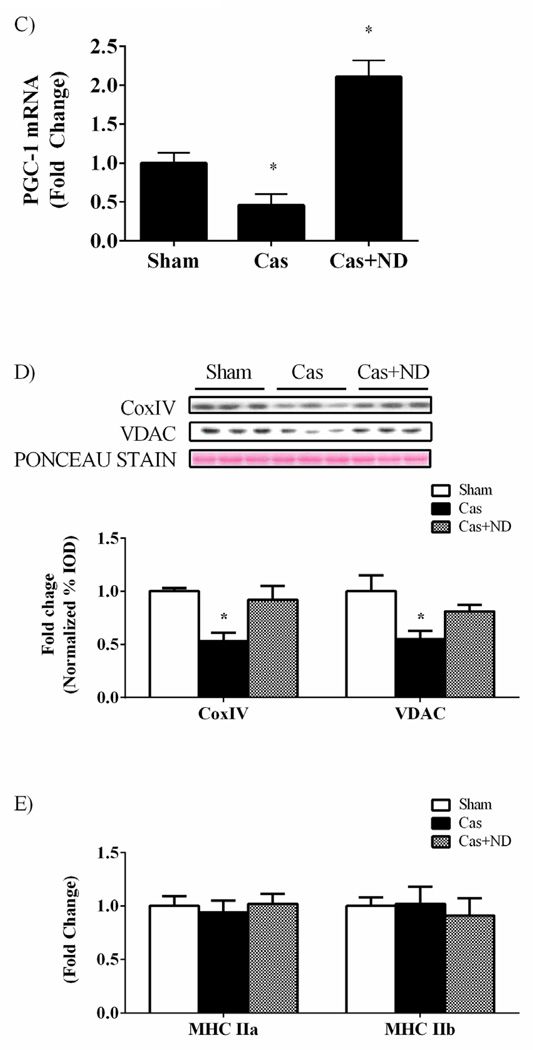
Activation of AMPK inhibits mTORC1 through phosphorylation and subsequent inhibition of raptor. To explore additional points of mTORC1 regulation by castration AMPK and raptor phosphorylation status was investigated. There were no differences in AMPK (Figure 5A), raptor phosphorylation (Figure 5B), or total protein expression of AMPK and raptor. Despite no changes in AMPK activity, PGC-1α mRNA expression was decreased 54% in castrated mice while nandrolone treatment increased PGC-1α mRNA expression roughly 2 fold compared to sham mice (Figure 5C). Oxidative protein expression tracked similar to PGC-1α mRNA expression as Cox IV and voltage dependent anion channel (VDAC) protein expression were decreased 47 and 45% with castration, respectively (Figure 5D). ND returned protein expression of Cox IV and VDAC back to sham values (Figure 5D). There were no differences in myosin heavy chain (MHC) IIa or IIb mRNA expression with castration or castration with ND administration compared to sham mice (Figure 5E).
Figure 5.
Castration does not change muscle AMPK signaling while PGC-1α mRNA expression and oxidative protein expression altered. A) Upper: representative western blot of phosphorylated AMPK (Thr172) and total AMPK in the gastrocnemius. Lower: The ratio of phosphorylated to total forms of AMPK in the gastrocnemius muscle. B) Upper: representative western blot of phosphorylated raptor (Ser792) and total raptor in the gastrocnemius. Lower: The ratio of phosphorylated to total forms of raptor in the gastrocnemius muscle. C) PGC-1α mRNA expression. D) Upper: representative western blot of CoxIV and VDAC proteins in the gastrocnemius. Lower: Quantification of CoxIV and VDAC protein expression in the gastrocnemius muscle. E) MHC IIa and IIb mRNA expression. Values are means ± SE. Significance was set at p<0.05.
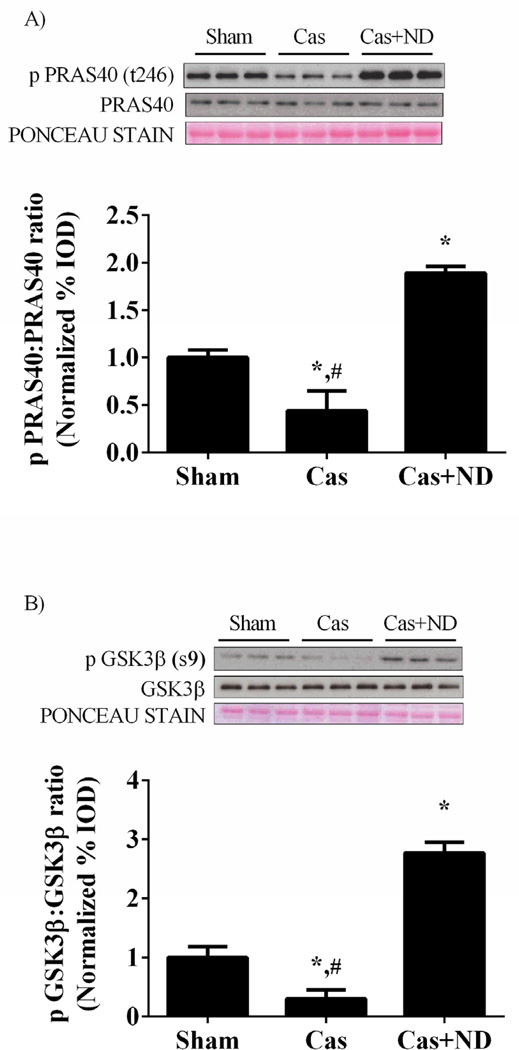
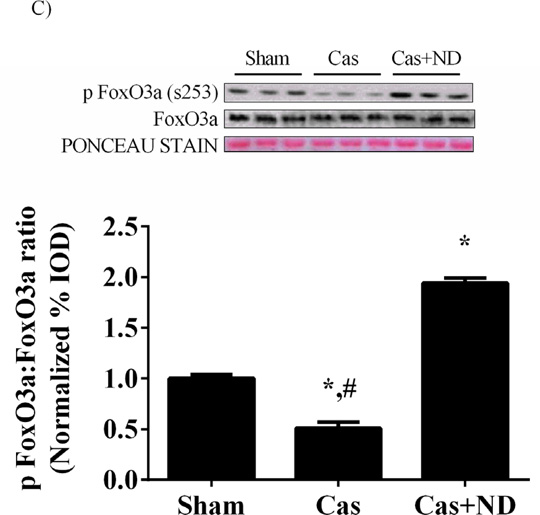
Castration reduced the ratio of phosphorylation to total PRAS40, an inhibitor of mTORC1 complex, by 56% (p = 0.04; Figure 6A) and reduced the phospho:total ratio of GSK3β by 92% (p<.001; Figure 6B) compared to sham mice. Nandrolone administration increased the ratio of PRAS40 and GSK3β in castrated mice above sham values. Akt can also regulate muscle protein degradation through inhibition of FoxO3a by phosphorylation at Ser 253. The phopho:total ratio of FoxO3a protein was reduced roughly 50% (p=.001; Figure 6C) in castrated mice. Nandrolone decanoate administration increased the ratio roughly two fold above sham values.
Figure 6.
Phosphorylation status of Akt targets PRAS40, GSK3β and FoxO3a are altered with castration. A) Upper: representative western blot of phosphorylated PRAS40 (Thr246) and total PRAS40 in the gastrocnemius. Lower: The ratio of phosphorylated to total forms of PRAS40 in the gastrocnemius muscle. B) Upper: representative western blot of phosphorylated GSK3β (Ser9) and total GSK3β in the gastrocnemius. Lower: The ratio of phosphorylated to total forms of GSK3β in the gastrocnemius muscle. C) Upper: representative western blot of phosphorylated FoxO3a (Ser253) and total FoxO3a. Lower: The ratio of phosphorylated to total forms of FoxO3a. Values are means ± SE. Significance was set at p<0.05. *Signifies difference from Sham group. # Signifies difference from Cas+ND group.
3.4. FoxO3a transcriptional targets increase with androgen withdrawal
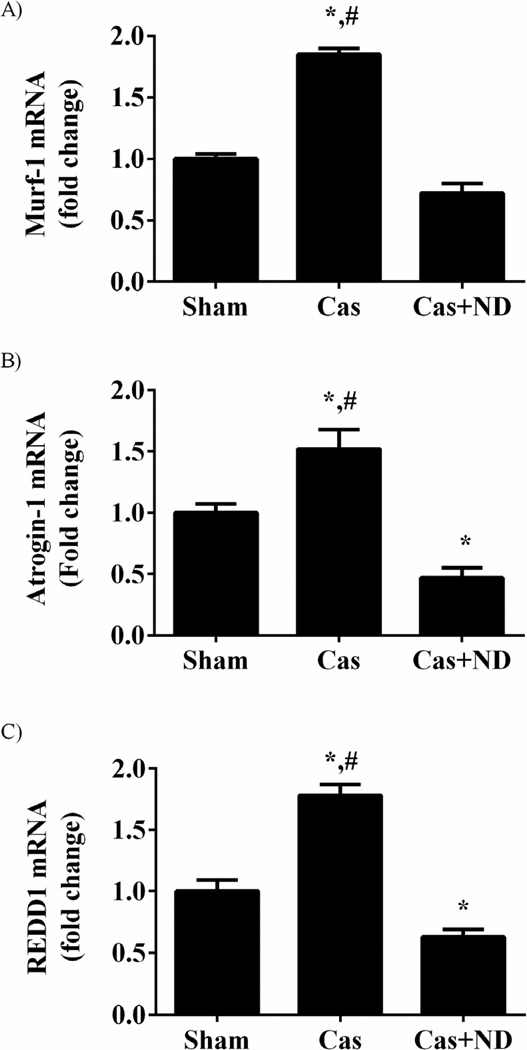
Gene expression was measured for FoxO transcriptional targets atrogin1, MuRF1 and REDD1 (Figure 7). Castration increased MuRF1 mRNA 85% (p= 0.001; Figure 7A), Atrogin-1/MAFbx mRNA 70% (p = 0.02; Figure 7B), and REDD1 mRNA 78% (p = 0.001; Figure 7C). Nandrolone decanoate administration to castrated mice reduced MuRF1 mRNA expression by 60% (p < 0.001), atrogin-1 gene expression by 69% (p <0.001), and REDD1 expression by 37% (p = 0.03).
Figure 7.
FoxO transcriptional targets atrogin-1, MuRF1 and REDD1 are increased with castration. A) MuRF1mRNA expression. B) Atrogin-1 mRNA expression C) REDD1 mRNA expression. Data are normalized to the Sham. Values are means ± SE. Significance was set at p<0.05. *Signifies difference from Sham group. # Signifies difference from Cas+ND group.
3.5. Testosterone treatment to C2C12 myoblasts increases Akt/mTORC1 activation and represses FoxO3a
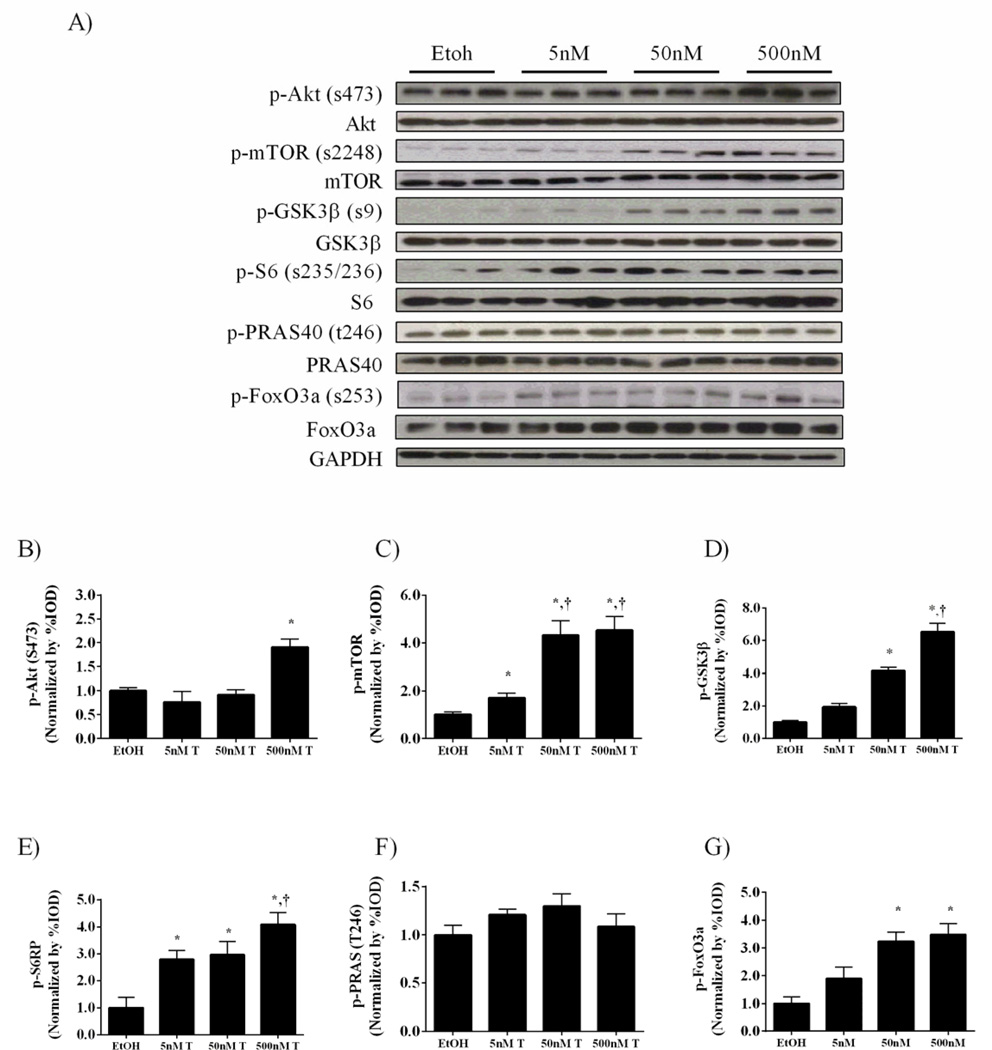
Akt/mTORC1 signaling in C2C12 myoblasts was measured with incremental concentrations of testosterone. C2C12 myotubes were treated with 5, 50 and 500nM testosterone for 24 hours. Our results demonstrate that the phosphorylation of mTOR and downstream mTOR target S6 ribosomal protein are extremely sensitive to testosterone, being induced with as low as 5nM of testosterone, and independent of Akt activation (Figure 8A, B, C, E). A high concentration (500nM) of testosterone was required to induce Akt phosphorylation in C2C12 myotubes, while Akt targets GSK3β and FoxO3a were phosphorylated at lower concentration (50 nM) (Figure A,D,G). Interestingly, no concentration of testosterone altered PRAS40 phosphorylation, which was reduced by testosterone loss in vivo (Figure 8A, F).
Figure 8.
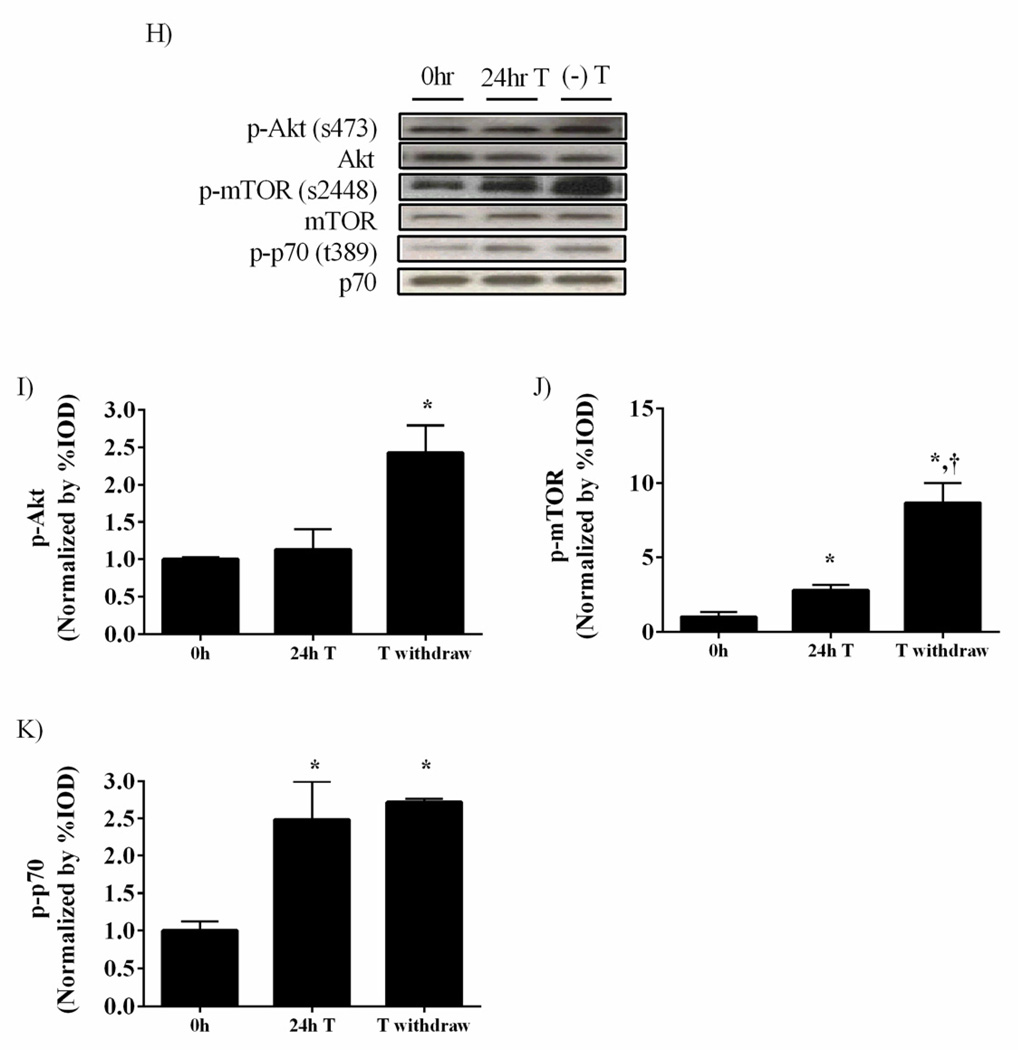
Testosterone administration increases mTORC1 signaling in C2C12 myoblasts. C2C12 myoblasts were treated with 5, 50 and 500nM testosterone for 24 hours. A) Representative western blot of phosphorylated and total forms of Akt (Ser 473), mTOR (Ser2448), GSK3β (Ser9), S6 ribosomal protein (Ser235/236), PRAS40 (t246) and FoxO3a (Ser253) with varying doses of testosterone. Protein expression of phosphorylated forms of B) Akt, C) mTOR, D) GSK3β, E) S6, F) PRAS40 and G) FoxO3a . H) Representative western blot of phosphorylated and total forms of Akt (Ser 473), mTOR (Ser2448) and p70S6K (t389) during 50 nM testosterone treatment followed by 24 hours of testosterone withdrawal. Protein expression of phosphorylated forms of I) Akt, J) mTOR and K) p70S6K normalized to the Etoh vehicle control. Values are means ± SE. Significance was set at p<0.05. *Signifies difference from Etoh vehicle/0hr group. † Significant from cells treated with 50nM testosterone/24hr T group.
To examine acute androgen withdrawal C2C12 cells were stimulated with 50 nM testosterone for 24h and then placed in testosterone free media for an additional 24h (Figure 8H–K). Testosterone stimulation for 24h induced mTOR and p70 phosphorylation, while having no effect on Akt phosphorylation. Interestingly, removal of testosterone for 24h was sufficient to amplify both mTOR and Akt phosphorylation, demonstrating the potential for a testosterone initiated positive feedback mechanism to amplify Akt/mTOR signaling in cultured myotubes.
4. Discussion
Androgen signaling as it relates to the anabolic growth of skeletal muscle has been extensively studied (Urban, 2011). When examining the cellular basis of overload induced skeletal muscle hypertrophy and disuse-induced muscle atrophy it is clear that mechanisms inciting muscle mass loss are not simply the reversal of growth signaling. Thus, muscle-wasting mechanisms induced by testosterone loss deserve further examination. Additionally, the clinical significance of hypogonadism, which is associated with several wasting conditions, has placed attention on advancing our understanding of the sensitivity of anabolic and catabolic muscle signaling to decreased androgen levels. Patients suffering from wasting diseases can exhibit a range of suppressed circulating testosterone levels (Tajar, Huhtaniemi, O'Neill et al., 2012). In this current study we demonstrate that the decreased muscle mass that accompanies castration-induced androgen withdrawal coincides with suppressed myofibrillar protein synthesis, and down regulation of Akt/mTORC1 signaling. We also provide evidence that mTORC1 inhibitor REDD1, a FoxO transcription target, is induced and corresponds with a reduction in FoxO3a phosphorylation and increase in FoxO targets atrogin1/MAFbx and MuRF1. All of these effects were readily reversible by administration of the testosterone analogue nandrolone decanoate. In addition, we present the novel finding that androgen withdrawal increases mTORC1 inhibitor PRAS40 activation without any detectable change in AMPK-dependent raptor phosphorylation. Furthermore, using C2C12 myotubes we demonstrate that testosterone activation of mTOR can occur independent of Akt activation, and in myotubes testosterone can acutely induce a positive feedback mechanism which amplifies mTOR and Akt activation even in the absence of testosterone.
The IGF-1/Akt signaling pathway is an acknowledged regulator of skeletal muscle mass (Glass, 2005), and increased muscle IGF-1 expression is thought to mediate, in part, the anabolic effects of androgens (Solomon and Bouloux, 2006). Our study is in agreement with others demonstrating that castration can decrease muscle IGF-1 mRNA expression (Mateescu and Thonney, 2005), and is increased by androgen administration (Oner et al., 2008). The canonical Akt signaling pathway activates the mTORC1 complex, and downstream targets p70S6K and 4E-BP1 to initiate translation. While we report that castration reduced activation of the Akt/mTORC1 pathway in the gastrocnemius and androgen administration reversed this effect, published studies are not consistent related to androgen availability and the activation of this pathway. Castration has been previously shown to decrease Akt and p70 phosphorylation in muscle (Ibebunjo et al., 2011), and Yin et al (Yin et al., 2009) observed an increase in Akt activity with 13 days of testosterone administration to female rats. In contrast, Hourde et al (Hourde et al., 2008) found that rats castrated for 3 months had no changes in Akt activity or other know downstream targets of the Akt pathway in the soleus, even when androgen was administered to the castrated rats. Furthermore, 14 days of castration has been shown to increase Akt phosphorylation in the gastrocnemius (Haren et al., 2011). Testosterone treatment on L6 myotubes increased mTOR and p70 phosphorylation but failed to increase Akt activation (Wu et al., 2010). Our current data is consistent with these data as we show mTOR and downstream targets are activated with testosterone treatment to C2C12 myotubes. However, we show testosterone can activate Akt at higher concentrations. The discrepancy could be due to the differences in testosterone dosages, since Wu at al. (Wu et al., 2010) dosed 100nM testosterone on myotubes, which may not be sufficient to activate Akt. Additionally, we report amplified Akt/mTORC1 activation in C2C12 myotubes after testosterone was withdrawn from media, which is consistent with the maintenance of mTORC1 signaling upon testosterone withdrawal in L6 myoblasts (Wu et al., 2010). Taken together, testosterone can activate Akt/mTORC1 signaling in vivo and in vitro, which supports a role for this signaling pathway during androgen induced muscle protein accretion.
Akt signaling can also regulate anabolism of the muscle through the phosphorylation of GSK3β and PRAS40. PRAS40 is a negative regulator of the mTORC1 complex through binding to the mTOR/raptor complex, inhibiting subsequent binding of mTOR to downstream targets the ribosomal protein S6 kinase (S6K1) and 4EBP1 (Sancak et al., 2007). Hypophosphorylation, or activation of PRAS40 has been reported under conditions of ER stress (Deldicque, Bertrand, Patton et al., 2011) and sepsis (Kazi, Pruznak, Frost et al., 2011) where muscle protein synthesis is reduced. To our knowledge, we are the first to report a reduction in muscle PRAS40 phosphorylation on the Akt specific Thr286 during androgen withdrawal. GSK3β is an active suppressor of protein synthesis in muscle until phosphorylated and inactivated by Akt (Rommel, Bodine, Clarke et al., 2001). We have previously established that muscle GSK3β phosphorylation increases when castrated mice are treated with nandrolone decanoate (White et al., 2009), and the current study confirms and extends these findings by demonstrating that GSK3β phosphorylation is reduced by androgen withdrawal. In corroboration with our data, Yin et al (Yin et al., 2009) showed testosterone treatment to female rats increased phosphorylation of GSK3β associated with muscle hypertrophy in the gastrocnemius muscle. A reduction in Akt activation has multiple mechanisms to inhibit muscle protein accretion during androgen withdrawal.
Skeletal muscle protein synthesis regulation is closely aligned with systemic and cellular energy status. Insulin and other glucoregulatory hormones have well-established functions in the regulation of skeletal muscle anabolic and catabolic processes. Muscle also has important intracellular signaling sensitive to the energy status of the myofiber, and AMPK has a critical regulatory role in muscle related to energy status (Hardie, 2011). Activation of AMPK is associated with a decrease in the cellular AMP/ATP ratio, and this activation serves to increase glucose uptake, activate glucose metabolism, and stimulate mitochondria biogenesis, in part through PGC-1α (Scarpulla, 2011). AMPK activation also can repress energy consuming processes, such as protein synthesis. AMPK activation can directly inhibit mTOR activity, in part by phosphorylating raptor and preventing the mTORC1 complex from recruiting downstream targets p70S6K and 4E-BP1 (Gwinn et al., 2008). Our current study demonstrates that AMPK phosphorylation is not associated with androgen withdrawal induced muscle loss. In contrast, mRNA expression of PGC-1α, a known downstream target of AMPK and oxidative protein expression were reduced during castration and return with ND treatment. The changes in oxidative protein expression were independent of fiber type related to myosin expression. These data are consistent with reports demonstrating a reduction in PGC-1α during androgen withdrawal without changes in myosin heavy chain expression (Ibebunjo et al., 2011). Furthermore, the loss in muscle oxidative capacity during androgen withdrawal appears to be an AMPK-independent mechanism.
We have recently reported that AMPK activation is increased in wasting skeletal muscle related to cancer cachexia (White, Baynes, Welle et al., 2011). This activation coincides with Akt independent suppression of myofibrillar protein synthesis and mTOR activity. Separate from energy status, AMPK can also be activated by circulating inflammatory cytokines, such as IL-6, which can negatively impact skeletal muscle mass (Kelly, Gauthier, Saha et al., 2009). Furthermore, we have found in a mouse model of cancer cachexia that attenuated IL-6 signaling reduces AMPK activation without altering suppressed myofibrillar protein synthesis (White et al., 2011). Our novel finding that castration does not affect AMPK or raptor phosphorylation provides support that, unlike some muscle wasting conditions, testosterone loss is not causing nutrient stress in the atrophying muscle. This also provides rationale for further examination of the complex regulatory implications for muscle mass maintenance in patients with the combination of low circulating testosterone levels, high chronic inflammation and muscle nutrient stress.
The FoxO family of transcription factors also regulate skeletal muscle protein turnover through the IGF-1/Akt axis. FoxO transcription factors have been shown to play a role in various conditions of muscle atrophy including cancer cachexia (White et al., 2011), denervation (Bertaggia, Coletto and Sandri, 2011) and glucocorticoid treatment (Zheng, Ohkawa, Li et al., 2010). Atrogin1/MAFbx, MuRF1 and REDD1 are known transcriptional targets of FoxO which negatively regulate muscle mass. Here we show phosphorylation of FoxO3a is decreased by castration while expression of atrogin1/MAFbx, MuRF1 and REDD1 are increased. Nandrolone treatment to castrated mice increased phosphorylation of FoxO3a and reduced the expression of its transcriptional targets. Castration has previously shown to increase phosphorylated FoxO3a after 14 days of castration (Haren et al., 2011). The discrepancy in findings may be related to the length of the castration treatment, since the gastrocnemius muscle had not atrophied after 14 days of castration. We also showed FoxO3a phosphorylation to be increased with testosterone administration to C2C12 cells. Zhao et al (Zhao, Pan, Wang et al., 2008) showed no change in FoxO phosphorylation after testosterone administration to C2C12 myotubes however, that experiment treated myotubes for 6 hours compared to our 24-hour period. The relationship of REDD1 and testosterone signaling in skeletal muscle has not been well examined. REDD1 has been shown to be a direct target of testosterone in preventing dexamethasone-induced muscle atrophy (Wu et al., 2010). In addition, nandrolone decreases REDD2 expression in denervated muscle (Qin et al., 2010). However, this is the first study to report increased REDD1 expression with castration and serves as additional evidence that FoxO regulation of castration-induced muscle atrophy. Atrogin1/MAFbx and MuRF1 expression has been shown to increase with castration in the androgen sensitive levator ani muscle (Pires-Oliveira et al., 2010, Jones, Hwang, Narayanan et al., 2010) and triceps brachii muscles (Ibebunjo et al., 2011). However, the length of time a muscle undergoes androgen withdrawal appears to influence the expression of atrogenes. After 11 weeks of castration atrogin1/MAFbx and MuRF1 expression have been reported to be decreased in mouse gastrocnemius muscle (Jiao, Pruznak, Huber et al., 2009). When examining atrogin1/MAFbx and MuRF1 expression over several weeks of castration there is an induction in atrogene expression initially after castration, followed by a gradual reduction in expression (Pires-Oliveira et al., 2010). Further work is needed to determine the mechanisms by which long-term androgen withdrawal could establish stable myofibrillar protein levels and if FoxO regulation is important for achieving this homeostatic balance.
In conclusion, varying lengths of androgen withdrawal have resulted in a reduction in muscle mass (Antonio et al., 1999, Axell et al., 2006) while testosterone administration has been previously shown to increase the rate of body weight gain and muscle mass in castrated mice (Antonio et al., 1999, Axell et al., 2006, Oner et al., 2008, Rowe, 1968). We found that nandrolone decanoate administration to castrated mice markedly increased body weight gain throughout the experiment and rescues the loss in muscle mass. We demonstrate that castration-induced androgen withdrawal induces muscle mass loss through the suppression of myofibrillar protein synthesis and is associated with suppressed Akt/mTOR activation. There was also subsequent activation of atrophy related pathways through PRAS40, and GSK3β. This suppression of mTOR was independent of AMPK signaling. The FoxO transcriptional targets atrogin1/MAFbx, MuRF1 and REDD1 were induced by androgen withdrawal. Androgen administration was able to reverse all of these changes in the gastrocnemius muscle. In cultured myotubes high concentrations of testosterone acutely activate Akt , while low concentrations of testosterone can activate mTOR signaling independent of Akt. Interestingly, in cultured myotubes mTOR and Akt signaling were amplified by a low concentration of testosterone 24h after testosterone withdrawal, demonstrating the potential for a testosterone initiated positive feedback mechanism to amplify Akt/mTOR signaling cultured myotubes. However, further work is needed to determine if this affect occurs in vivo. These data show castration-induced atrophy can be linked to both the induction of atrophy related signaling and suppression of growth-related signaling pathways, and these changes are readily reversible in the short-term. Further study is needed to determine the clinically significant reduction in circulating testosterone that can appreciably impact muscle Akt/mTOR signaling. This will also allow for a better understanding of the physiological ramifications of testosterone dosage on the control of skeletal muscle protein turnover.
Testosterone loss suppresses myofibrillar protein synthesis and Akt/mTOR signaling
Suppression of mTORC1 is independent of AMPK activation and Raptor phosphorylation.
Testosterone loss activates muscle FoxO3a and its transcriptional targets.
Androgen administration restores Akt/mTORC1/FoxO3a signaling in castrated mice.
In C2C12 myotubes, testosterone can increase mTORC1 independent of Akt activation.
24hr T withdrawal amplifies the activation of Akt/mTORC1 after acute T stimulation
Acknowledgements
The authors would like to thank Dr. Tyrone Washington or his technical assistance. Funding for this project was supported by grants NIH/NCI 1 RO1 CA121249-01 awarded to Dr. James Carson.
Footnotes
Publisher's Disclaimer: This is a PDF file of an unedited manuscript that has been accepted for publication. As a service to our customers we are providing this early version of the manuscript. The manuscript will undergo copyediting, typesetting, and review of the resulting proof before it is published in its final citable form. Please note that during the production process errors may be discovered which could affect the content, and all legal disclaimers that apply to the journal pertain.
References
- 1.Katznelson L, Finkelstein JS, Schoenfeld DA, Rosenthal DI, Anderson EJ, Klibanski A. Increase in bone density and lean body mass during testosterone administration in men with acquired hypogonadism. J Clin Endocrinol Metab. 1996;81:4358–4365. doi: 10.1210/jcem.81.12.8954042. [DOI] [PubMed] [Google Scholar]
- 2.Bhasin S, Storer TW, Berman N, Yarasheski KE, Clevenger B, Phillips J, Lee WP, Bunnell TJ, Casaburi R. Testosterone replacement increases fat-free mass and muscle size in hypogonadal men. J Clin Endocrinol Metab. 1997;82:407–413. doi: 10.1210/jcem.82.2.3733. [DOI] [PubMed] [Google Scholar]
- 3.Brodsky IG, Balagopal P, Nair KS. Effects of testosterone replacement on muscle mass and muscle protein synthesis in hypogonadal men--a clinical research center study. J Clin Endocrinol Metab. 1996;81:3469–3475. doi: 10.1210/jcem.81.10.8855787. [DOI] [PubMed] [Google Scholar]
- 4.Dobs AS, Dempsey MA, Ladenson PW, Polk BF. Endocrine disorders in men infected with human immunodeficiency virus. Am J Med. 1988;84:611–616. doi: 10.1016/0002-9343(88)90144-1. [DOI] [PubMed] [Google Scholar]
- 5.Johansen KL. Testosterone metabolism and replacement therapy in patients with end-stage renal disease. Semin Dial. 2004;17:202–208. doi: 10.1111/j.0894-0959.2004.17307.x. [DOI] [PubMed] [Google Scholar]
- 6.Van Vliet M, Spruit MA, Verleden G, Kasran A, Van Herck E, Pitta F, Bouillon R, Decramer M. Hypogonadism, quadriceps weakness, and exercise intolerance in chronic obstructive pulmonary disease. Am J Respir Crit Care Med. 2005;172:1105–1111. doi: 10.1164/rccm.200501-114OC. [DOI] [PubMed] [Google Scholar]
- 7.Vigano A, Piccioni M, Trutschnigg B, Hornby L, Chaudhury P, Kilgour R. Male hypogonadism associated with advanced cancer: a systematic review. Lancet Oncol. 2010;11:679–684. doi: 10.1016/S1470-2045(10)70021-8. [DOI] [PubMed] [Google Scholar]
- 8.Dhindsa S, Prabhakar S, Sethi M, Bandyopadhyay A, Chaudhuri A, Dandona P. Frequent occurrence of hypogonadotropic hypogonadism in type 2 diabetes. J Clin Endocrinol Metab. 2004;89:5462–5468. doi: 10.1210/jc.2004-0804. [DOI] [PubMed] [Google Scholar]
- 9.Bhasin S, Storer TW, Javanbakht M, Berman N, Yarasheski KE, Phillips J, Dike M, Sinha-Hikim I, Shen R, Hays RD, Beall G. Testosterone replacement and resistance exercise in HIV-infected men with weight loss and low testosterone levels. Jama. 2000;283:763–770. doi: 10.1001/jama.283.6.763. [DOI] [PMC free article] [PubMed] [Google Scholar]
- 10.Snyder PJ, Peachey H, Hannoush P, Berlin JA, Loh L, Holmes JH, Dlewati A, Staley J, Santanna J, Kapoor SC, Attie MF, Haddad JG, Jr, Strom BL. Effect of testosterone treatment on bone mineral density in men over 65 years of age. J Clin Endocrinol Metab. 1999;84:1966–1972. doi: 10.1210/jcem.84.6.5741. [DOI] [PubMed] [Google Scholar]
- 11.Kenny AM, Prestwood KM, Gruman CA, Marcello KM, Raisz LG. Effects of transdermal testosterone on bone and muscle in older men with low bioavailable testosterone levels. J Gerontol A Biol Sci Med Sci. 2001;56:M266–M272. doi: 10.1093/gerona/56.5.m266. [DOI] [PubMed] [Google Scholar]
- 12.Morley JE, Perry HM, 3rd, Kaiser FE, Kraenzle D, Jensen J, Houston K, Mattammal M, Perry HM., Jr Effects of testosterone replacement therapy in old hypogonadal males: a preliminary study. J Am Geriatr Soc. 1993;41:149–152. doi: 10.1111/j.1532-5415.1993.tb02049.x. [DOI] [PubMed] [Google Scholar]
- 13.Tenover JS. Effects of testosterone supplementation in the aging male. J Clin Endocrinol Metab. 1992;75:1092–1098. doi: 10.1210/jcem.75.4.1400877. [DOI] [PubMed] [Google Scholar]
- 14.Bhasin S, Storer TW, Asbel-Sethi N, Kilbourne A, Hays R, Sinha-Hikim I, Shen R, Arver S, Beall G. Effects of testosterone replacement with a nongenital, transdermal system, Androderm, in human immunodeficiency virus-infected men with low testosterone levels. J Clin Endocrinol Metab. 1998;83:3155–3162. doi: 10.1210/jcem.83.9.5079. [DOI] [PubMed] [Google Scholar]
- 15.Rogozkin V. Metabolic effects of anabolic steroid on skeletal muscle. Med Sci Sports. 1979;11:160–163. [PubMed] [Google Scholar]
- 16.Antonio J, Wilson JD, George FW. Effects of castration and androgen treatment on androgen-receptor levels in rat skeletal muscles. J Appl Physiol. 1999;87:2016–2019. doi: 10.1152/jappl.1999.87.6.2016. [DOI] [PubMed] [Google Scholar]
- 17.Axell AM, MacLean HE, Plant DR, Harcourt LJ, Davis JA, Jimenez M, Handelsman DJ, Lynch GS, Zajac JD. Continuous testosterone administration prevents skeletal muscle atrophy and enhances resistance to fatigue in orchidectomized male mice. Am J Physiol Endocrinol Metab. 2006;291:E506–E516. doi: 10.1152/ajpendo.00058.2006. [DOI] [PubMed] [Google Scholar]
- 18.Oner J, Oner H, Sahin Z, Demir R, Ustunel I. Melatonin is as effective as testosterone in the prevention of soleus muscle atrophy induced by castration in rats. Anat Rec (Hoboken) 2008;291:448–455. doi: 10.1002/ar.20659. [DOI] [PubMed] [Google Scholar]
- 19.Frost RA, Lang CH. Protein Kinase B/ Akt: A Nexus of Growth Factor and Cytokine Signaling in Determining Muscle Mass. J Appl Physiol. 2007 doi: 10.1152/japplphysiol.00089.2007. [DOI] [PubMed] [Google Scholar]
- 20.Grinspoon S, Corcoran C, Lee K, Burrows B, Hubbard J, Katznelson L, Walsh M, Guccione A, Cannan J, Heller H, Basgoz N, Klibanski A. Loss of lean body and muscle mass correlates with androgen levels in hypogonadal men with acquired immunodeficiency syndrome and wasting. J Clin Endocrinol Metab. 1996;81:4051–4058. doi: 10.1210/jcem.81.11.8923860. [DOI] [PubMed] [Google Scholar]
- 21.Mauras N, Hayes V, Welch S, Rini A, Helgeson K, Dokler M, Veldhuis JD, Urban RJ. Testosterone deficiency in young men: marked alterations in whole body protein kinetics, strength, and adiposity. J Clin Endocrinol Metab. 1998;83:1886–1892. doi: 10.1210/jcem.83.6.4892. [DOI] [PubMed] [Google Scholar]
- 22.Yin HN, Chai JK, Yu YM, Shen CA, Wu YQ, Yao YM, Liu H, Liang LM, Tompkins RG, Sheng ZY. Regulation of signaling pathways downstream of IGF-I/insulin by androgen in skeletal muscle of glucocorticoid-treated rats. J Trauma. 2009;66:1083–1090. doi: 10.1097/TA.0b013e31817e7420. [DOI] [PMC free article] [PubMed] [Google Scholar]
- 23.Ibebunjo C, Eash JK, Li C, Ma Q, Glass DJ. Voluntary running, skeletal muscle gene expression, and signaling inversely regulated by orchidectomy and testosterone replacement. Am J Physiol Endocrinol Metab. 2011;300:E327–E340. doi: 10.1152/ajpendo.00402.2010. [DOI] [PubMed] [Google Scholar]
- 24.Haren MT, Siddiqui AM, Armbrecht HJ, Kevorkian RT, Kim MJ, Haas MJ, Mazza A, Kumar VB, Green M, Banks WA, Morley JE. Testosterone modulates gene expression pathways regulating nutrient accumulation, glucose metabolism and protein turnover in mouse skeletal muscle. Int J Androl. 2011;34:55–68. doi: 10.1111/j.1365-2605.2010.01061.x. [DOI] [PubMed] [Google Scholar]
- 25.Hourde C, Jagerschmidt C, Clement-Lacroix P, Vignaud A, Ammann P, Butler-Browne GS, Ferry A. Androgen replacement therapy improves function in male rat muscles independently of hypertrophy and activation of Akt/mTOR pathway. Acta Physiol (Oxf) 2008 doi: 10.1111/j.1748-1716.2008.01902.x. [DOI] [PubMed] [Google Scholar]
- 26.Potier M, Darcel N, Tome D. Protein, amino acids and the control of food intake. Curr Opin Clin Nutr Metab Care. 2009;12:54–58. doi: 10.1097/MCO.0b013e32831b9e01. [DOI] [PubMed] [Google Scholar]
- 27.Sarbassov DD, Ali SM, Sabatini DM. Growing roles for the mTOR pathway. Curr Opin Cell Biol. 2005;17:596–603. doi: 10.1016/j.ceb.2005.09.009. [DOI] [PubMed] [Google Scholar]
- 28.Wu Y, Bauman WA, Blitzer RD, Cardozo C. Testosterone-induced hypertrophy of L6 myoblasts is dependent upon Erk and mTOR. Biochem Biophys Res Commun. 2010;400:679–683. doi: 10.1016/j.bbrc.2010.08.127. [DOI] [PubMed] [Google Scholar]
- 29.Inoki K, Zhu T, Guan KL. TSC2 mediates cellular energy response to control cell growth and survival. Cell. 2003;115:577–590. doi: 10.1016/s0092-8674(03)00929-2. [DOI] [PubMed] [Google Scholar]
- 30.Vander Haar E, Lee SI, Bandhakavi S, Griffin TJ, Kim DH. Insulin signalling to mTOR mediated by the Akt/PKB substrate PRAS40. Nat Cell Biol. 2007;9:316–323. doi: 10.1038/ncb1547. [DOI] [PubMed] [Google Scholar]
- 31.Sancak Y, Thoreen CC, Peterson TR, Lindquist RA, Kang SA, Spooner E, Carr SA, Sabatini DM. PRAS40 is an insulin-regulated inhibitor of the mTORC1 protein kinase. Mol Cell. 2007;25:903–915. doi: 10.1016/j.molcel.2007.03.003. [DOI] [PubMed] [Google Scholar]
- 32.Bolster DR, Crozier SJ, Kimball SR, Jefferson LS. AMP-activated protein kinase suppresses protein synthesis in rat skeletal muscle through down-regulated mammalian target of rapamycin (mTOR) signaling. J Biol Chem. 2002;277:23977–23980. doi: 10.1074/jbc.C200171200. [DOI] [PubMed] [Google Scholar]
- 33.Horman S, Browne G, Krause U, Patel J, Vertommen D, Bertrand L, Lavoinne A, Hue L, Proud C, Rider M. Activation of AMP-activated protein kinase leads to the phosphorylation of elongation factor 2 and an inhibition of protein synthesis. Curr Biol. 2002;12:1419–1423. doi: 10.1016/s0960-9822(02)01077-1. [DOI] [PubMed] [Google Scholar]
- 34.Chan AY, Soltys CL, Young ME, Proud CG, Dyck JR. Activation of AMP-activated protein kinase inhibits protein synthesis associated with hypertrophy in the cardiac myocyte. J Biol Chem. 2004;279:32771–32779. doi: 10.1074/jbc.M403528200. [DOI] [PubMed] [Google Scholar]
- 35.Gwinn DM, Shackelford DB, Egan DF, Mihaylova MM, Mery A, Vasquez DS, Turk BE, Shaw RJ. AMPK phosphorylation of raptor mediates a metabolic checkpoint. Mol Cell. 2008;30:214–226. doi: 10.1016/j.molcel.2008.03.003. [DOI] [PMC free article] [PubMed] [Google Scholar]
- 36.Williamson DL, Bolster DR, Kimball SR, Jefferson LS. Time course changes in signaling pathways and protein synthesis in C2C12 myotubes following AMPK activation by AICAR. Am J Physiol Endocrinol Metab. 2006;291:E80–E89. doi: 10.1152/ajpendo.00566.2005. [DOI] [PubMed] [Google Scholar]
- 37.Lecker SH, Jagoe RT, Gilbert A, Gomes M, Baracos V, Bailey J, Price SR, Mitch WE, Goldberg AL. Multiple types of skeletal muscle atrophy involve a common program of changes in gene expression. Faseb J. 2004;18:39–51. doi: 10.1096/fj.03-0610com. [DOI] [PubMed] [Google Scholar]
- 38.Lee SW, Dai G, Hu Z, Wang X, Du J, Mitch WE. Regulation of muscle protein degradation: coordinated control of apoptotic and ubiquitin-proteasome systems by phosphatidylinositol 3 kinase. J Am Soc Nephrol. 2004;15:1537–1545. doi: 10.1097/01.asn.0000127211.86206.e1. [DOI] [PubMed] [Google Scholar]
- 39.White JP, Baynes JW, Welle SL, Kostek MC, Matesic LE, Sato S, Carson JA. The regulation of skeletal muscle protein turnover during the progression of cancer cachexia in the Apc(Min/+) mouse. PLoS One. 2011;6:e24650. doi: 10.1371/journal.pone.0024650. [DOI] [PMC free article] [PubMed] [Google Scholar]
- 40.Sandri M, Sandri C, Gilbert A, Skurk C, Calabria E, Picard A, Walsh K, Schiaffino S, Lecker SH, Goldberg AL. Foxo transcription factors induce the atrophy-related ubiquitin ligase atrogin-1 and cause skeletal muscle atrophy. Cell. 2004;117:399–412. doi: 10.1016/s0092-8674(04)00400-3. [DOI] [PMC free article] [PubMed] [Google Scholar]
- 41.Bodine SC, Latres E, Baumhueter S, Lai VK, Nunez L, Clarke BA, Poueymirou WT, Panaro FJ, Na E, Dharmarajan K, Pan ZQ, Valenzuela DM, DeChiara TM, Stitt TN, Yancopoulos GD, Glass DJ. Identification of ubiquitin ligases required for skeletal muscle atrophy. Science. 2001;294:1704–1708. doi: 10.1126/science.1065874. [DOI] [PubMed] [Google Scholar]
- 42.Harvey KF, Mattila J, Sofer A, Bennett FC, Ramsey MR, Ellisen LW, Puig O, Hariharan IK. FOXO-regulated transcription restricts overgrowth of Tsc mutant organs. J Cell Biol. 2008;180:691–696. doi: 10.1083/jcb.200710100. [DOI] [PMC free article] [PubMed] [Google Scholar]
- 43.Latres E, Amini AR, Amini AA, Griffiths J, Martin FJ, Wei Y, Lin HC, Yancopoulos GD, Glass DJ. Insulin-like growth factor-1 (IGF-1) inversely regulates atrophy-induced genes via the phosphatidylinositol 3-kinase/Akt/mammalian target of rapamycin (PI3K/Akt/mTOR) pathway. J Biol Chem. 2005;280:2737–2744. doi: 10.1074/jbc.M407517200. [DOI] [PubMed] [Google Scholar]
- 44.Brugarolas J, Lei K, Hurley RL, Manning BD, Reiling JH, Hafen E, Witters LA, Ellisen LW, Kaelin WG., Jr Regulation of mTOR function in response to hypoxia by REDD1 and the TSC1/TSC2 tumor suppressor complex. Genes Dev. 2004;18:2893–2904. doi: 10.1101/gad.1256804. [DOI] [PMC free article] [PubMed] [Google Scholar]
- 45.Reiling JH, Hafen E. The hypoxia-induced paralogs Scylla and Charybdis inhibit growth by down-regulating S6K activity upstream of TSC in Drosophila. Genes Dev. 2004;18:2879–2892. doi: 10.1101/gad.322704. [DOI] [PMC free article] [PubMed] [Google Scholar]
- 46.Sofer A, Lei K, Johannessen CM, Ellisen LW. Regulation of mTOR and cell growth in response to energy stress by REDD1. Mol Cell Biol. 2005;25:5834–5845. doi: 10.1128/MCB.25.14.5834-5845.2005. [DOI] [PMC free article] [PubMed] [Google Scholar]
- 47.McGhee NK, Jefferson LS, Kimball SR. Elevated corticosterone associated with food deprivation upregulates expression in rat skeletal muscle of the mTORC1 repressor, REDD1. J Nutr. 2009;139:828–834. doi: 10.3945/jn.108.099846. [DOI] [PMC free article] [PubMed] [Google Scholar]
- 48.Wang H, Kubica N, Ellisen LW, Jefferson LS, Kimball SR. Dexamethasone represses signaling through the mammalian target of rapamycin in muscle cells by enhancing expression of REDD1. J Biol Chem. 2006;281:39128–39134. doi: 10.1074/jbc.M610023200. [DOI] [PubMed] [Google Scholar]
- 49.Favier FB, Costes F, Defour A, Bonnefoy R, Lefai E, Bauge S, Peinnequin A, Benoit H, Freyssenet D. Downregulation of Akt/mammalian target of rapamycin pathway in skeletal muscle is associated with increased REDD1 expression in response to chronic hypoxia. Am J Physiol Regul Integr Comp Physiol. 2010;298:R1659–R1666. doi: 10.1152/ajpregu.00550.2009. [DOI] [PubMed] [Google Scholar]
- 50.Glass DJ. Skeletal muscle hypertrophy and atrophy signaling pathways. Int J Biochem Cell Biol. 2005;37:1974–1984. doi: 10.1016/j.biocel.2005.04.018. [DOI] [PubMed] [Google Scholar]
- 51.Pires-Oliveira M, Maragno AL, Parreiras-e-Silva LT, Chiavegatti T, Gomes MD, Godinho RO. Testosterone represses ubiquitin ligases atrogin-1 and Murf-1 expression in an androgen-sensitive rat skeletal muscle in vivo. J Appl Physiol. 2010;108:266–273. doi: 10.1152/japplphysiol.00490.2009. [DOI] [PubMed] [Google Scholar]
- 52.Qin W, Pan J, Wu Y, Bauman WA, Cardozo C. Protection against dexamethasone-induced muscle atrophy is related to modulation by testosterone of FOXO1 and PGC-1alpha. Biochem Biophys Res Commun. 2010;403:473–478. doi: 10.1016/j.bbrc.2010.11.061. [DOI] [PubMed] [Google Scholar]
- 53.Van Balkom RH, Dekhuijzen PN, Folgering HT, Veerkamp JH, Van Moerkerk HT, Fransen JA, Van Herwaarden CL. Anabolic steroids in part reverse glucocorticoid-induced alterations in rat diaphragm. J Appl Physiol. 1998;84:1492–1499. doi: 10.1152/jappl.1998.84.5.1492. [DOI] [PubMed] [Google Scholar]
- 54.Wu Y, Zhao W, Zhao J, Zhang Y, Qin W, Pan J, Bauman WA, Blitzer RD, Cardozo C. REDD1 is a major target of testosterone action in preventing dexamethasone-induced muscle loss. Endocrinology. 2010;151:1050–1059. doi: 10.1210/en.2009-0530. [DOI] [PMC free article] [PubMed] [Google Scholar]
- 55.Qin W, Pan J, Bauman WA, Cardozo CP. Differential alterations in gene expression profiles contribute to time-dependent effects of nandrolone to prevent denervation atrophy. BMC Genomics. 2010;11:596. doi: 10.1186/1471-2164-11-596. [DOI] [PMC free article] [PubMed] [Google Scholar]
- 56.White JP, Baltgalvis KA, Sato S, Wilson LB, Carson JA. Effect of nandrolone decanoate administration on recovery from bupivacaine-induced muscle injury. J Appl Physiol. 2009;107:1420–1430. doi: 10.1152/japplphysiol.00668.2009. [DOI] [PMC free article] [PubMed] [Google Scholar]
- 57.McClung JM, Lee WJ, Thompson RW, Lowe LL, Carson JA. RhoA induction by functional overload and nandrolone decanoate administration in rat skeletal muscle. Pflugers Arch. 2003;447:345–355. doi: 10.1007/s00424-003-1151-7. [DOI] [PubMed] [Google Scholar]
- 58.Carson JA, Lee WJ, McClung J, Hand GA. Steroid receptor concentration in aged rat hindlimb muscle: effect of anabolic steroid administration. J Appl Physiol. 2002;93:242–250. doi: 10.1152/japplphysiol.01212.2001. [DOI] [PubMed] [Google Scholar]
- 59.Smith JP, Hicks PS, Ortiz LR, Martinez MJ, Mandler RN. Quantitative measurement of muscle strength in the mouse. J Neurosci Methods. 1995;62:15–19. doi: 10.1016/0165-0270(95)00049-6. [DOI] [PubMed] [Google Scholar]
- 60.Baltgalvis KA, Berger FG, Pena MM, Davis JM, White JP, Carson JA. Muscle wasting and interleukin-6-induced atrogin-I expression in the cachectic Apc ( Min/+ ) mouse. Pflugers Arch. 2009;457:989–1001. doi: 10.1007/s00424-008-0574-6. [DOI] [PMC free article] [PubMed] [Google Scholar]
- 61.Welle S, Bhatt K, Pinkert CA. Myofibrillar protein synthesis in myostatin-deficient mice. Am J Physiol Endocrinol Metab. 2006;290:E409–E415. doi: 10.1152/ajpendo.00433.2005. [DOI] [PubMed] [Google Scholar]
- 62.Livak KJ, Schmittgen TD. Analysis of relative gene expression data using real-time quantitative PCR and the 2(-Delta Delta C(T)) Method. Methods. 2001;25:402–408. doi: 10.1006/meth.2001.1262. [DOI] [PubMed] [Google Scholar]
- 63.White JP, Baltgalvis KA, Puppa MJ, Sato S, Baynes JW, Carson JA. Muscle Oxidative Capacity during IL-6 Dependent Cancer Cachexia. Am J Physiol Regul Integr Comp Physiol. 2010 doi: 10.1152/ajpregu.00300.2010. [DOI] [PMC free article] [PubMed] [Google Scholar]
- 64.Bradford MM. A rapid and sensitive method for the quantitation of microgram quantities of protein utilizing the principle of protein-dye binding. Anal Biochem. 1976;72:248–254. doi: 10.1006/abio.1976.9999. [DOI] [PubMed] [Google Scholar]
- 65.Urban RJ. Growth hormone and testosterone: anabolic effects on muscle. Horm Res Paediatr. 2011;76(Suppl 1):81–83. doi: 10.1159/000329184. [DOI] [PubMed] [Google Scholar]
- 66.Tajar A, Huhtaniemi IT, O'Neill TW, Finn JD, Pye SR, Lee DM, Bartfai G, Boonen S, Casanueva FF, Forti G, Giwercman A, Han TS, Kula K, Labrie F, Lean ME, Pendleton N, Punab M, Vanderschueren D, Wu FC. Characteristics of Androgen Deficiency in Late-Onset Hypogonadism: Results from the European Male Aging Study (EMAS) J Clin Endocrinol Metab. 2012 doi: 10.1210/jc.2011-2513. [DOI] [PubMed] [Google Scholar]
- 67.Solomon AM, Bouloux PM. Modifying muscle mass - the endocrine perspective. J Endocrinol. 2006;191:349–360. doi: 10.1677/joe.1.06837. [DOI] [PubMed] [Google Scholar]
- 68.Mateescu RG, Thonney ML. Effect of testosterone on insulin-like growth factor-I, androgen receptor, and myostatin gene expression in splenius and semitendinosus muscles in sheep. J Anim Sci. 2005;83:803–809. doi: 10.2527/2005.834803x. [DOI] [PubMed] [Google Scholar]
- 69.Deldicque L, Bertrand L, Patton A, Francaux M, Baar K. ER stress induces anabolic resistance in muscle cells through PKB-induced blockade of mTORC1. PLoS One. 2011;6:e20993. doi: 10.1371/journal.pone.0020993. [DOI] [PMC free article] [PubMed] [Google Scholar]
- 70.Kazi AA, Pruznak AM, Frost RA, Lang CH. Sepsis-induced alterations in protein-protein interactions within mTOR complex 1 and the modulating effect of leucine on muscle protein synthesis. Shock. 2011;35:117–125. doi: 10.1097/SHK.0b013e3181ecb57c. [DOI] [PMC free article] [PubMed] [Google Scholar]
- 71.Rommel C, Bodine SC, Clarke BA, Rossman R, Nunez L, Stitt TN, Yancopoulos GD, Glass DJ. Mediation of IGF-1-induced skeletal myotube hypertrophy by PI(3)K/Akt/mTOR and PI(3)K/Akt/GSK3 pathways. Nat Cell Biol. 2001;3:1009–1013. doi: 10.1038/ncb1101-1009. [DOI] [PubMed] [Google Scholar]
- 72.Hardie DG. Energy sensing by the AMP-activated protein kinase and its effects on muscle metabolism. Proc Nutr Soc. 2011;70:92–99. doi: 10.1017/S0029665110003915. [DOI] [PubMed] [Google Scholar]
- 73.Scarpulla RC. Metabolic control of mitochondrial biogenesis through the PGC-1 family regulatory network. Biochim Biophys Acta. 2011;1813:1269–1278. doi: 10.1016/j.bbamcr.2010.09.019. [DOI] [PMC free article] [PubMed] [Google Scholar]
- 74.White JP, Baynes JW, Welle SL, Kostek MC, Matesic LE, Sato S, Carson JA. The Regulation of Skeletal Muscle Protein Turnover during the Progression of Cancer Cachexia in the Apc Mouse. PLoS One. 2011;6:e24650. doi: 10.1371/journal.pone.0024650. [DOI] [PMC free article] [PubMed] [Google Scholar]
- 75.Kelly M, Gauthier MS, Saha AK, Ruderman NB. Activation of AMP-activated protein kinase by interleukin-6 in rat skeletal muscle: association with changes in cAMP, energy state, and endogenous fuel mobilization. Diabetes. 2009;58:1953–1960. doi: 10.2337/db08-1293. [DOI] [PMC free article] [PubMed] [Google Scholar]
- 76.Bertaggia E, Coletto L, Sandri M. Post-Translational Modifications Control Foxo3 Activity during Denervation. Am J Physiol Cell Physiol. 2011 doi: 10.1152/ajpcell.00142.2011. [DOI] [PubMed] [Google Scholar]
- 77.Zheng B, Ohkawa S, Li H, Roberts-Wilson TK, Price SR. FOXO3a mediates signaling crosstalk that coordinates ubiquitin and atrogin-1/MAFbx expression during glucocorticoid-induced skeletal muscle atrophy. FASEB J. 2010;24:2660–2669. doi: 10.1096/fj.09-151480. [DOI] [PMC free article] [PubMed] [Google Scholar]
- 78.Zhao W, Pan J, Wang X, Wu Y, Bauman WA, Cardozo CP. Expression of the muscle atrophy factor muscle atrophy F-box is suppressed by testosterone. Endocrinology. 2008;149:5449–5460. doi: 10.1210/en.2008-0664. [DOI] [PubMed] [Google Scholar]
- 79.Jones A, Hwang DJ, Narayanan R, Miller DD, Dalton JT. Effects of a novel selective androgen receptor modulator on dexamethasone-induced and hypogonadism-induced muscle atrophy. Endocrinology. 2010;151:3706–3719. doi: 10.1210/en.2010-0150. [DOI] [PubMed] [Google Scholar]
- 80.Jiao Q, Pruznak AM, Huber D, Vary TC, Lang CH. Castration Differentially Alters Basal and Leucine-Stimulated Tissue Protein Synthesis in Skeletal Muscle and Adipose Tissue. Am J Physiol Endocrinol Metab. 2009 doi: 10.1152/ajpendo.00473.2009. [DOI] [PMC free article] [PubMed] [Google Scholar]
- 81.Rowe RW. Effect of castration on muscle growth in the mouse. J Exp Zool. 1968;169:59–64. doi: 10.1002/jez.1401690108. [DOI] [PubMed] [Google Scholar]


