Abstract
There is a growing body of evidence that early glaucomatous damage involves the macula. The anatomical basis of this damage can be studied using frequency domain optical coherence tomography (fdOCT), by which the local thickness of the retinal nerve fiber layer (RNFL) and local retinal ganglion cell plus inner plexiform (RGC+) layer can be measured. Based upon averaged fdOCT results from healthy controls and patients, we show that: 1. For healthy controls, the average RGC+ layer thickness closely matches human histological data; 2. For glaucoma patients and suspects, the average RGC+ layer shows greater glaucomatous thinning in the inferior retina (superior visual field (VF)); and 3. The central test points of the 6° VF grid (24-2 test pattern) miss the region of greatest RGC+ thinning. Based upon fdOCT results from individual patients, we have learned that: 1. Local RGC+ loss is associated with local VF sensitivity loss as long as the displacement of RGCs from the foveal center is taken into consideration; and 2. Macular damage is typically arcuate in nature and often associated with local RNFL thinning in a narrow region of the disc, which we call the macular vulnerability zone (MVZ). According to our schematic model of macular damage, most of the inferior region of the macula projects to the MVZ, which is located largely in the inferior quadrant of the disc, a region that is particularly susceptible to glaucomatous damage. A small (cecocentral) region of the inferior macula, and all of the superior macula (inferior VF), project to the temporal quadrant, a region that is less susceptible to damage. The overall message is clear; clinicians need to be aware that glaucomatous damage to the macula is common, can occur early in the disease, and can be missed and/or underestimated with standard VF tests that use a 6° grid, such as the 24-2 VF test.
Keywords: Glaucoma, OCT, Macula, Retinal ganglion cell, Visual field
1. Introduction
There is no generally agreed upon definition of the term “macula”. Clinicians often use the term to describe the region within the vascular arcades, while according to many anatomists it is the much smaller region containing pigmentation (macula lutea), which appears yellow. Regardless of the definition, the macula includes the region surrounding the fovea with the highest density of retinal ganglion cells (RGCs). For our purposes, we will take the macula to be a region ±8° from the foveal center. This region has the highest RGC density and is vital for everyday visual function. While this area represents less than 2% of the retinal area, it contains over 30% of the RGCs (Curcio and Allen, 1990). Here we focus on glaucomatous damage of this macular region.
The diagnosis of glaucoma, a progressive optic neuropathy, is based upon a specific pattern of anatomical and functional (loss of vision as indicated by visual field (VF) examinations) changes. It has long been recognized that early glaucomatous damage can affect the macula (e.g. Aulhorn and Harms, 1967; Drance, 1969; Aulhorn and Karmeyer, 1977; Nicholas and Werner, 1980; Anctil and Anderson, 1984; Heijl and Lundqvist, 1984). However, early macular damage has been ignored to a great extent until recently. For example, the most common VF test for glaucoma has test points spaced 6° apart. As we will see, these test points fall outside the densest region of RGCs. In any case, there is renewed interest in macular damage, in part because we can now make in vivo measures of the RGC layer thickness of the human macula with optical coherence tomography (OCT).
2. Anatomy of the human macula as revealed by fdOCT
2.1. Fundus view of RNFL bundles
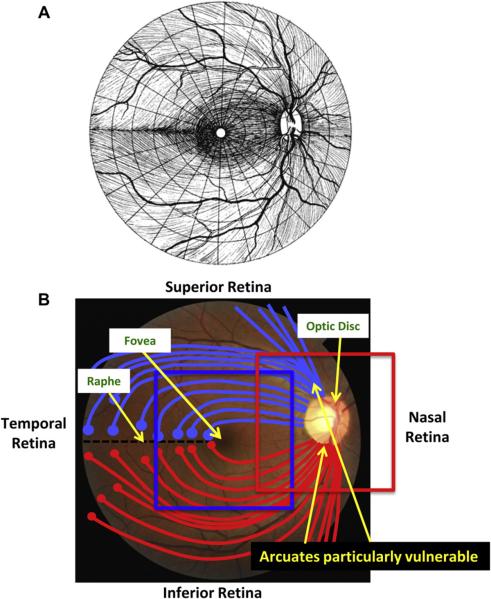
The axons of the RGCs travel in bundles in the retinal nerve fiber layer (RNFL) from the RGC bodies to the optic disc. To understand the nature of glaucomatous damage, it is essential to understand the course these bundles take as they travel to the disc. Fig. 1A is a schematic drawing from Harrington and Drake (1990) often seen in secondary texts. Fig. 1B summarizes the key features needed for our discussion. First, the RNFL bundles (red and light blue lines) from groups of RGCs (red and light blue circles) on the temporal side of the fovea arc around the fovea. Second, on the temporal side of the fovea, a raphe with relatively few axons is formed because, in general, the axons of the RGCs do not cross the horizontal meridian. Third, the optic disc generally lies above the horizontal meridian. Finally, the collection of RNFL bundles is particularly thick in the superior and inferior quadrants of the disc. These regions have long been known to be particularly vulnerable to glaucomatous damage.
Figure 1.
Fundus view of retinal nerve fiber layer (RNFL) bundles. (A) Illustration showing the pattern of the RNFL bundles in the human retina, from Harrington and Drake (1990), with permission. (B) A fundus photo of a human eye. Notable features are labeled. The blue and red squares indicate the approximate regions scanned by the frequency domain optical coherence tomography (fdOCT) discussed below.
2.2. In vivo measures of human retinal anatomy
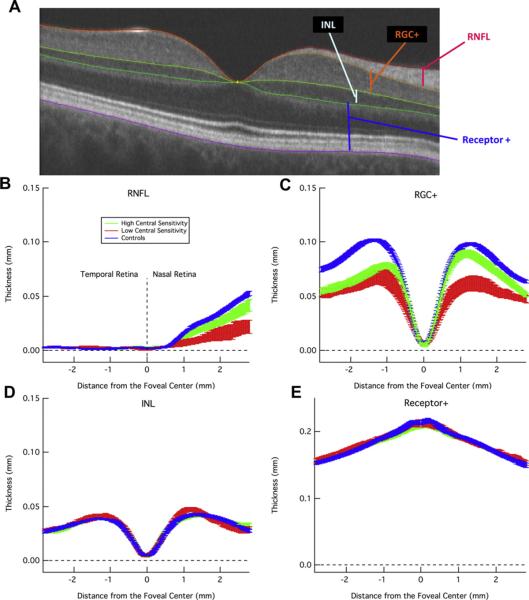
Retinal layers can be visualized in vivo with frequency domain (fd) OCT. (See recent review by Gabriele et al., 2010.) Fig. 2A shows a horizontal scan along the midline of a healthy eye. A few of the key layers are marked, including the RGC+ (RGC+ inner plexiform (IP) layer) and RNFL.
Figure 2.
Layers of the retina as imaged by fdOCT and corresponding thickness profiles for both glaucoma patients and healthy controls. (A) A horizontal fdOCT scan through the fovea of a control subject showing the retinal nerve fiber layer (RNFL), retinal ganglion cell plus inner plexiform layer (RGC+), inner nuclear layer (INL), and everything from the top of the outer plexiform layer to the bottom of Bruch's membrane, including the photoreceptors (Receptor+). (B) The average RNFL thickness, ± 1 standard error, of healthy controls (blue) and glaucoma patients with sensitivity of the central (foveal) point on standard automated perimetry either within (green) or below (red) normal 95% limits. (C) RGC+ as in B. (D-E) INL and Receptor+ as in B. Modified from Wang et al. (2009).
When we started our studies, commercial algorithms did not exist for segmenting the RGC+ layer. Thus, we developed a computeraided manual segmentation technique. With training and documented guidelines, this technique yielded excellent within- and between-operator reliability (Hood et al., 2011a). Using this technique, Wang et al. (2009) showed that the RNFL and RGC+ layer (Fig. 2B,C) in the macula were thinner in patients with glaucoma (green and red) than in healthy controls (blue), while the thickness of the inner nuclear layer (INL) and receptor layer was similar to those of healthy controls (blue) (Fig. 2D,E). Further, the patients with poor central sensitivity (red), as measured by the threshold for the center test point on the 24-2 VF, had a thinner RNFL and RGC+ layer than did the patients with better central sensitivity (green).
While commercial segmentation algorithms have improved, they should be used cautiously, as they do not always produce veridical results. We currently use an automated algorithm to segment the RGC+ layer and RNFL (Yang et al., 2010), but also check, and manually adjust if necessary, the results (Raza et al., 2011). Even with this technique, it is not always possible to distinguish the border between the RGC and IP layers. Thus, for the work described here, we measured the RGC+ layer.
2.3. Healthy RGC+ and RNFL anatomy as revealed by averaging fdOCT data
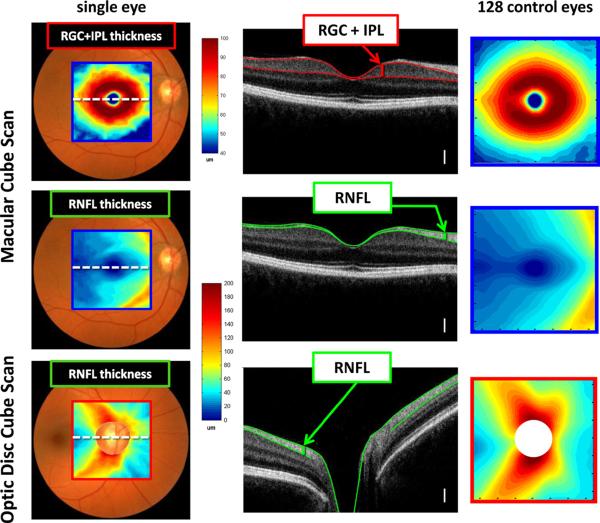
To better understand the retinal distribution of RGCs and their axons (RNFL), the results from fdOCT cube scans from 128 healthy controls were averaged. The red and blue rectangles on the fundus photos in Figs. 1B and 3 (first column) show the location of these cube scans. The RGC+ layer and RNFL were segmented using an automated algorithm and manually corrected when necessary, as mentioned above. The segmented borders are illustrated in Fig. 3 (second column), which shows one of the 128 lines of the cube scan from one individual. Based on these segmented borders, the thickness of the RGC+ layer and RNFL were obtained. These thicknesses are shown in a pseudo-color map for one eye (first column) and for the average of all 128 eyes (third column). Note that there are two RNFL maps, one for the macula (middle row) and one for the optic disc scan (bottom row). For the RGC+ layer, only the thickness for the macular scan (top row) was analyzed, as the RGC+ layer was too thin to be of interest on the optic disc scans. All results here, and in subsequent figures, are shown as right eyes.
Figure 3.
Healthy RGC+ and RNFL anatomy as revealed by fdOCT. The left column shows the thickness maps for a single healthy individual; the center column shows a cross-sectional slice (dotted white line in left column) with relevant layers labeled (white calibration bar is 100 μm); and the right column shows average data from 128 control eyes. The centers of the optic disc were aligned for each individual before averaging. Disc centers were determined through a combination of en face fdOCT images and the edge of Bruch's membrane as imaged by cross-sectional fdOCT scans. Calibration bars are shown for the thickness maps; they range from dark red (thickest) to dark blue (zero). Modified from Hood et al. (2012).
2.3.1. The RNFL in healthy controls
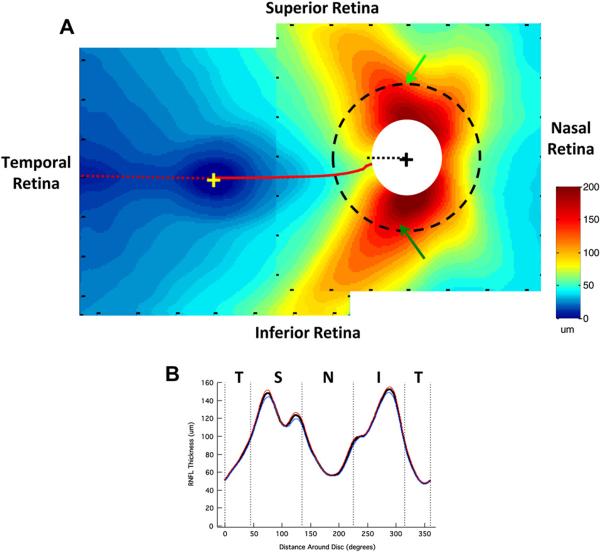
The two average RNFL thickness maps in Fig. 3 (right column) are combined into one display in Fig. 4A. The two maps were aligned using the averages, for the 128 eyes, of the horizontal distance between the centers of the fovea and disc (14.8 ± 0.9°) and the vertical displacement of the disc center relative to the foveal center (6.3 ± 3.0°). These values are in general agreement with those in the literature (e.g. Rohrschneider, 2004; Lefèvre et al., 2007; Bixenman and von Noorden, 1982; Timberlake et al., 2005).
Figure 4.
Normal RNFL anatomy as imaged by fdOCT. (A) The average RNFL thickness in the macula and near the optic disc from 128 controls. The macula and optic disc scan regions were aligned based on the average distance and angle of the optic disc relative to the fovea. The dotted red line indicates the minimum in RNFL thickness and the dotted black line within the white circle indicates 9:00 o' clock at the disc. The dashed black circle around the optic disc, with a diameter of 3.4 mm, indicates the circular scan region typically used in circumpapillary OCT studies. (B) The circumpapillary RNFL thickness profile obtained around a circle of 3.4 mm diameter (dashed circle in A). The solid black line represents the average for all 128 controls, while the blue (n = 54) and red (n = 74) lines represent averages for those older (blue) and younger (red) than 40 years of age.
There are a few features of note in Fig. 4A. First, the RNFL is thinnest (dark blue) in the center of the macular scan, corresponding to the relative lack of RGC axons in the fovea. Second, there is a temporal minimum in RNFL thickness (dashed red line), which corresponds to the raphe. Note that the raphe falls approximately along the horizontal meridian. Contrast this to the locus of minimum RNFL thickness (solid red line) nasal to the fovea, which curves up to meet the disc between 8:00 and 9:00 o'clock; the thin black dotted line marks 9:00 o'clock.
Third, as expected, the thickest portion of the RNFL occurs close to the disc with the superior and inferior regions showing the thickest (dark red) RNFL regions. The dashed circle has a diameter of 3.4 mm and is the locus of measurements for the circumpapillary RNFL thickness obtained with time domain OCT (Schuman et al., 1996). Fig. 4B shows the RNFL profile, sometimes called the TSNIT curve. The bold black curve is the result for all 128 eyes, while the blue and red curves are the results divided into those older (blue, n = 54, mean age 53.2 ± 8.0 years) and younger (red, n = 74, mean age 28.2 ± 6.0 years) than 40 years of age. The older group served as the controls for the analysis of the patients described below and in Hood et al. (2012). In any case, the effects of age on OCT RNFL thickness are relatively small, as others have quantified (e.g. Poinoosawmy et al., 1997; Budenz et al., 2007; Parikh et al., 2007; Hood et al., 2009).
2.3.2. The RGC+ layer in healthy controls
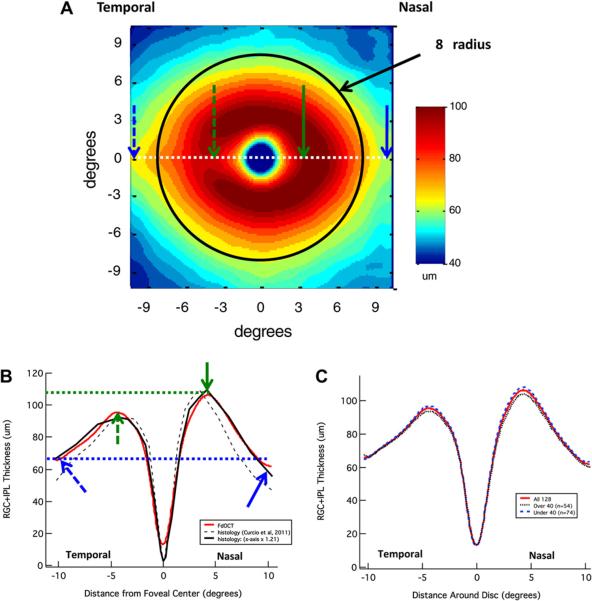
Fig. 5A shows the average RGC+ thickness for the macular scans of the 128 controls. Notice that the thickest portion (dark red and red) of the RGC+ layer falls within about ±8° (black circle with 8°radius) of the foveal center, the region we defined above as the macula. The qualitative agreement between the donut-shaped RGC+ thickness profile and primate RGC density data (Curcio and Allen, 1990) has been noted previously (e.g. Wang et al., 2009; Mwanza et al., 2011; Ooto et al., 2011; Raza et al., 2011). Recently, Curcio et al. (2011) measured the RGC+ thickness seen in histological sections of 18 donor eyes. Fig. 5B shows the RGC+ thickness across the horizontal meridian (white dotted line in Fig. 5A) for both our fdOCT data (red) and Curcio et al.'s histological data (black dashed). (See also de A Moura et al., 2012 for a similar analysis.) The deviation between our data (red) and the histological data (black dashed) is probably largely due to shrinkage of the histological tissue. Curcio et al. reported that tissue shrinkage was 14.5% overall and 29% in the fovea. To approximate the effects of shrinkage, the solid black curve shows their histological results after scaling the x-axis by a factor of 1.21 for best fit to our data (corresponding to 17.4% shrinkage). The striking agreement between our fdOCT data (red) and their adjusted histological results (solid black) suggests a high degree of correspondence between the in vivo OCT and postmortem data. Even subtle differences between nasal versus temporal thickness can be seen by comparing the locations marked with the solid versus dashed arrows. In both sets of data, the RGC+ is thicker in the nasal retina (solid green arrow) close to the fovea than it is in the temporal retina (dashed green arrow), but the reverse appears to be the case further from the fovea (blue arrows). Fig. 5C shows that the RGC+ thickness is only slightly lower for the group over 40 than it is for the under 40 group. See Mwanza et al. (2011) and Ooto et al. (2011) for similar results.
Figure 5.
Normal RGC+ anatomy as imaged by fdOCT. (A) The average RGC+ thickness in the macula from 128 controls. The black circle has a radius of 8°. (B) Horizontal RGC+ thickness profile (dotted white line in A) as determined by fdOCT (red line) and histology (dashed black line, based upon data supplied by C. Curcio from a study by Curcio et al. (2011)). The solid black line is the same data from histology plotted against an x-axis scaled by a factor of 1.21 for best fit to our data. See text for details. (C) RGC+ thickness profiles of all 128 controls (solid red line), as well as those older than (dotted black line) and younger than (dashed blue line) 40 years of age (similar to RNFL in Fig. 4B).
3. Glaucomatous RGC+ and RNFL anatomy as revealed by averaging fdOCT data
In a recent study, we analyzed the RGC+ and RNFL thickness profiles of eyes of patients who were either diagnosed as glaucoma suspects or as glaucoma patients (Hood et al., 2012). To better understand glaucomatous damage, we averaged these data based upon either the mean deviation (MD) of the 24-;2 VF test or upon classification of the VF defects. In both cases, the results were compared to a subset of the controls (n = 54) with approximately the same mean age. Of course, we must keep in mind that averaged results, while providing a clearer view of common patterns and trends, need not be representative of any individual eye. Thus, insights derived from averaged data must be confirmed via other analyses.
3.1. RGC+ and RNFL thinning in patients grouped by MD
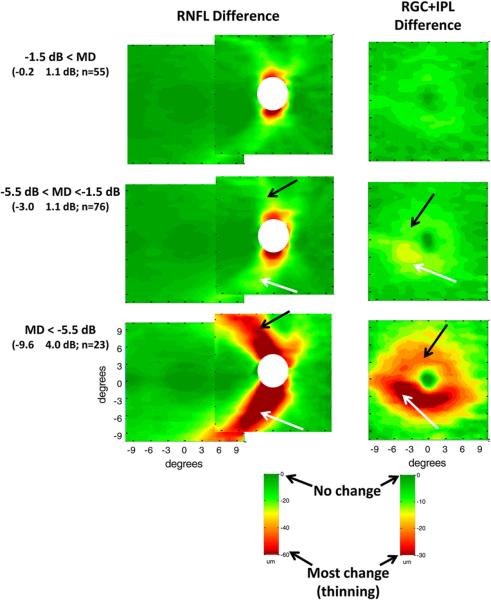
The 154 eyes of the patients were assigned to one of 3 groups based upon the MD of their 24-2 VFs. The groups had MD values better than −1.5 dB (MD values within normal range), between −1.5 and −5.5 dB (normal values to mild glaucoma) or less than −5.5 dB (moderate to severe glaucoma). The RNFL and RGC+ thickness profiles of each patient were determined as described above for the healthy controls (Fig. 3) and average thickness profiles were created for each group [see Fig. 3 in Hood et al. (2012)]. To obtain a measure of the glaucomatous damage, the average profiles for the age-similar controls (Figs. 4 and 5A) were subtracted from the group averages for the patients. In Fig. 6, these difference maps for the RNFL (left column) and RGC+ layer (right column) are shown in pseudo-color, where dark green represents no change in thickness compared to controls and dark red the most change (i.e. thinning). See calibration bars at the bottom of the figure.
Figure 6.
Glaucomatous RNFL and RGC+ anatomy as imaged by fdOCT in patients grouped by mean deviation (MD). RNFL (left column) and RGC+ (right column) changes (thinning) in average thickness of glaucoma patients and suspects were obtained by subtracting the thickness of the controls from the thickness of the patient groups. The patients' eyes were grouped by MD of the 24-2 visual field: MD better than −1.5 dB (top row), MD between −1.5 dB and −5.5 dB (middle row), and MD worse than −5.5 dB (bottom row). The mean MD ± SD and the number of eyes are shown in parentheses. Green indicates a thickness similar to control values while red indicates a substantially thinner region (see calibration bars, lower right of each column). Modified from Hood et al. (2012).
3.1.1. RNFL loss in patients
As expected, on average, the greatest RNFL loss (Fig. 6, left column) is seen in the arcuate regions, which are the thickest regions in the healthy eyes (Fig. 4A). The thinning in this region is present even in the group with normal VFs based upon MD values (Fig. 6, upper left panel), where the MD was −0.2 ± 1.1 dB (0.0 ± 1.1 and −0.2 ± 1.4 for the upper and lower hemifields, respectively). As expected, the thinning becomes progressively worse for the groups with the more severe MD losses. Note that the thinning appears to be slightly greater in the inferior (white arrows) as opposed to the superior (black arrows) retina. The suggestion of a greater thinning in the inferior retina has a counterpart in the clinical literature, where glaucomatous damage has been reported to be more severe in the upper VF (e.g. Nicholas and Werner, 1980; Drance, 1977; Heijl and Lundqvist, 1984; Lewis and Phelps, 1984). In any case, our primary concern here is with the macular RGC damage seen in eyes with glaucoma.
3.1.2. RGC+ loss in patients
The average RGC+ (Fig. 6, right column) is also thinner in the group with the MDs in the normal range (upper right panel) and becomes progressively thinner as the MD becomes more abnormal. In general, the thinning is more apparent in the inferior (white arrows) as opposed to the superior (black arrows) retina. This is a key point and the relationship to the VF literature will be explored in the next section. In addition, notice that the RGC+ thinning is more extreme on the temporal side of the fovea (white arrows in lower two right panels of Fig. 6). A similar pattern can be seen in the average deviation of ganglion cell complex (GCC, i.e., RNFL+ RGC + IPL) thickness reported by Tan et al. (2009) for patients with perimetric glaucoma. For the averaged data, RGC+ damage in the macula is as detectable as the RNFL damage in the classic arcuate regions. [See z-score analysis in Fig. 5 of Hood et al. (2012) and Tan et al. (2009)]. In Section 4.4 below, we show the relationship between the macular RGC+ thinning and the RNFL thinning in the classic arcuate regions seen in Fig. 6 (left column).
3.2. RGC+ and RNFL thinning in patients grouped by visual field classification
To better understand the relationship of the macular RGC+ loss to classic models of glaucomatous damage, we grouped the same eyes according to the VF classification scheme of Keltner et al. (2003). The superior hemifields of the 156 eyes were categorized as “normal” (n = 52), paracentral (n = 31), partial arcuate (n = 30), arcuate (n = 31), altitudinal (n = 5), nasal step (n = 7) or temporal wedge (n = 0). Only the first 4 categories were considered further as too few hemifields fell into the latter 3 categories for meaningful comparisons. This subset also had the advantage that according to the traditional view these categories represent progressively greater nerve fiber bundle loss (Keltner et al., 2003). That is, we expect to see progressively greater RNFL loss in the thick arcuate bundles as we go from the VF classified as “normal” to those with a clear arcuate defect.
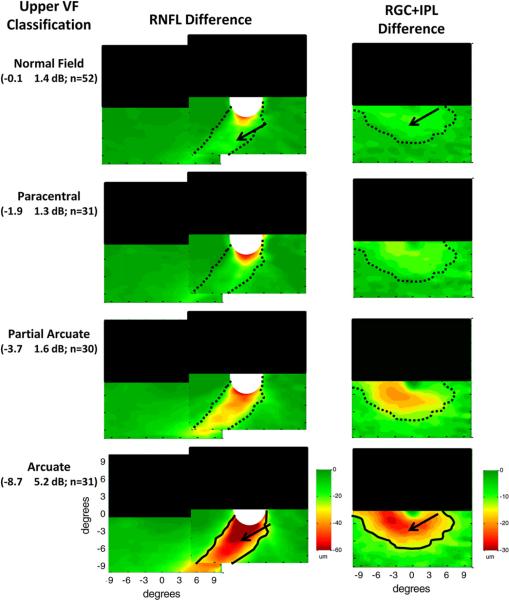
Fig. 7, in the same form as Fig. 6, shows the change in RNFL (left column) and macular RGC+ (right column) thickness for the upper hemifields grouped by VF classification. The superior retinal region is obscured by the black rectangle as a reminder that only the inferior retina is of interest here because the upper visual hemifields were classified; the results were similar for the classification of the lower hemifields. The pattern of results in Fig. 7 is similar to that seen for the MD groups in Fig. 6. In particular, the thinning of the arcuate RNFL (left column) and the macular RGC+ (right column) becomes progressively greater in the inferior retina as the classification of the upper VF defects progress from normal to arcuate. Further, thinning of both the RNFL and RGC+ layers occurs even in the hemiretina associated with VFs classified fied as normal (black arrows, top panels) based upon the Keltner et al. (2003) criteria.
Figure 7.
Glaucomatous RNFL and RGC+ anatomy as imaged by fdOCT in patients grouped by classification of the upper hemifield of the VF. RNFL (left column) and RGC+ (right column) changes (thinning) in average thickness of glaucoma patients and suspects were obtained by subtracting the thickness of the controls from the thickness of the patient groups. Each row indicates a different classification of defect pattern based on inspection of the 24-2 visual fields. The superior retinal region is obscured by the black rectangle as a reminder that only the inferior retina (upper VF) is of interest here. The mean MD ± SD for the upper hemifield and the number of eyes are shown in parentheses. The solid black lines are iso-thickness contours from the arcuate group repeated in the other groups (as dotted black lines). Green indicates a thickness similar to control values while red indicates a substantially thinner region (see calibration bars, lower right of each column). Modified from Hood et al. (2012).
To compare the region of thinning across classification categories, the black iso-thickness contours were drawn in the lower panels. These same contours were placed on the upper panels as the dotted black lines. To a first approximation, the regions involved in the thinning are the same across all VF categories; only the degree of thinning is changing. It may be time to modify how we classify or stage glaucomatous damage so as to incorporate OCT information and to recognize the damage underlying VF changes probably does not fall into discrete categories. In any case, the main point here is that, on average, there is a clear thinning of the macular RGC+ layer for all VF categories. It is this thinning that we seek to better understand.
3.3. Is the degree of macular damage surprising?
Should we be surprised by the degree of macular RGC+ damage? Some glaucoma specialists will say “yes”, while others will say “no”. First, let's consider the reasons why the degree of macular RGC+ damage may be surprising to some.
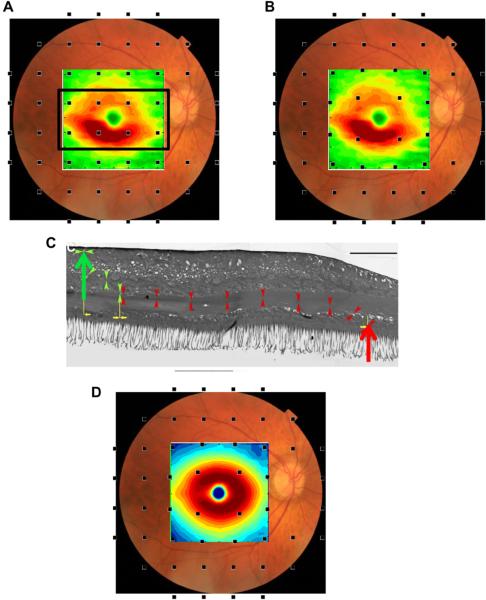
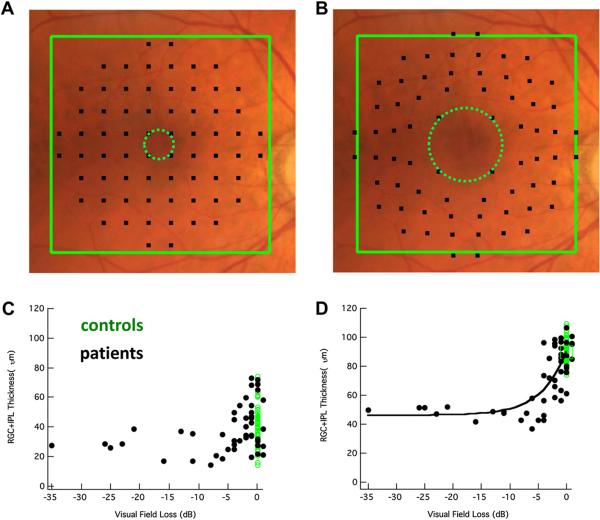
Patients suspected of having glaucoma are almost always tested with static automated perimetry using a test protocol in which the test points are spaced 6° apart (e.g. the 24-2 or 30-2 protocol of the Humphrey Field Analyzer, Zeiss, Inc.). The RGC+ thinning seen in Figs. 6 and 7 is poorly sampled by this test. This is illustrated in Fig. 8A, where the RGC+ difference (thinning) map for the MD group with the largest losses (MD < −5.5 dB, lower right panel in Fig. 6) is superimposed on a fundus photo. The small black squares show where the 24-2 test spots fall on the retina. However, the locations of the RGCs stimulated by the central 24-2 test points are farther from the fovea because the RGCs in the fovea are displaced. The displacement of the foveal RGCs is illustrated in Fig. 8C from Drasdo et al. (2007); they traced the course of the connections (small arrow heads) from cone receptor (large red arrow) to the associated RGC region (large green arrow) in human postmortem tissue. The location of the 24-2 points in Fig. 8B,D takes the displacement calculated by Drasdo et al. into consideration (Raza et al., 2011; Hood and Raza, 2011). While the displacement of the central 24-2 points are relatively minor (i.e. compare Fig. 8A,B), they are substantial for the central points of the 10–2 as will be seen in Section 4.4 and Fig. 13.
Figure 8.
The macula is not well-sampled by the 24-2 or 30-2, particularly after correction for RGC displacement. (A) A fundus photo with the thickness changes observed in the RGC+ of Fig. 6 (lower right panel) for a moderate to severe glaucoma group (MD worse than −5.5 dB) superimposed along with black squares indicating the test spots of the 24-2 visual field. (B) As in A, but with displacement of the 24-2 visual field test spots to account for RGC displacement. Note the region of greatest RGC+ thinning (red) is not well-sampled by the test spot locations. (C) An illustration of the displacement of RGC bodies from the fovea, modified from Drasdo et al. (2007), with permission. The large red arrow indicates the location of the cone receptor, whose connections were traced (small arrow heads) to the location of the associated RGC (large green arrow). The calibration bar is 100 μm (0.346° assuming 0.289 mm/degree). (D) As in B, but with normal control thickness values from Fig. 5D.
Figure 13.
Local structure–function relationships in the macula. (A) A fundus photo with 10-2 test points superimposed. (B) As in A, but with 10-2 test points adjusted based on RGC body displacement from the fovea. (C) Structure–function relationship between RGC+ thickness (y-axis) and 10-2 visual field sensitivity (x-axis) for the central four points of the 10-2 (see dotted green circle in A). Green dots are controls while black dots are patients. The black curve is the prediction of a simple linear model. (D) As in C, but with a correction for displacement (see dotted green circle in B). Modified from Raza et al. (2011).
The regions of densest RGCs in the healthy eye (Fig. 8D), and of the most extreme thinning of the RGC+ layer (Fig. 8B), fall within the central 4 points of a test (e.g. 24-2) with a 6° grid. Yet, this is the most commonly used test protocol in clinical practice. Further, classification schemes of VF defects, such as that of Keltner et al. (2003), do not include the field points within the black rectangle of Fig. 8A.
On the other hand, many glaucoma experts will not be surprised and will point to VF literature on macular damage. Historically, the degree of macular damage has been debated (e.g. Stamper, 1984), especially in patients with normal tension glaucoma (e.g. see the review by Araie, 1995). However, the evidence for early, and even initial, damage to the macula is clear and has been mentioned in the literature for at least 40 years (e.g. Aulhorn and Harms, 1967; Drance, 1969; Aulhorn and Karmeyer, 1977; Anctil and Anderson, 1984; Heijl and Lundqvist, 1984). Thus, whether we should be surprised or not can be debated. However, we need to know more about the nature of the damage to the macula, as well as how best to detect it. In the next section, we turn to evidence from the VF literature to better understand the OCT findings.
4. Relating structural glaucomatous damage of the macula to visual field defects
4.1. Does early glaucomatous damage seen on visual field tests involve the macula?
Our fdOCT data averaged across patients indicates that macular damage is present and is as detectable as the damage seen in the high-risk arcuate regions of the disc. But, how commonly is it seen on VFs of individual eyes early in the glaucomatous process? In a study that speaks directly to this question, Heijl and Lundqvist (1984) followed 45 eyes that progressed from normal to abnormal VFs using early automated perimetry with test points at 5, 10, 15 and 20° from fixation. Although the largest number of initially abnormal points were at 15°, they noted “a striking preponderance of defective points” at 5°, especially in the upper VF. Thus, consistent with our fdOCT results, they found that early, and even initial, glaucomatous VF damage is occurring in the macula, as well as in regions associated with classic arcuate damage.
Other evidence also suggests that early glaucomatous damage as seen on VF tests often involves the macula. In a largely overlooked study, Langerhorst et al. (1997) prospectively obtained 10–2 (2° grid) and 30–2 (6° grid) VF data on 121 patients who were suspects or showed signs of early glaucoma. Defects were commonly seen on 10–2 VFs, i.e., within the central ±10°. In particular, 36.4% of the hemifields were abnormal on 10–2 testing, compared to 48.5% on 30–2 VFs. In addition, the damage was rated as severe, or more severe, on the 10–2 VFs in 55.2% of the abnormal hemifields. In a similar prospective study of suspects or patients with mild glaucoma (MD better than −6.0 dB), we found similar results. In particular, 53.0% and 58.5% of the hemifields were abnormal on the 10–2 and 24-2 VFs, respectively, and 15.7% of the hemifields that were normal on the 24-2 VFs were abnormal on 10–2 VFs (Traynis et al., 2012). In addition, Schiefer et al. (2010) recently reported that over 50% of eyes with mild to moderate glaucoma had defects within the central ±3°. Clearly, early glaucomatous VF damage often involves the central ±10° and this damage can be underestimated, and even missed, with VF tests (e.g. 24-2 and 30-2) using a 6° grid.
4.2. Initial arcuate visual field defects in the macula and associated optic disc RNFL thinning
Dr. Robert Ritch first suggested to us that initial macular VF defects often resemble a “comma” or a partial comma (unpublished presentation). While there are a number of isolated examples in the earlier literature of these small arcuate-like, defects close to fixation (e.g. Aulhorn and Harms, 1967; Drance, 1969; Aulhorn and Karmeyer, 1977; Airaksinen and Heijl, 1983), until recently relatively little was known about their nature and prevalence. It is now clear that the early VF defects in the macula are often, if not typically, arcuate in shape (Schiefer et al., 2010; Hood et al., 2011b; Su et al., in press; Traynis et al., 2012).
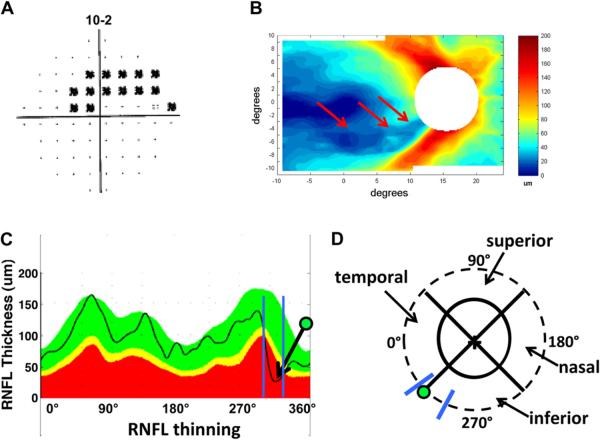
Aulhorn and Karmeyer (1977) attributed arcuate macular VF defects to RNFL bundle damage at the disc. To better understand the relationship between these arcuate VF defects and the location of RNFL thinning at the disc, we selected eyes with arcuate or partial arcuate defects on 10–2 VFs, but without clear abnormalities outside the central 10°on the 24-2 VF (Hood et al., 2011b). Ten of the 11 eyes meeting these criteria had upper VF (inferior retina) defects. All 11 eyes showed arcuate-shaped RNFL thinning, which corresponded to the arcuate or partial arcuate defects seen on the 10–2 VF. Fig. 9A shows the 10–2 VF for one of the eyes in this study. There is a clear arcuate pattern of thinning in the RNFL thickness map obtained from the macular scan of this patient (Fig. 9B, red arrows).
Figure 9.
Initial arcuate damage within the central 10° in glaucoma patients and the associated RNFL thinning. (A) An example of a 10-2 visual field from the right eye of a glaucoma patient showing an arcuate pattern of damage. The black squares indicate a region where the patient's sensitivity to light was significantly (p ≤ 0.01) below normal. (B) The corresponding RNFL thinning map as determined by fdOCT in the glaucoma patient shown in A. (C) The circumpapillary RNFL profile (black line) for the subject shown in A and B superimposed upon a normal range (green area), as well as values thinner at the 5% (yellow) or 1% (red) level of significance. The arrow with the green dot indicates a local minimum corresponding to the arcuate pattern in B. The blue lines indicate the range of minimums for ten glaucomatous eyes with inferior retinal macular defects (from Hood et al., 2011b). (D) A schematic of the optic disc, with the green dot and blue lines from C superimposed. We refer to the region within the blue lines as the `macular vulnerability zone' (MVZ) of the disc.
We located the circumpapillary disc damage associated with these arcuate RNFL defects using the RNFL (TSNIT) map from an OCT circumpapillary circle scan (Fig. 9C). The arrow in Fig. 9C marks the location of the maximum thinning of the RNFL associated with the VF in Fig. 9A. The blue vertical lines indicate the range of locations of the maximum thinning for the 10 eyes with inferior retinal macular defects. This range is best illustrated in Fig. 9D where the green dot and blue lines from panel C are shown relative to the optic disc (solid black oval). The dashed circle has a diameter of 3.4 mm and is the location of the circle scan used to generate the RNFL thickness (TSNIT) profile in Fig. 9C. The region between the blue lines in Fig. 9D extends from the inferior portion of the temporal quadrant to the temporal portion of the inferior quadrant. We call this region the “macular vulnerability zone” (MVZ) of the disc.
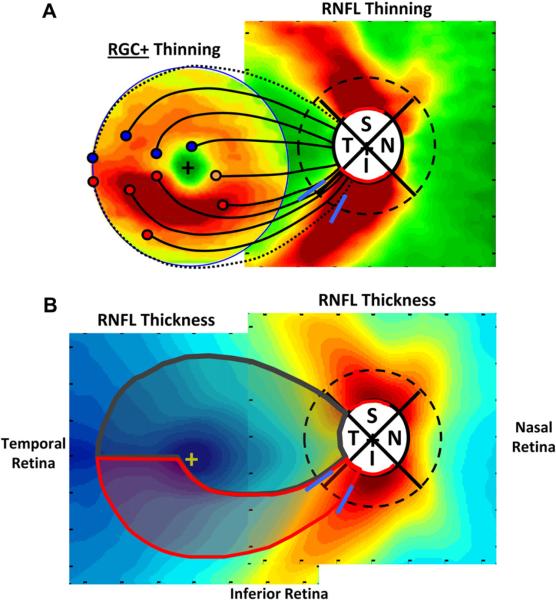
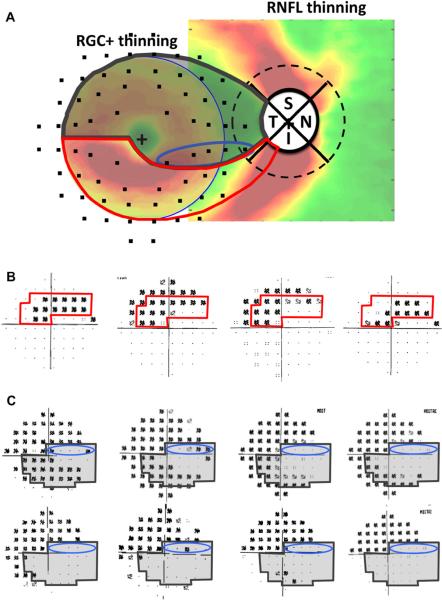
Thus, the small arcuate defects seen in the upper macular VF are associated with arcuate RNFL defects that are centered primarily in the MVZ of the disc. This has important implications for understanding the nature of macular damage. To better understand the relationship between the loss of the RGCs in the macula and the thinning of RNFL in the MVZ, Fig. 10A combines the maps of the macular RGC+ and optic disc RNFL thinning for the group with a MD worse than −5.5 dB (from Fig. 6, bottom row). Note that the RGC+ map is trimmed to show only the central ±8°. We (Hood et al., 2012) proposed that the RGCs thinning seen in the inferior macula in Fig. 10A is associated with the RNFL thinning occurring in the MVZ of the disc (between the blue diagonal lines). To illustrate this, the proposed paths of five clusters of RGCs + (red circles) and their associated RNFL bundles (black curves) are shown. That is, the major RGC+ damage, which is in the inferior macular region, is associated with the RNFL bundles entering the MVZ of the disc. On the other hand, the RNFL bundles associated with the RGC+ region in the corresponding portion of the superior macula enter the disc closer to 9:00 o'clock and well within the temporal quadrant.
Figure 10.
Schematics of the macula and optic disc indicating features relevant to macula damage. (A) Average patterns of thinning for moderate to severe glaucoma patients (24-2 MD worse than −5.5 dB) from Fig. 6 (lower right panel). The square on the right shows the RNFL thinning map, but the region within the circle on the left shows RGC+ (and not RNFL) thinning map for the central 8°. The red, orange, and blue circles indicate a selection of RGC bodies in the inferior (red and orange) and superior (blue) retina and the associated black curves are the proposed paths of their axon bundles to the optic disc. The dotted RNFL bundles mark the boundaries of the macular RNFL bundles (the shaded gray region within the red and dark gray borders in panel B). The blue lines on the peripapillary dashed circle indicate the MVZ at the disc as in Fig. 9D. (B) The schematic model superimposed upon the RNFL thickness of healthy control from Fig. 4A. According to the schematic model, the region within the red boundaries contains the RGCs that project to the MVZ region (blue slanted lines). The RGCs in the remaining region of the macular (within the gray boundaries) are said to project to the temporal quadrant of the disc. Modified from Hood et al. (2012).
What do we know about the MVZ of the disc? First, the MVZ is part of the relatively thick RNFL arcuate region in healthy controls as seen in Fig. 10B (from Fig. 4), as well as part of the inferior disc region showing the most damage (Fig. 10A). That is, the axons from RGCs in the inferior macular retina enter the high-risk inferior arcuate region of the disc, while those from the superior macula enter the temporal quadrant. We know from OCT RNFL and HRT neural rim measurements, as well as analysis of fundus photographs, that the inferior and superior quadrants of the disc are particularly vulnerable to glaucomatous damage, while the temporal quadrant is relatively less affected. For example, circumpapillary OCT studies of the optic disc typically find that thinning of the RNFL in the superior and inferior quadrants of the disc is a more sensitive measure of glaucomatous damage than are changes in the temporal or nasal quadrants. [See recent papers by Leite et al. (2012) and Rao et al. (2012) and the earlier work they reference.] The temporal region of the disc shows less damage unless glaucoma is more severe.
Second, we defined the MVZ based upon the range of minima in the circumpapillary RNFL thickness profiles (Fig. 9C) obtained with time domain OCT scans (Hood et al., 2011b). In that study, the range was relatively narrow, 27°, as indicated by the blue slanted lines in Figs. 9C and 10A. Third, this general region of the disc has the highest incidence of disc hemorrhages (Lan et al., 2008). Disc hemorrhages are often associated with glaucomatous damage. In fact, Park et al. (2011) observed that patients with damage within the central 10° on the 24-2 were more likely to have disc hemorrhages than those with comparable damage (nasal steps) outside the central 10°.
Fourth, in general, this MVZ is just adjacent to a major inferior temporal artery or vein (Hood et al., 2008b). This association may have no import other than the fact that the thickest part of the RNFL is associated with the major blood vessels. However, it is worth noting that we find hypodense regions (holes or tunnels) in the RNFL of glaucoma patients and suspects (Xin et al., 2011). These hypodense regions are associated with VF defects and, we believe, represent local axonal loss. Interestingly, they are almost always adjacent to a blood vessel.
It is still not entirely clear how these various findings are related, or in fact, which are most important in understanding the susceptibility of the inferior macula RGCs to glaucomatous damage. However, it appears that a relatively small region of the disc is involved in patients with superior arcuate VF defects in the macula.
4.3. A schematic model of macular RNFL projections and RCG+ and RNFL damage
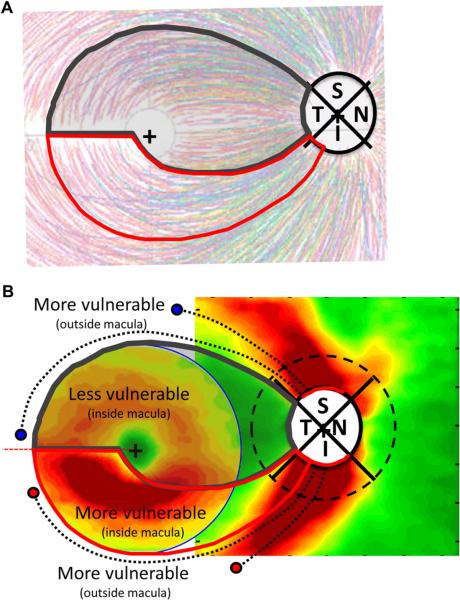
To better understand the nature of glaucomatous damage to the macula and how this damage is related to VF defects, we proposed a schematic model (Hood et al., 2012). This model has two assumptions. The first concerns the paths that the RNFL bundles take between the RGC of the macula and the disc. We assume that most of the RGCs (red circles in Fig. 10A) in the inferior macular region project to the MVZ. The remaining RGCs (orange circle in Fig. 10A) of the inferior macula (the cecocentral region) and the RGCs of the superior (blue circles) macula project to the temporal quadrant of the disc. A qualitative test of this assumption can be seen in Fig. 11A. The thin colored lines are the tracings of 1660 RNFL bundles from 55 eyes published by Jansonius et al. (2009), after they first aligned the foveal and disc centers of the eyes. Our model shows reasonable qualitative agreement with these tracings of RNFL bundles.
Figure 11.
A schematic model of RNFL projections and glaucomatous RGC+ and RNFL damage. (A) The schematic model in Fig. 10B superimposed upon tracings of 1660 RNFL bundles from 55 eyes, modified from Fig. 2A in Jansonius et al. (2009), with permission. (B) The schematic model superimposed upon patterns of RGC+ and RNFL damage as in Fig. 10A. The RNFL bundles (dashed black curves) of the RGC just outside the macula project to the regions (red arcs) of the superior (S) and inferior (I) quadrants of the disc, which show the most RNFL damage.
Second, we assume that the probability of glaucomatous damage at the disc increases from the center of the temporal quadrant (9:00 o'clock for the right eye) toward the superior and inferior poles. We assume further that the disc regions with the highest probability of damage are indicated by the red arcs around the disc in Fig. 10A and are drawn to correspond to the regions showing the greatest RNFL thinning in patients. These regions include the thickest portions of the RNFL in healthy controls (Fig. 10B).
Combining these assumptions, the region of the macula most likely to be damaged by glaucoma falls within the red borders in Figs. 10B and 11A. While the superior macular region within the dark gray borders also can be affected by glaucoma, it is less likely to be so. The boundaries of the macular RNFL bundles (the region within the gray and red borders) were set by the dotted RNFL bundles in Fig. 10A. RGCs outside these regions project to more superior and inferior locations as illustrated in Fig. 11B, where the regions of the model are superimposed upon the thinning maps from Fig. 10A. Note: the blue and red circles and dotted black curves show the proposed relationship between RNFL bundles outside the macula and the RNFL thinning seen in the inferior and superior quadrants of the disc. Thus, both the superior and inferior retinal regions just outside the macula will also be relatively vulnerable to glaucomatous damage. These are the regions associated with the classic arcuate defects on VFs.
A few caveats are in order. First, we call this a schematic model because the details of the pathways of the RNFL bundles need to be more precisely determined. Second, unlike the illustration of the model, the borders between the relatively preserved (gray) and the relatively affected (red) regions are not sharp. Recall also that the borders were based upon locations of maximum RNFL thinning in Fig. 9, not the full extent of this thinning. Third, there may be some diffuse damage across the macula associated with early glaucoma (e.g. Henson et al., 1999) and this could affect the entire macular region to some extent. Fourth, we expect that the details of the mapping between local RGC and optic disc locations will differ among individuals (e.g. Garway-Heath et al., 2000a, 2000b; Hood et al., 2008a; Hood and Kardon, 2007). Finally, we want to emphasize again, we are not saying that glaucoma, even in early stages, does not affect the superior macula (inferior VF). We do, however, expect inferior VF defects to be less common, and involve less of the macula, as discussed in the next section.
4.4. Visual field defects in the macula and the schematic model
Various aspects of macular damage seen on VFs can be understood based upon the schematic model of macular damage. It is generally found that macular damage in the upper, as opposed to lower, VF tends to be more common, and closer to fixation and the midline (e.g. Aulhorn and Karmeyer, 1977; Nicholas and Werner, 1980; Heijl and Lundqvist, 1984; Schiefer et al., 2010; Hood et al., 2011b; Park et al., 2011; Su et al., in press). The counterparts to these VF findings can be seen in Fig. 11B where the RGC+ thinning in the inferior macula is more severe than in the superior macula. (According to the model, this region within the red borders projects largely to the MVZ of the disc.) The early VF damage seen in Fig. 1 of Aulhorn and Karmeyer (1977) shows striking agreement with Fig. 11B. Recall that they found that the earliest VF defects occurred in both the upper and lower arcuate regions (15°) of the VF, but largely the upper, not lower, macular (5°) VF region.
To understand results seen on 10-2 VF tests, the 10-2 VF points, morphed to take into consideration RGC displacement as explained in Section 3.3 and Fig. 8, are shown in Fig. 12A, where they are added to the OCT maps of Fig. 11B. Fig. 12B shows the 10-2 VF for the eye with the initial macular arcuate defect from Fig. 9A, along with 3 other examples of such defects from Hood et al. (2011b). The red border indicates the portion of the VF corresponding to the vulnerable region of the macula in panel A. Our model predicts that early arcuate damage to the macula should fall disproportionately within this region with the red borders, as well as above this region due to traditional arcuate damage. The 10-2 VF data are consistent with this prediction. In addition to Fig. 12B, see Figs. 2, 3 and 5 in (Hood et al., 2011b).
Figure 12.
The schematic model predicts the arcuate defects of initial macular damage and the “central isle” of relative preservation in the macula of advanced glaucoma patients. (A) The schematic model superimposed upon RGC+ and RNFL thinning in glaucoma as in Fig. 10A with 10-2 field points superimposed after correction for displacement. (B) The 10-2 VF for the eye with the initial macular arcuate defect from Fig. 9A is shown along with the 10-2 VFs for 3 other eyes with similar defects from Hood et al. (2011b). The region within the red borders corresponds to the vulnerable region within the red borders of panel A and Fig. 11. (C) Several examples of 10-2 VFs of advanced glaucoma patients with a “central isle” of relative preservation. Note that the shaded VF regions within the dark gray borders, which correspond to the region within the dark gray borders in A, are less likely to be damaged according to the schematic model.
The schematic model also predicts the shape of a macular region that is “less vulnerable” to glaucomatous damage. It is often said that the maculo-papillary bundle (MPB) is relatively unaffected in early to moderate glaucoma. Plant and Perry (1990) pointed out that there is no anatomically distinct MPB and that the term is used in different ways by different investigators. If by MPB one means the RNFL bundles between the nasal side of the fovea and the disc, then this region is in our “less vulnerable” region of Fig. 11B and often preserved until advanced stages of glaucoma. However, we suggest that it is better to think of the relatively preserved macular region as the region associated with the temporal quadrant of the disc; that is, the shaded region within the dark gray borders in Fig. 12A.
It is well known that VFs, even in advanced glaucoma, can show a relatively preserved central region (e.g. Aulhorn and Harms, 1967; Aulhorn and Karmeyer, 1977; Weber et al., 1989). Fig. 12C shows the 10-2 fields of 8 of Drs. R. Ritch and J. Liebmann's patients with extensive macular damage. Note that all the VFs in Fig. 12C have extensive upper VF defects, while there is a range of damage in the lower VF. The VFs in the upper row of Fig.12C resemble the preserved “central isle” described by Weber et al. (1989), who attributed the preserved region to an intact maculo-papillary bundle.
The schematic model predicts the general shape of the “central isle” of the VF, but associates it with the temporal quadrant, not a maculo-papillary bundle. The gray shaded region within the dark gray border in Fig. 12C indicates the portion of the VF corresponding to the less vulnerable region of the macula based upon the schematic model in Fig. 12A. Notice that the VF defects seen in the upper hemifield in Fig. 12C typically do not include 2 or more of the 5 test points within the blue ellipse within the gray region. These 5 points corresponds to the 5 points within the blue ellipse in Fig. 12A, a region of the inferior retina that, on average, projects to the temporal disc. Further, the damage in the lower field is predicted to be less extreme, as this region projects, on average, to the temporal disc.
Of course, we do not expect perfect agreement between the gray regions in Fig. 12A,C. That is, it should not surprise us that abnormal VF points fall within the gray regions in Fig. 12C. First, there is considerable variability in VF values in and near regions of extensive loss. Second, we call the gray region “relatively preserved” as it will shrink as glaucoma progresses (see Fig. 10 in Aulhorn and Harms, 1967). Third, we should expect individual differences in the mapping of RGCs to the disc. Fourth, the borders of our schematic model are sharp, and RNFL damage is not. Finally, the temporal quadrant is an arbitrary division of the disc. It is not the temporal quadrant, per se, that is important, but rather some morphological characteristic(s) associated with this quadrant. From the work of Quigley and colleagues, we know that there are structural differences in the lamina cribrosa (Quigley and Addicks, 1981; Dandona et al., 1990). In particular, there is less connective tissue in the temporal and nasal quadrants, and the pores through which RNFL bundles pass are smaller than those in the inferior and superior quadrants. However, the temporal and nasal quadrants are also the regions where the RNFL is thin compared to the inferior and superior quadrants (Fig. 10B). Thus, it is not clear whether it is pore size, RNFL density (Hood et al., 2012) or some other aspect of disc/optic nerve head anatomy that best correlates with glaucomatous damage. In any case, the important morphological difference need not correspond to the quadrant borders.
5. Structure (fdOCT) versus function (visual fields) comparisons of macular damage
As we have seen, regions in which the macular RGC+ layer is thinner than normal correspond, at least qualitatively, to areas of abnormal points on VFs obtained with static automated perimetry. For example, there is more macular damage in the upper VF (lower retina) than in the lower VF and the damage is often arcuate in nature. How can we best combine OCT and VF information to most accurately detect glaucomatous damage? Before considering this question, we need to establish the feasibility of comparing local VF defects to local RGC+ thinning. In particular, how good is the quantitative relationship between local changes in RGC+ thickness and local loss in VF sensitivity? To answer this question, we compared RGC+ thickness from fdOCT scans to the VF loss measured with a 10–2 test pattern. The 10–2 pattern, with test points spaced every 2° starting ±1° from the foveal center, has 32 points within the central 8° as compared to only 4 points in the case of the 24-2 pattern (Fig. 8).
5.1. Local macular RGC+ thickness versus local visual field loss
The agreement between local RGC+ and 10–2 VF loss is good as long as the displacement of the central RGCs, as described above, is taken into consideration (Raza et al., 2011). Fig. 13 shows the locations of the 10–2 VF test points on the fundus before (panel A) and after (panel B) accounting for the RGC displacement as specified in Drasdo et al. (2007).
The importance of accounting for the displacement of RGC+ is illustrated in Fig. 13C,D. The local RGC+ thickness versus local field loss for the center 4 points (green circle in panels A and B) is shown before (C) and after (D) accounting for displacement. Due to both intra- and inter-individual sources, there will always be variability in structure–function maps such as in Fig. 13C (Hood et al., 2009). However, the variability in Fig. 13C is considerably reduced by accounting for RGC+ displacement as in Fig. 13D.
The smooth curve in Fig. 13D is the prediction of a model that assumes the loss in RGC+ thickness is a linear function of VF loss (in linear units). [That is, a 3 dB loss is associated with a 50% decrease in RGC+ thickness (Hood et al., 2007; Hood and Kardon, 2007).] As noted by Raza et al, the RGC+ loss is greater than expected based upon this model. They suggest that models that include spatial summation/cortical pooling (Garway-Heath et al., 2000b; Swanson et al., 2004) or neuronal remodeling (Morgan, 2002) might explain the results.
In any case, the agreement between VF and OCT measures suggests that they can be compared directly to help the clinician assess glaucomatous damage.
6. A method for improving detection of macular damage
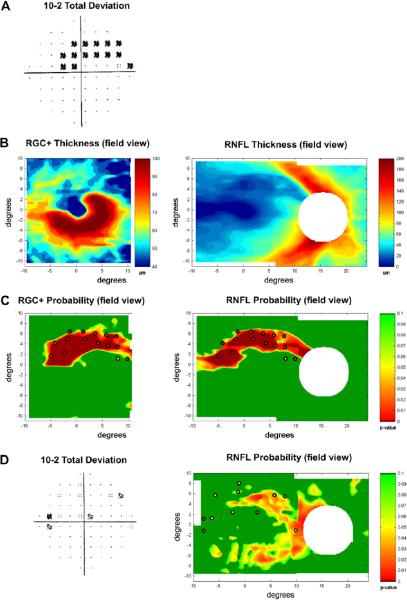
To improve detection of glaucomatous damage to the macula, we have recently suggested a procedure for combining information from VF and fdOCT RGC+ and RNFL measures. Our approach is illustrated in Fig. 14 for the patient whose 10–2 field is shown in Fig. 14A. First, the patients, RGC+ and RNFL maps (shown in field view in panel B) are converted to probability maps (C) by comparing the thickness at each point with that of controls. In this map, green indicates that the thinning is not statistically significant (p > 0.1), while the other colors indicate thinning is significant, ranging from p < 0.05 (yellow) to p < 0.01 (red) to p < 0.001 (dark red). Next, the significant VF points (from Fig. 14A) are superimposed in Fig. 14C, taking RGC displacement into consideration. For now, the significance of the 10–2 points are taken from the 10–2 report and are coded yellow (p ≤ 0.05) or red (p ≤ 0.01). Ultimately, the VF probabilities will be coded on a continuous as suggested by Wall et al., 2009.
Figure 14.
A method for detecting macular damage. (A) A right eye with a macular arcuate defect on the 10-2 VF. (B) The RGC+ (left panel) and RNFL (right panel) thickness plots in field view for the patient with a macular arcuate defect shown in A. (C) Continuous probability maps comparing the patient's RGC+ (left) and RNFL (right) thickness to controls (see calibration bar for significance levels). The abnormal 10-2 visual field points from panel A are superimposed. (D) An example where the combined VF and fdOCT RNFL probability maps (right panel) suggest arcuate damage, while the total deviation map (left panel) of the patient's 10-2 VF is ambiguous. Modified from Hood and Raza (2011).
While the value added by this approach has yet to be quantified, the clinical usefulness appears obvious. Consider the 10–2 from a glaucoma suspect in Fig. 14D. Most glaucoma experts would be reluctant to say this patient had glaucoma based upon this VF. However, when the abnormal 10–2 points are superimposed upon this patient's RNFL probability map, there appears to be arcuate damage present.
7. Individual differences and the position of the optic disc
As we stated earlier, on average, the center of the optic disc falls about 6° above the horizontal midline through the center of the fovea. This anatomical asymmetry is undoubtedly the basis of the asymmetrical representation of the upper and lower macular regions at the optic disc. (For example, RGC bundles traveling from equivalent locations in the superior and inferior macular regions and with equivalent arc-like paths will intersect the disc in different locations as can be seen in Fig. 10A.) In any case, it is important to understand the variability among individuals in the position of the disc relative to the macula and the extent to which it might affect the location of the MVZ.
In fact, there is considerable variability among individuals. For example, we measured the location of the foveal and disc centers in our sample of 128 eyes studied in Figs. 4 and 5. On average, the angle of vertical displacement of the center of the disc was 6.3° above the center of the fovea with individuals ranging from −1.95° below the center of the fovea to 13.96° above. In addition, the horizontal distance between the center of the fovea and the disc ranged from 11.79 to 16.93°, with an average of 14.8°.
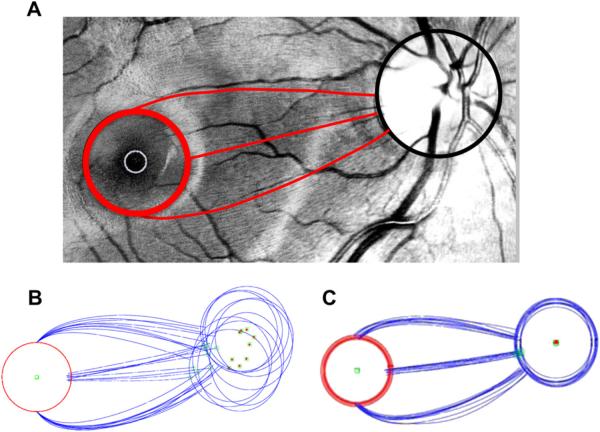
Jansonius et al. (2009) substantially reduced individual differences in RNFL bundle projections by rotating and scaling the fundus images so that the centers of the fovea and disc were aligned (Schiefer et al., 2003). To confirm this scaling assumption, 9 fundus photos were selected by Dr. Randy Kardon at the University of Iowa from a large set based upon the clarity of the fiber bundles (Nguyen et al. ARVO, 2012 abstract). A circle with a radius of 4.8° was centered on the fovea as shown by the red circle in Fig. 15A. The path of the bundles from each of 3 locations on this circle (12, 3, and 6 o'clock) was traced to the optic disc. Fig. 15B shows the average tracings made by two observers for each of 9 eyes. The eyes are aligned at the center of the fovea. The centers of the optic discs varied in their location as shown by the green circles. Fig. 15C shows the same results after scaling and rotating to bring the disc centers into register. Although some inter-individual variation remains, scaling and rotating, as suggested previously (Schiefer et al., 2003; Jansonius et al., 2009), brought the RNFL bundle tracings approximately into agreement.
Figure 15.
Changes in the RNFL bundle projections with different locations of the optic disc. (A) A digitally red-filtered fundus photo with tracings of 3 RNFL bundles in red. (B) Tracings as in panel A for 11 eyes. The green square with the red dot is the center of the optic disc. The open green square is the location on the disc associated with the RNFL originating at the 3 o'clock position on the red circles around the fovea. (C) Tracings from panel B after scaling and rotating to align the centers of the optic discs.
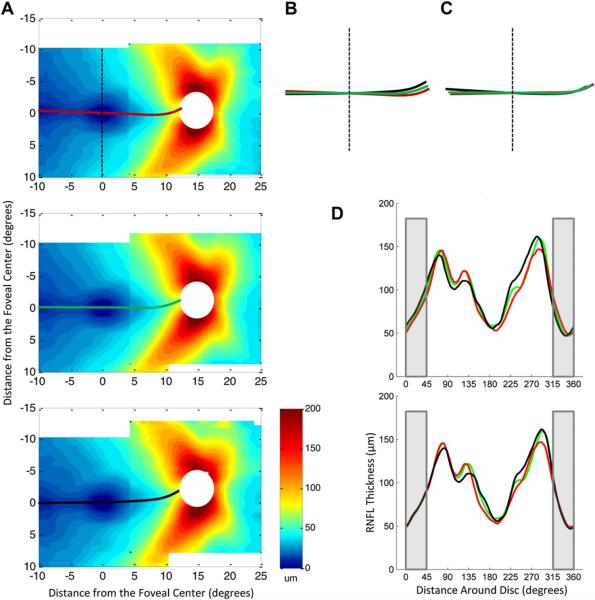
However, this only tests the scaling/rotating assumption for the maculo-papillary region. For example, is the raphe (i.e. the RNFL thickness minimum on the temporal side of the fovea) also rotated in individuals with discs located particularly high or particularly low relative to the fovea? It is difficult to see the RNFL bundles in the temporal retina, but we can use our fdOCT data to answer this question. For this analysis, we divided the 128 controls into 3 groups based upon the angle of vertical displacement of the disc relative to the fovea: smallest angle [−1.95−4.24° (<mean – 2°, n = 33)]; typical angle [4.33–8.21° (mean ± 2°, n = 65)]; and largest angle [8.36–13.96° (>mean + 2°, n = 30)]. [Note: the disc border is defined based upon identification of the opening in Bruch's membrane, as seen on the fdOCT. This provides a more accurate estimate of the center of the disc than is possible based upon marking the disc center on fundus photographs (Reis et al., 2012)].
The RNFL thickness maps are shown in Fig. 16A for the 3 groups, ordered from the least to the most elevated. The solid red, green and black lines are the loci of minimum RNFL thicknesses for the groups with the smallest, typical and largest angles, respectively. While the location of the center of the disc differed across the 3 groups as expected, the location of the horizontal raphe was similar. This can be seen in panel B where the colored lines from panel A are superimposed. On the other hand, the RNFL contours clearly differ near the disc. This difference is minimized in Fig. 16C after the centers of the discs are aligned by rotating the contours in panel B. However, after this correction, the raphes (left of the vertical dashed line) are no longer aligned. The general message is clear. No simple scaling/rotating will bring these RNFL maps into agreement. A non-linear morphing is needed (Jansonius et al., 2009).
Figure 16.
Variation in the RNFL thickness distributions among healthy controls with different angles of vertical displacement of the optic disc relative to the fovea. (A) RNFL thickness distributions of controls divided into groups based on the angle of vertical displacement of the optic disc, with the RNFL minimum marked by bold lines. The top group (red line for minimum) had the smallest angle [−1.95–4.24° (<mean 2°, n = 33)], the middle group (green line) had the typical angle [4.33–8.21° (mean ± 2°, n = 65)], and the bottom group (black line) had the largest angle [8.36–13.96° (>mean + 2°, n = 30)]. (B) The minima from the three groups in A, superimposed. (C) Rotation of the minima in B based on median optic disc elevation of each group. (D) Circumpapillary RNFL profiles of each group in A, before (top) and after (bottom) a rotational correction based on the optic disc elevation of each group. The gray shaded area indicates the region corresponding to the temporal quadrant of the optic disc.
While a simple rotation will not bring the entire RNFL profiles into agreement, it should improve the agreement among individuals for the important portion of the RNFL maps between the fovea and the disc. This is illustrated in Fig. 16D, which compares the circumpapillary RNFL profiles around a 3.4 mm circle before (upper) and after (lower) rotating by the average fovea-disc angle for each group. While the agreement is reasonable before rotation (R2 = 0.960), it is improved after rotation (R2 = 0.976). This is especially true for the temporal quadrant, the region within the gray rectangles in Fig. 16D, where R2 improved from 0.900 to 0.987. Thus, rotating RNFL data to compensate for fovea-to-disc angle should help reduce variability among individual RNFL maps between the fovea and the disc. It will also reduce overall RNFL variability introduced by rotation of the head/eye during scanning (Patel et al., 2012). However, it is undoubtedly not the best way to correct for macular differences. Thus, from a practical point of view it is better to rotate the data after the scan via software algorithms, rather than changing the orientation of the scan.
8. Conclusions and future directions
Clinicians need to be aware that glaucomatous damage of the macula is common, can occur early in the disease, and can be missed and/or underestimated with standard VF tests that use a 6°grid, such as the 24-2 VF test. Here we reviewed fdOCT studies of macular damage due to glaucoma. In addition to the thinning of the RNFL in the arcuate regions near the disc, thinning of the macular RGC+ layer also can be seen even in glaucoma suspects with VFs classified as normal. In general, however, local macular thinning of the RGC+ layer shows good agreement with VF loss measured with a 2° grid (10–2 test) as long as the displacement of the RGCs is taken into consideration. The damage to the macula is typically arcuate in nature and most severe in the inferior retina (superior field). According to our schematic model, macular RGCs in the high-risk area of the inferior retina project to a region of the disc we call the MVZ. The MVZ of the disc is largely in the inferior quadrant along its border with the temporal quadrant. The superior region of the macula (inferior VF), as well as the cecocentral region of the inferior macula, is less affected by glaucoma, although not unaffected. The RGCs of this less-affected region project to the temporal quadrant of the disc, a region known to be less susceptible to glaucomatous damage. While our understanding of the macular damage has increased in recent years, there is a need for further work.
8.1. Understanding macular damage
It is clear that glaucomatous damage of the macula typically involves arcuate damage in the RNFL. However, is early macular damage always associated with local RNFL damage at the disc? And, why is the MVZ of the disc vulnerable to local damage? The MVZ is part of the high-density axon region known to be vulnerable to glaucomatous damage. We have hypothesized that the probability of damage is proportional to axon density (crowding hypothesis) (Hood et al., 2012) or some other morphological feature such as pore size, which is correlated with axon density. On the other hand, the susceptibility of this region may be due to other factors. Similarly, we have an incomplete understanding of why the temporal quadrant is less prone to glaucomatous damage.
Our understanding of the relationship between VF loss and RGC+ thinning is also incomplete. While a simple linear model describes the relationship between RNFL thinning and VF loss outside the macula (e.g. Hood and Kardon, 2007), it does not adequately describe the macular results (see solid curve in Fig. 13B). What is the underlying cause for a seemingly non-linear structure–function relationship? There is a need for a model grounded in physiology and anatomy (e.g. Swanson et al., 2004) that would explain these results.
In addition, as it is important to detect macular damage early, it is essential to identify those at risk. See for example, Park et al. (2011).
8.2. Improving clinical tests
The VF test based upon the 6° grid (e.g. 24-2 test) should be replaced. While others have suggested alternative patterns, there is no agreed upon alternative. A test pattern based upon anatomic models, such as our proposed schematic model of the macula, needs to be developed and tested. In addition, individual differences in anatomy should be considered. For example, to what extent should VF points be adjusted for differences in fovea-to-disc distance and angle (e.g. Schiefer et al., 2003)? A more radical approach would be to tailor the VF test based upon the regions of abnormality detected on a preceding fdOCT scan, as has been suggested for RNFL bundle thinning seen on fundus images (Schiefer et al., 2003). Finally, we should ask, under what conditions can an initial fdOCT test save our patients the time, trouble and expense of a VF test?
The fdOCT scans provide unprecedented views of glaucomatous damage and these scans have changed the way glaucomatous damage is detected and assessed. However, we are not making optimal use of these data. First, our ability to compare the changes seen on these scans with defects seen on traditional VFs is limited. While a direct comparison of probability maps derived from fdOCT and VFs (see Fig. 14C and Hood and Raza, 2011) represents a step in the right direction, it is only the first step. In addition to refining this method, other techniques need to be tested. For example, using fdOCT RGC+ and RNFL thickness maps, Zhang et al. (2011) have recently derived predicted patterns of VF loss, which can be compared to the actual VF results. Second, while the fdOCT almost certainly has less intra-individual variability than the VF, there is considerable inter-individual variability (e.g. Hood et al., 2009). Methods to reduce this inter-individual variability are needed (e.g. see Section 7). Third, although a number of studies have found that measures of macular RGC and peripapillary RNFL thickness have similar sensitivity/specificity (e.g. Tan et al., 2009), we do not expect these measures to provide equivalent information. In particular, we expect macular RGC measures to be better at detecting macular damage, while peripapillary RNFL measures should do a better job of identifying damage outside the macula. We need to develop methods for combining the information from both. Fourth, we need more sophisticated analyses of the fdOCT data to, for example, recognize patterns of glaucomatous damage. Finally, this information needs to be presented in meaningful, easy to understand, clinical reports.
Acknowledgments
The preparation of this manuscript was supported by National Eye Institute grant RO1-EY-02115. We thank Drs. C.F. Burgoyne, B. Fortune, V. Greenstein, C.A. Johnson, R.H. Kardon, J.G. Odel, and the students in our laboratory during the summer of 2012 for their helpful discussions of this topic and/or comments on this manuscript.
Abbreviations
- fdOCT
frequency domain optical coherence tomography
- IPL
inner plexiform layer
- MD
mean deviation
- MPB
macular papillary bundle
- MVZ
macular vulnerability zone
- RNFL
retinal nerve fiber layer
- RGC
retinal ganglion cell
- RGC+
retinal ganglion cell plus inner plexiform layer
- TSNIT
temporal, superior, nasal, inferior, temporal
- VF
visual field.
References
- Airaksinen PJ, Heijl A. Visual field and retinal nerve fibre layer in early glaucoma after optic disc haemorrhage. Acta Ophthalmol. (Copenh.) 1983;61:186–194. doi: 10.1111/j.1755-3768.1983.tb01412.x. [DOI] [PubMed] [Google Scholar]
- Anctil J-L, Anderson DR. Early foveal involvement and generalized depression of the visual field in glaucoma. Arch. Ophthalmol. 1984;102:363–370. doi: 10.1001/archopht.1984.01040030281019. [DOI] [PubMed] [Google Scholar]
- Araie M. Pattern of visual field defects in normal-tension and high-tension glaucoma. Curr. Opin. Ophthalmol. 1995;6:36–45. doi: 10.1097/00055735-199504000-00007. [DOI] [PubMed] [Google Scholar]
- Aulhorn E, Harms M. Early visual field defects in glaucoma. In: Leydhecker W, editor. Glaucoma, Tutzing Symposium. Karger, Basel: 1967. pp. 151–186. [Google Scholar]
- Aulhorn E, Karmeyer H. Frequency distribution in early glaucomatous visual field defects. Doc. Ophthalmol. Proc. Ser. 1977;14:75–83. [Google Scholar]
- Bixenman WW, von Noorden GK. Apparent foveal displacement in normal subjects and in cyclotropia. Ophthalmology. 1982;89:58–62. doi: 10.1016/s0161-6420(82)34862-9. [DOI] [PubMed] [Google Scholar]
- Budenz DL, Anderson DR, Varma R, Schuman J, Cantor L, Savell J, Greenfield DS, Patella VM, Quigley HA, Tielsch J. Determinants of normal retinal nerve fiber layer thickness measured by Stratus OCT. Ophthalmology. 2007;114:1046–1052. doi: 10.1016/j.ophtha.2006.08.046. [DOI] [PMC free article] [PubMed] [Google Scholar]
- Curcio CA, Allen KA. Topography of ganglion cells in human retina. J. Comp. Neurol. 1990;300:5–25. doi: 10.1002/cne.903000103. [DOI] [PubMed] [Google Scholar]
- Curcio CA, Messinger JD, Sloan KR. Human choroidal layer thicknesses measured in macula-wide, high-resolution histologic sections. Retina. 2011;52:3943–3954. doi: 10.1167/iovs.10-6377. [DOI] [PMC free article] [PubMed] [Google Scholar]
- Dandona L, Quigley HA, Brown AE, Enger C. Quantitative regional structure of the normal human lamina cribrosa. A racial comparison. Arch. Ophthalmol. 1990;108:393–398. doi: 10.1001/archopht.1990.01070050091039. [DOI] [PubMed] [Google Scholar]
- de A Moura AL, Raza AS, Lazow MA, de Moraes CGV, Hood DC. Retinal ganglion cell and inner plexiform layer thickness in regions of severe visual field sensitivity loss in patients with glaucoma. Eye. 2012;26:1188–1193. doi: 10.1038/eye.2012.110. [DOI] [PMC free article] [PubMed] [Google Scholar]
- Drance SM. Some studies of the relationships of hemodynamics and ocular pressure in open-angle glaucoma. Trans. Ophthalmol. Soc. U. K. 1969;88:633–640. [PubMed] [Google Scholar]
- Drance SM. The visual field of low tension glaucoma and shock induced optic neuropathy. Arch. Ophthalmol. 1977;95:1359–1361. doi: 10.1001/archopht.1977.04450080069004. [DOI] [PubMed] [Google Scholar]
- Drasdo N, Millican CL, Katholi CR, Curcio CA. The length of Henle fibers in the human retina and a model of ganglion receptive field density in the visual field. Vis. Res. 2007;47:2901–2911. doi: 10.1016/j.visres.2007.01.007. [DOI] [PMC free article] [PubMed] [Google Scholar]
- Gabriele ML, Wollstein G, Ishikawa H, Xu J, Kim J, Kagemann L, Folio LS, Schuman JS. Three dimensional optical coherence tomography imaging: advantages and advances. Prog. Retin. Eye Res. 2010;29:556–579. doi: 10.1016/j.preteyeres.2010.05.005. [DOI] [PMC free article] [PubMed] [Google Scholar]
- Garway-Heath DF, Poinoosawmy D, Fitzke FW, Hitchings RA. Mapping the visual field to the optic disc in normal tension glaucoma eyes. Ophthalmology. 2000a;107:1809–1815. doi: 10.1016/s0161-6420(00)00284-0. [DOI] [PubMed] [Google Scholar]
- Garway-Heath DF, Caprioli J, Fitzke FW, Hitchings RA. Scaling the hill of vision: the physiological relationship between light sensitivity and ganglion cell numbers. Invest. Ophthalmol. Vis. Sci. 2000b;41:1774–1782. [PubMed] [Google Scholar]
- Harrington DO, Drake MV. The Visual Fields: Text and Atlas of Clinical Perimetry. Mosby (Elsevier); St. Louis, MO: 1990. [Google Scholar]
- Heijl A, Lundqvist L. The frequency distribution of earliest glaucomatous visual field defects documented by automated perimetry. Acta Ophthalmol. 1984;62:657–664. doi: 10.1111/j.1755-3768.1984.tb03979.x. [DOI] [PubMed] [Google Scholar]
- Henson DB, Artes PH, Chauhan BC. Diffuse loss of sensitivity in early glaucoma. Invest. Ophthalmol. Vis. Sci. 1999;40:3147–3151. [PubMed] [Google Scholar]
- Hood DC, Kardon RH. A framework for comparing structural and functional measures of glaucomatous damage. Prog. Retin. Eye Res. 2007;26:688–710. doi: 10.1016/j.preteyeres.2007.08.001. [DOI] [PMC free article] [PubMed] [Google Scholar]
- Hood DC, Raza AS. Method for comparing visual field defects to local RNFL and RGC damage seen on frequency domain OCT in patients with glaucoma. Biomed. Opt. Exp. 2011;2:1097–1105. doi: 10.1364/BOE.2.001097. [DOI] [PMC free article] [PubMed] [Google Scholar]
- Hood DC, Anderson SC, Wall M, Kardon RH. Structure versus function in glaucoma: an application of a linear model. Invest. Ophthalmol. Vis. Sci. 2007;48:3662–3668. doi: 10.1167/iovs.06-1401. [DOI] [PubMed] [Google Scholar]
- Hood DC, Anderson S, Rouleau J, Wenick AS, Grover LK, Behrens MM, Odel JG, Lee AG, Kardon RH. Retinal nerve fiber structure versus visual field function in patients with ischemic optic neuropathy: a test of a linear model. Ophthalmology. 2008a;115:90–101. doi: 10.1016/j.ophtha.2007.06.001. [DOI] [PMC free article] [PubMed] [Google Scholar]
- Hood DC, Fortune B, Arthur SN, Xing D, Salant JA, Ritch R, Liebmann JM. Blood vessel contributions to retinal nerve fiber layer thickness profiles measured with optical coherence tomography. J. Glaucoma. 2008b;17:519–528. doi: 10.1097/IJG.0b013e3181629a02. [DOI] [PMC free article] [PubMed] [Google Scholar]
- Hood DC, Anderson SC, Wall M, Raza AS, Kardon RH. A test of a linear model of glaucomatous structure–function loss reveals sources of variability in retinal nerve fiber and visual field measurements. Invest. Ophthalmol. Vis. Sci. 2009;127:875–881. doi: 10.1167/iovs.08-2697. [DOI] [PMC free article] [PubMed] [Google Scholar]
- Hood DC, Cho J, Raza AS, Dale EA, Wang M. Reliability of a computeraided manual procedure for segmenting optical coherence tomography scans. Optom. Vis. Sci. 2011a;88:113–123. doi: 10.1097/OPX.0b013e3181fc3625. [DOI] [PMC free article] [PubMed] [Google Scholar]
- Hood DC, Raza AS, de Moraes CGV, Odel JG, Greensten VC, Liebmann JM, Ritch R. Initial arcuate defects within the central 10 degrees in glaucoma. Invest. Ophthalmol. Vis. Sci. 2011b;52:940–946. doi: 10.1167/iovs.10-5803. [DOI] [PMC free article] [PubMed] [Google Scholar]
- Hood DC, Raza AS, de Moraes CGV, Johnson CA, Liebmann JM, Ritch R. The nature of macular damage in glaucoma as revealed by averaging optical coherence tomography data. Trans. Vis. Sci. Tech. 2012;1:1–15. doi: 10.1167/tvst.1.1.3. [DOI] [PMC free article] [PubMed] [Google Scholar]
- Jansonius NM, Nevalainen J, Selig B, Zangwill LM, Sample PA, Budde WM, Jonas JB, Lagrèze WA, Airaksinen PJ, Vonthein R, Levin LA, Paetzold J, Schiefer U. A mathematical description of nerve fiber bundle trajectories and their variability in the human retina. Vis. Res. 2009;49:2157–2163. doi: 10.1016/j.visres.2009.04.029. [DOI] [PMC free article] [PubMed] [Google Scholar]
- Keltner JL, Johnson CA, Cello KE, Edwards MA, Bandermann SE, Kass MA, Gordon MO. Classification of visual field abnormalities in the ocular hypertension treatment study. Arch. Ophthalmol. 2003;121:643–650. doi: 10.1001/archopht.121.5.643. [DOI] [PubMed] [Google Scholar]
- Lan YW, Wang IJ, Hsiao YC, Sun FJ, Hsieh JW. Characteristicsof disc hemorrhage in primary angle-closure glaucoma. Ophthalmology. 2008;115:1328–1333. doi: 10.1016/j.ophtha.2007.10.041. [DOI] [PubMed] [Google Scholar]
- Langerhorst CT, Carenini LL, Bakker D, De Bie-Raakman MAC. Measurements for description of very early glaucomatous field defects. In: Wall M, Heiji A, editors. Perimetry Update 1996/1997. Kugler Publications; New York, NY: 1997. pp. 67–73. [Google Scholar]
- Lefèvre F, Leroy K, Delrieu B, Rao HL, Alencar LM, Medeiros FA. Study of the optic nerve head-fovea angle with retinophotography in healthy patients. J. Fr. Ophthalmol. 2007;30:598–606. doi: 10.1016/s0181-5512(07)89664-1. [DOI] [PubMed] [Google Scholar]
- Leite MT, Zangwill LM, Weinreb RN, Rao HL, Alencar LM, Medeiros FA. Structure–function relationships using the Cirrus spectral domain optical coherence tomograph and standard automated perimetry. J. Glaucoma. 2012;21:49–54. doi: 10.1097/IJG.0b013e31822af27a. [DOI] [PMC free article] [PubMed] [Google Scholar]
- Lewis RA, Phelps CD. A comparison of visual field loss in primary open-angle glaucoma and the secondary glaucomas. Ophthalmologica. 1984;189:41–48. doi: 10.1159/000309383. [DOI] [PubMed] [Google Scholar]
- Morgan JE. Retinal ganglion cell shrinkage in glaucoma. J. Glaucoma. 2002;11:365–370. doi: 10.1097/00061198-200208000-00015. [DOI] [PubMed] [Google Scholar]
- Mwanza JC, Durbin MK, Budenz DL, Girkin CA, Leung CK, Liebmann JM, Peace JH, Werner JS, Wollstein G. Cirrus OCT Normative Database Study Group. Profile and predictors of normal ganglion cell-inner plexiform layer thickness measured with frequency-domain optical coherence tomography. Invest. Ophthalmol. Vis. Sci. 2011;52:7872–7879. doi: 10.1167/iovs.11-7896. [DOI] [PubMed] [Google Scholar]
- Nguyen M, Fernandes DB, de Moraes CG, Raza AS, Joyner T, Sliesoraityte I, Kardon RH, Schiefer U, Ritch R, Hood DC. Test of a Descriptive Model of the Borders of the Maculo-papillary Region. ARVO Abstract. 2012 [Google Scholar]
- Nicholas SP, Werner EB. Location of early glaucomatous visual field defects. Can. J. Ophthalmol. 1980;15:131–133. [PubMed] [Google Scholar]
- Ooto S, Hangai M, Tomidokoro A, Saito H, Araie M, Otani T, Kishi S, Matsushita K, Maeda N, Shirakashi M, Abe H, Ohkubo S, Sugiyama K, Iwase A, Yoshimura N. Effects of age, sex, and axial length on the three-dimensional profile of normal macular layer structures. Invest. Ophthalmol. Vis. Sci. 2011;52:8769–8779. doi: 10.1167/iovs.11-8388. [DOI] [PubMed] [Google Scholar]
- Parikh RS, Parikh SR, Sekhar GC, Prabakaran S, Babu JG, Thomas R. Normal age-related decay of retinal nerve fiber layer thickness. Ophthalmology. 2007;114:921–926. doi: 10.1016/j.ophtha.2007.01.023. [DOI] [PubMed] [Google Scholar]
- Park SC, De Moraes CG, Teng CC, Tello C, Liebmann JM, Ritch R. Initial parafoveal versus peripheral scotomas in glaucoma: risk factors and visual field characteristics. Ophthalmology. 2011;118:1782–1789. doi: 10.1016/j.ophtha.2011.02.013. [DOI] [PubMed] [Google Scholar]
- Patel NB, Wheat JL, Rodriquez A, Tran V, Harwerth RS. Agreement between retinal nerve fiber layer measures from Spectralis and Cirrus spectral domain OCT. Optom. Vis. Sci. 2012;89:652–666. doi: 10.1097/OPX.0b013e318238c34e. [DOI] [PMC free article] [PubMed] [Google Scholar]
- Plant GT, Perry H. The anatomical basis of the caecocentral scotoma: new observations and a review. Brain. 1990;113:1441–1457. doi: 10.1093/brain/113.5.1441. [DOI] [PubMed] [Google Scholar]
- Poinoosawmy D, Fontana L, Wu JX, Fitzke FW, Hitchings RA. Variation of nerve fibre layer thickness measurements with age and ethnicity by scanning laser polarimetry. Br. J. Ophthalmol. 1997;81:350–354. doi: 10.1136/bjo.81.5.350. [DOI] [PMC free article] [PubMed] [Google Scholar]
- Quigley HA, Addicks EM. Regional differences in the structure of the lamina cribrosa and their relation to glaucomatous optic nerve damage. Arch. Ophthalmol. 1981;99:137–143. doi: 10.1001/archopht.1981.03930010139020. [DOI] [PubMed] [Google Scholar]
- Rao HL, Babu JG, Addepalli UK, Senthil S, Garudadri CS. Retinal nerve fiber layer and macular inner retina measurements by spectral domain optical coherence tomograph in Indian eyes with early glaucoma. Eye. 2012;26:133–139. doi: 10.1038/eye.2011.277. [DOI] [PMC free article] [PubMed] [Google Scholar]
- Raza AS, Cho JS, de Moraes CGV, Wang M, Zhang X, Kardon RH, Liebmann JM, Ritch R, Hood DC. Retinal ganglion cell layer thickness and local visual field sensitivity in glaucoma. Arch. Ophthalmol. 2011;129:1529–1536. doi: 10.1001/archophthalmol.2011.352. [DOI] [PMC free article] [PubMed] [Google Scholar]
- Reis AS, Sharpe GP, Yang H, Nicolela MT, Burgoyne CF, Chauhan BC. Optic disc margin anatomy in patients with glaucoma and normal controls with spectral domain optical coherence tomography. Ophthalmology. 2012;119:738–747. doi: 10.1016/j.ophtha.2011.09.054. [DOI] [PMC free article] [PubMed] [Google Scholar]
- Rohrschneider K. Determination of the location of the fovea on the fundus. Invest. Ophthalmol. Vis. Sci. 2004;45:3257–3258. doi: 10.1167/iovs.03-1157. [DOI] [PubMed] [Google Scholar]
- Schiefer U, Flad M, Stumpp F, Malsam A, Paetzold J, Vonthein R, Denk PO, Sample PA. Increased detection rate of glaucomatous visual field damage with locally condensed grids: a comparison between fundus-oriented perimetry and conventional visual field examination. Arch. Ophthalmol. 2003;121:458–465. doi: 10.1001/archopht.121.4.458. [DOI] [PubMed] [Google Scholar]
- Schiefer U, Papageorgiou E, Sample PA, Pascual JP, Selig B, Krapp E, Paetzold J. Spatial pattern of glaucomatous visual field loss obtained with regionally condensed stimulus arrangements. Invest. Ophthalmol. Vis. Sci. 2010;51:5685–5689. doi: 10.1167/iovs.09-5067. [DOI] [PMC free article] [PubMed] [Google Scholar]
- Schuman JS, Pedut-Kloizman T, Hertzmark E, Hee MR, Wilkins JR, Coker JG, Puliafito CA, Fujimoto JG, Swanson EA. Reproducibility of nerve fiber layer thickness measurements using optical coherence tomography. Ophthalmology. 1996;103:1889–1898. doi: 10.1016/s0161-6420(96)30410-7. [DOI] [PMC free article] [PubMed] [Google Scholar]
- Stamper RL. The effect of glaucoma on central visual function. Trans. Am. Ophthalmol. Soc. 1984;82:792–826. [PMC free article] [PubMed] [Google Scholar]
- Su D, Park SC, Simonson JL, Liebmann JM, Ritch R. Progression pattern of initial parafoveal scotomas in glaucoma. Ophthalmology. doi: 10.1016/j.ophtha.2012.08.018. in press. [DOI] [PubMed] [Google Scholar]
- Swanson WH, Felius J, Pan F. Perimetric defects and ganglion cell damage: interpreting linear relations using a two-stage neural model. Invest. Ophthalmol. Vis. Sci. 2004;45:466–472. doi: 10.1167/iovs.03-0374. [DOI] [PubMed] [Google Scholar]
- Tan O, Chopra V, Lu AT, Schuman JS, Ishikawa H, Wollstein G, Varma R, Huang D. Detection of macular ganglion cell loss in glaucoma by Fourier-domain optical coherence tomography. Ophthalmology. 2009;116:2305–2314. doi: 10.1016/j.ophtha.2009.05.025. [DOI] [PMC free article] [PubMed] [Google Scholar]
- Timberlake GT, Sharma MK, Grose SA, Gobert DV, Gauch JM, Maino JH. Retinal location of the preferred retinal locus relative to the fovea in scanning laser ophthalmoscope images. Optom. Vis. Sci. 2005;82:177–185. doi: 10.1097/01.opx.0000156311.49058.c8. [DOI] [PubMed] [Google Scholar]
- Traynis I, de Moraes CG, Raza AS, Liebmann JM, Ritch R, Hood DC. The Prevalence and Nature of Glaucomatous Defects in the Central 10° of the Visual Field. ARVO Abstract. 2012 doi: 10.1001/jamaophthalmol.2013.7656. [DOI] [PMC free article] [PubMed] [Google Scholar]
- Wall M, Johnson CA, Kardon RH, Crabb DP. Use of a continuous probability scale to display visual field damage. Arch. Ophthalmol. 2009;127:749–756. doi: 10.1001/archophthalmol.2009.111. [DOI] [PubMed] [Google Scholar]
- Wang M, Hood DC, Cho JS, Ghadiali Q, De Moraes GV, Zhang X, Ritch R, Liebmann JM. Measurement of local retinal ganglion cell layer thickness in patients with glaucoma using frequency-domain optical coherence tomography. Arch. Ophthalmol. 2009;127:875–881. doi: 10.1001/archophthalmol.2009.145. [DOI] [PMC free article] [PubMed] [Google Scholar]
- Weber J, Schultze T, Ulrich H. The visual field in advanced glaucoma. Int. Ophthalmol. 1989;13:47–50. doi: 10.1007/BF02028637. [DOI] [PubMed] [Google Scholar]
- Xin D, Talamini CL, Raza AS, de Moraes CG, Greenstein VC, Liebmann JM, Ritch R, Hood DC. Hypodense regions (“holes”) in the retinal nerve fiber layer in frequency-domain OCT scans of glaucoma patients and suspects. Invest. Ophthalmol. Vis. Sci. 2011;52:7180–7186. doi: 10.1167/iovs.11-7716. [DOI] [PMC free article] [PubMed] [Google Scholar]
- Yang Q, Resiman CA, Wang Z, Fukuma Y, Hangai M, Yoshimua N, Tomidokoro A, Araie M, Raza AS, Hood DC, Chan K. Automated layer segmentation of macular OCT images using dual-scale gradient information. Opt. Exp. 2010;18:21293–21307. doi: 10.1364/OE.18.021293. [DOI] [PMC free article] [PubMed] [Google Scholar]
- Zhang X, Bregman CJ, Raza AS, De Moraes G, Hood DC. Deriving visual field loss based upon OCT of inner retinal thicknesses of the macula. Biomed. Opt. Exp. 2011;2:1734–1742. doi: 10.1364/BOE.2.001734. [DOI] [PMC free article] [PubMed] [Google Scholar]


