Abstract
Most musculoskeletal models used to analyze human movement utilize Hill-type muscle models that account for state dependent intrinsic muscle properties (e.g., force-length velocity relationships), but rarely do these models include history dependent effects (e.g., force depression or enhancement). While the relationship between muscle shortening and force depression can be well characterized by muscle mechanical work, the relationship between muscle stretch and force enhancement is more complex. Further, it is not well known how these properties influence dynamic movements. Therefore, the goal of this study was to develop a modified Hill-type muscle model that incorporated stretch-induced force enhancement into a previously described model that included shortening-induced force depression. The modified muscle model was based on experimental data from isolated cat soleus muscles. Simulations of in situ muscle experiments were used to validate the model and simulations of a simple human movement task (counter-movement jumping) were used to examine the interactions of the history dependent effects. The phenomenological model of stretch-induced force enhancement was dependent on both the magnitude of stretch and relative length of the muscle fiber. Simulations of the in situ muscle experiments showed that the model could accurately reproduce force enhancement and force depression, as well as the complex additive relationship between these effects. Simulations of counter-movement jumping showed that a similar jump pattern could be achieved with and without history dependent effects and that a relatively minor change in muscle activation could mitigate the impact of these effects.
Keywords: biomechanics, forward dynamics simulation, muscle model, power, counter-movement jump
INTRODUCTION
The effect of muscle length changes on its ability to generate isometric force is well documented. Generally referred to as history dependent effects, several studies have shown that the isometric force produced by a muscle following active shortening is reduced relative to an isometric contraction at the same length with no prior shortening (e.g., Abbott and Aubert, 1952; Herzog, et al., 2000; Marechal and Plaghki, 1979). Conversely, muscles that are actively stretched produce higher isometric forces relative to muscles that were not stretched (e.g., Abbott and Aubert, 1952; Edman, et al., 1982; Herzog and Leonard, 2002; Hisey, et al., 2009). To date, the majority of these studies have focused on characterizing the relationships between the history of muscle length change and the resulting isometric force.
Shortening-induced force depression has been shown to be correlated with both the magnitude (e.g., Edman, 1975; Marechal and Plaghki, 1979) and rate (e.g., Marechal and Plaghki, 1979; Meijer, et al., 1998) of shortening; although Herzog and Leonard (1997) showed that force depression may be independent of velocity if the force remains constant during shortening. More recently, studies have shown that force depression is strongly correlated with the amount of mechanical work the muscle does during shortening (Herzog, et al., 2000; Josephson and Stokes, 1999; Kosterina, et al., 2008). The relationship between the time history of active stretch and force enhancement appears to be more complex. Force enhancement does not correlate with a simple scalar quantity such as muscle work, and the position of the muscle on the force length curve during stretch may have a substantial impact on the magnitude of force enhancement (Bullimore, et al., 2007; Edman, et al., 1978; Hisey, et al., 2009). On the descending limb of the force-length curve, the magnitude of force enhancement is directly related to the length of the stretch (e.g., Abbott and Aubert, 1952; Bullimore, et al., 2007; Edman, et al., 1978; Hisey, et al., 2009). However, stretches ending on the ascending limb and plateau region of the force-length curve produce relatively small amounts of force enhancement and are largely independent of the stretch length (e.g., Hisey, et al., 2009; Lee, et al., 2001; Peterson, et al., 2004). Studies have also shown that force depression and force enhancement are cumulative when a muscle shortens before stretching, but not when a muscle is first stretched and then shortened (e.g., Herzog and Leonard, 2000; Lee, et al., 2001).
Based on these empirical relationships, a number of studies have developed phenomenological models that incorporate history dependent effects into their estimates of force output (e.g., Ettema, 2002; Ettema and Meijer, 2000; Forcinito, et al., 1998; Meijer, et al., 1998; Williams, 2010). Of the studies that do include history dependent effects, few have used the models to examine their influence on dynamic movements (Ettema, 2002; Williams, 2010). In a recent study, we developed and validated a modified-muscle model that included shortening-induced force depression based on the relationship with mechanical work (McGowan, et al., 2010). The study showed that in maximal power pedaling, force depression has the potential to substantially reduce the amount of crank power that is produced by muscles. However, it is not clear to what extent force enhancement effects mechanical output, nor is it known to what degree force depression and force enhancement offset one another during cyclic movements.
Therefore, the goal of this study was to develop a modified Hill-type muscle model that included both stretch-induced force enhancement and shortening-induced force depression that can be incorporated into a forward dynamics simulation to examine the influence of these history dependent effects on human movement. We first developed and validated a modified-muscle model that incorporated both stretch-induced force enhancement and force depression. The model’s accuracy was evaluated by comparing the outputs from simulated in situ experiments with actual experimental data from isolated cat soleus muscles. We then used the model in a simulated counter-movement jumping task to assess the influence of history dependent effects on human movement performance.
METHODS
Force enhancement model
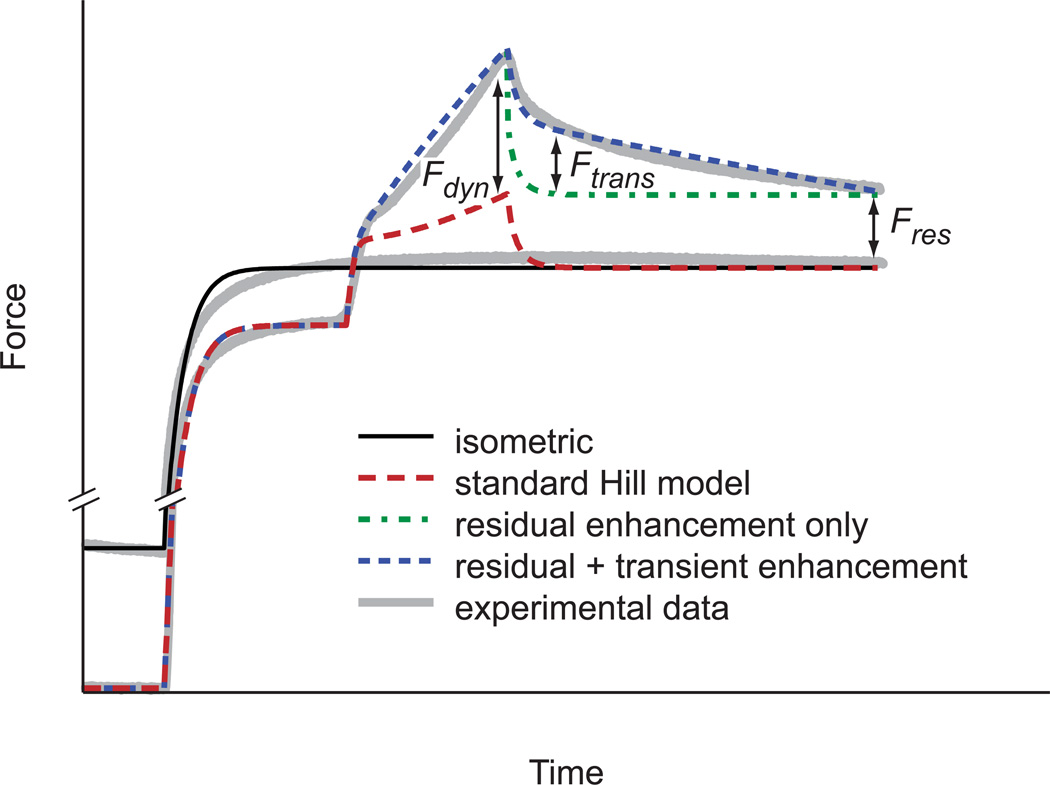
The force enhancement model consisted of a modified Hill-type model (Zajac, 1989) with three components (Fig. 1). Residual force enhancement (FEres) is the long lasting component that appears as the difference in isometric force following an active stretch and the isometric reference force (i.e., with no previous length change). Dynamic force enhancement (FEdyn) occurs when the muscle is being stretched and transient force enhancement (FEtrans) is the delay in return to steady state force following the end of the stretch. The total force enhancement (FEtotal) is equal to FEdyn during the stretch and the sum of FEres and FEtrans following the stretch, which is added to the force calculated from the standard Hill-type model. FEtotal was set to zero prior to active stretching or when the muscle begins to shorten.
Figure 1.
A schematic showing the components of the history dependent stretch force enhancement model. The model including residual force enhancement (Fres), transient force enhancement (Ftrans) and dynamic force enhancement (Fdyn) provides the best match with experimental data. For comparison, the force produced by a classic Hill-type model undergoing the same active stretch is shown.
Based on experimental data from cat soleus muscles, when a muscle is actively stretched on the descending limb of the force-length curve, the relationship between FEres (normalized to maximal isometric force) and muscle length change (ΔL) is best described by a second order polynomial equation (R2 > 0.99) such that
| (1a) |
where Li is the current length of the muscle normalized by the muscle’s rest length (L0). Values for the constants were taken from the average of three experimental stretch velocities (3mm/s, 9mm/s and 27mms/s) and were −2.00, 1.10 and 0.00 for a, b and c, respectively. Previous work has shown that active stretches over a threshold value of ~25% of fiber length no longer result in increased force enhancement (Hisey, et al., 2009). Therefore, when stretches exceed 25% of Lo, ΔL was held constant at that length for the calculation of force enhancement.
On the ascending limb of the force-length curve, FEres was considered to be independent of length change and equal to 3% or 1% of muscle force if Li was between 85% and 100% or less than 85% of L0, respectively (Lee et al, 2001; Hisey et al, 2009). FEres was calculated as:
| (1b) |
| (1c) |
where Fi is the current muscle force. In order to avoid discontinuities, FEres increased by the same relationship as on the descending limb until the target 3% or 1% was reached.
Previous studies have shown force enhancement during the stretch is correlated with the magnitude of the residual force enhancement (Edman and Tsuchiya, 1996), thus FEdyn was calculated as:
| (2) |
At the end of the active stretch, FEtrans was calculated based on experimental data from the cat soleus muscle (Herzog and Leonard, 2002) as:
| (3) |
where A is the difference between FEdyn and FEres at the end of the stretch and t is the time from the end of the stretch. The transient period of force enhancement is terminated by setting FEtrans to zero when the value for Equation 3 becomes negative. The value for k was also based on experimental data and was calculated as:
| (4) |
where a, b and c were equal to 9.61, -5.44 and 0.00, respectively.
Total force enhancement was determined using the equation:
| (5) |
Force depression model
The force depression model has been described previously in detail (McGowan, et al., 2010). Briefly, the total force depression (FDtotal) is the sum of static force depression, based on the work done during shortening, and transient force depression, described by an exponential term which is also a function of net muscle work. Force depression is long lasting and persists until the muscle is deactivated.
Combined muscle model
The standard Hill-type model, and force enhancement and force depression models were combined to predict force based on the muscle’s current state and fiber length change history. Because force enhancement was abolished as soon as the muscle begins to shorten, the effects were not cumulative in stretch-shorten cycles. However, because force depression was maintained until the muscle was deactivated, the effects were cumulative in shorten-stretch cycles. The total force produced by the combined modified muscle model was calculated as:
| (6) |
Single muscle in situ simulations
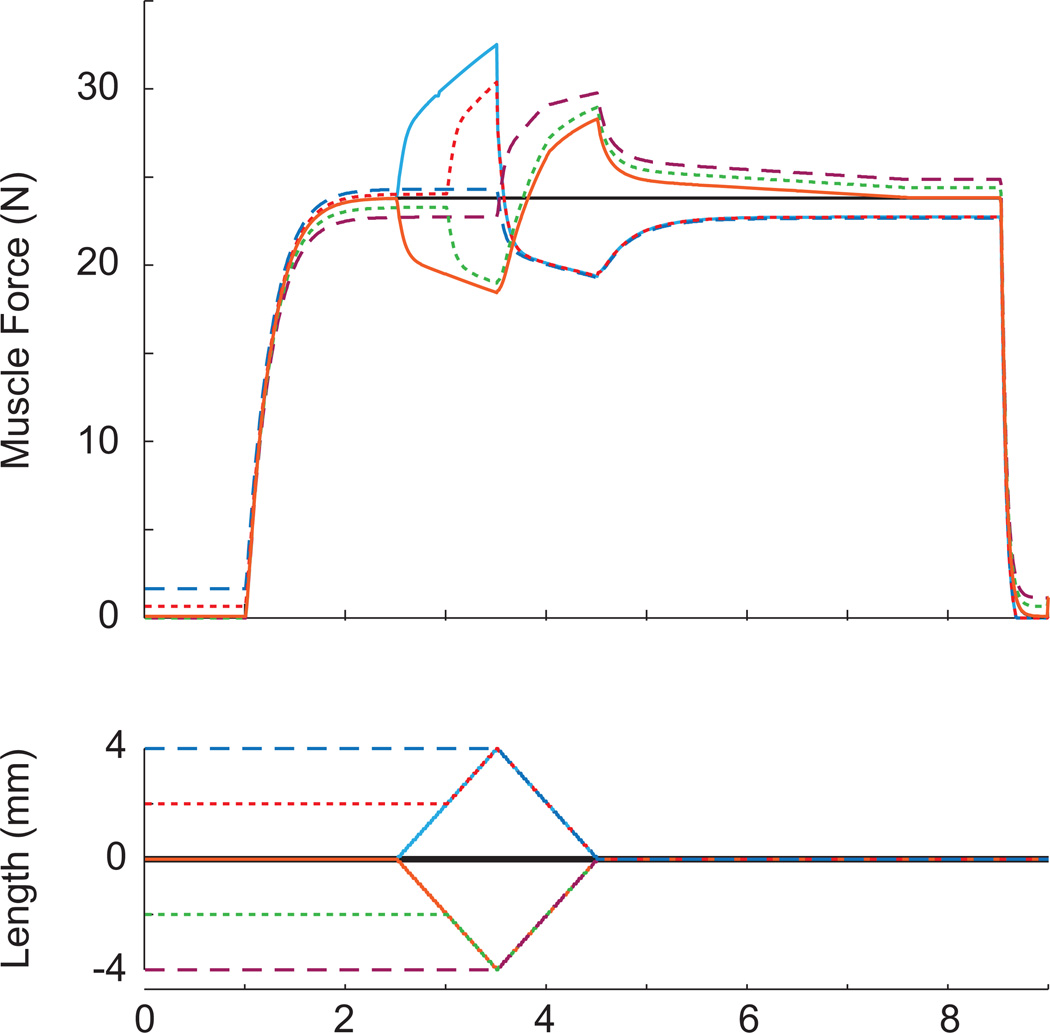
To validate the muscle model’s ability to reproduce empirical measurements of whole muscle force enhancement, a muscle ergometer model (McGowan, et al., 2010) was used to simulate a subset of the experimental protocol from Herzog and Leonard (2002). Their experiments compared the isometric force following constant velocity stretches of active muscles with the isometric force of a muscle that was not stretched. Individual stretches were made for three lengths (3mm, 6mm and 9mm) at three different velocities (3mm/s, 9mm/s and 27mm/s) for a total of nine stretches. Isometric contractions and all stretches ended at rest length +9mm. Optimal muscle fiber length (36mm), tendon slack length (74mm, including aponeurosis), maximum shorting velocity (3.3 lengths/sec) and maximum isometric force (28.6N) were set to approximate the average values for cat soleus muscles (Herzog and Leonard, 2002). In a second set of simulations, the ergometer model was used to examine the model’s ability to reproduce experimental data from sequential stretch-shorten and shorten-stretch cycles (Fig. 3). The magnitudes and rates of length charge were based on the experiments of Herzog and Leonard (2000) to facilitate comparisons to data in the literature (Herzog and Leonard, 2000; Lee, et al., 2001).
Figure 3.
Simulated force data from the modified muscle model for active stretch-shorten and shorten-stretch cycles. Stretch-shorten cycles consisted of 4mm contractions preceded by active stretches of 0mm, 2mm and 4mm. Shorten-stretch cycles consisted of 4mm stretches preceded by contractions of 0mm, 2mm and 4mm. All length changes occurred at 4mm/s and ended at the muscle’s optimal length. The modified muscle model includes both stretch induced force enhancement and shortening induced force depression. Colors and line patterns are the same for muscle force and length for each condition. Consistent with experimental data, history dependent effects are cumulative during shorten-stretch cycles but not during stretch-shorten cycles.
Countermovement jumping simulation
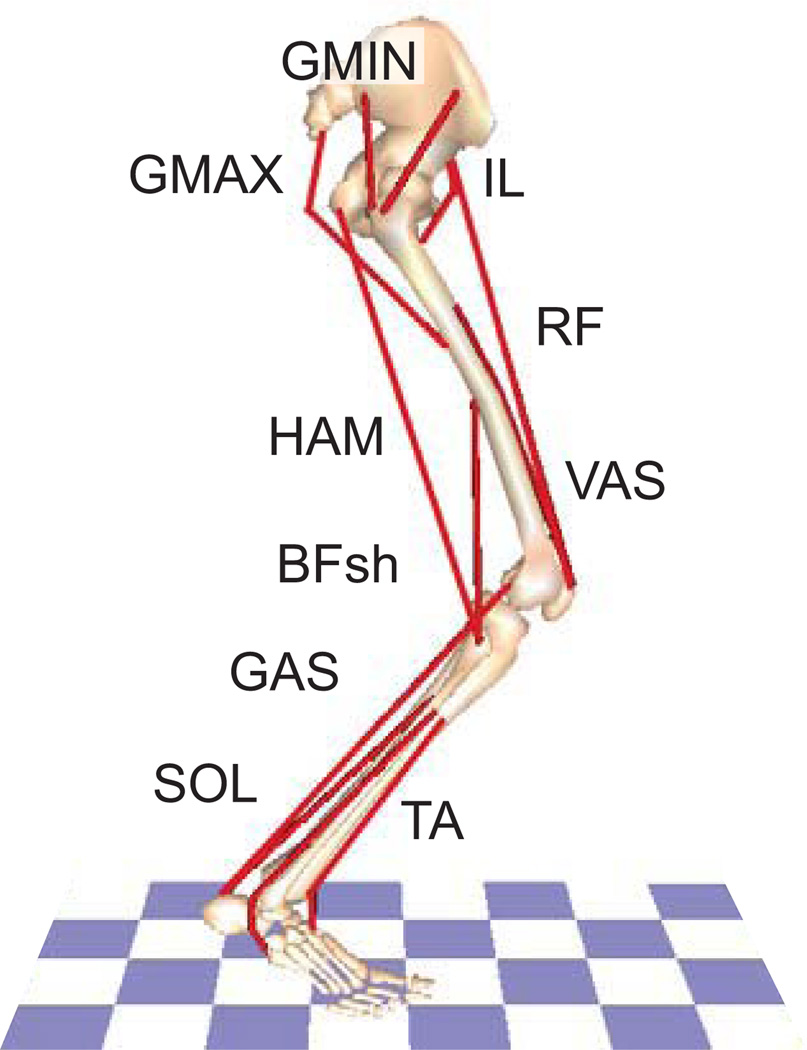
To assess the effect of history dependent properties on human movement performance, simulations of countermovement jumping were generated with and without the modified-muscle model. The simulations used a previously described (e.g., McGowan, et al., 2009; Neptune, et al., 2009) detailed musculoskeletal model (Fig. 4) developed in SIMM/Dynamics Pipeline (MusculoGraphics, Inc.) and the equations of motion were generated using SD/FAST (PTC). Muscle excitations were modeled using the sum of four Henning patterns, each with three parameters (onset, offset, magnitude) for a total of 12 parameters per muscle (Rankin, et al., 2011). Foot ground contact was modeled using 30 viscoelastic elements with Coulomb friction on the plantar surface of the three foot segments (Neptune, et al., 2000).
Figure 4.
The musculoskeletal model for simulations of countermovement jumping (right side shown) consisted of rigid segments representing the trunk and two legs, with each leg consisting of a thigh, shank, patella, and three-part foot for a total of 13 degrees of freedom (flexion/extension at the hip, knee, ankle, mid foot and toes of each leg along with vertical and horizontal translation and rotation of the trunk). The model was driven by 25 musculotendon actuators per leg grouped into 13 muscle groups based on anatomical function: IL (illiacus, psoas), GMAX (gluteus maximus, adductor magnus), GMED (anterior and posterior regions of the gluteus medius), VAS (3-component vastus), RF (rectus femoris), HAM (medial hamstrings, biceps femoris long head), BFsh (biceps femoris short head), GAS (medial and lateral gastrocnemius), SOL (soleus, tibialis posterior), TA (tibialis anterior, peroneus tertius), PR (peroneus longus, peroneus brevis), FLXDG (flexor digitorum longus, flexor hallucis longus) and EXTDG (extensor digitorum longus, extensor hallucis longus). PR, FLXDG, and EXTDG are not shown. Each muscle within a group received the same excitation pattern.
To generate the countermovement simulations, the initial conditions and excitation patterns were optimized using a simulated annealing algorithm (Goffe, et al., 1994). A starting guess for initial conditions (static standing with slightly flexed legs) and excitation patterns was based on our experimental data and electromyography data taken from the literature (Voigt, et al., 1995). A control simulation was generated using the standard Hill-type muscle model by minimizing the difference between simulated and experimental countermovement jump data (i.e., joint angles, hip height and ground reaction forces). A second simulation was generated using the modified-muscle model that minimized the differences between the simulated data using the modified-muscle model and the control simulation data.
Experimental data
Countermovement jumping data were collected at the University of Idaho using an IRB approved protocol. Ground reaction forces and kinematic data were measured using an in-ground force plate and 3D motion capture system. 16 retro-reflective markers were affixed with double-sided tape to specific landmarks according to the Modified Helen Hayes Marker set described by Kadaba et al., (1990). 3-dimensional positions of each marker were captured at 250 Hz via a Vicon MX motion analysis system (Vicon, Oxford Metrics Ltd., UK) and marker trajectory data were filtered using a Woltring filtering routine (Woltring, 1978). The ground reaction force (GRF) data were captured at 1000 Hz from the force plate in synchrony with the motion capture data. Force plate data were low-pass filtered at 30 Hz using a second-order Butterworth filter before being down sampled and combined with the motion capture data. Vicon Plug-in Gait was used to calculate the representative data required for the simulations. Data were the average of 10 trials from a single female subject (height: 1.62 m, mass: 71.2 kg) who provided her informed consent. The data were normalized by body mass and leg length to facilitate the comparison between the subject and the model.
RESULTS
In-situ muscle ergometer simulations
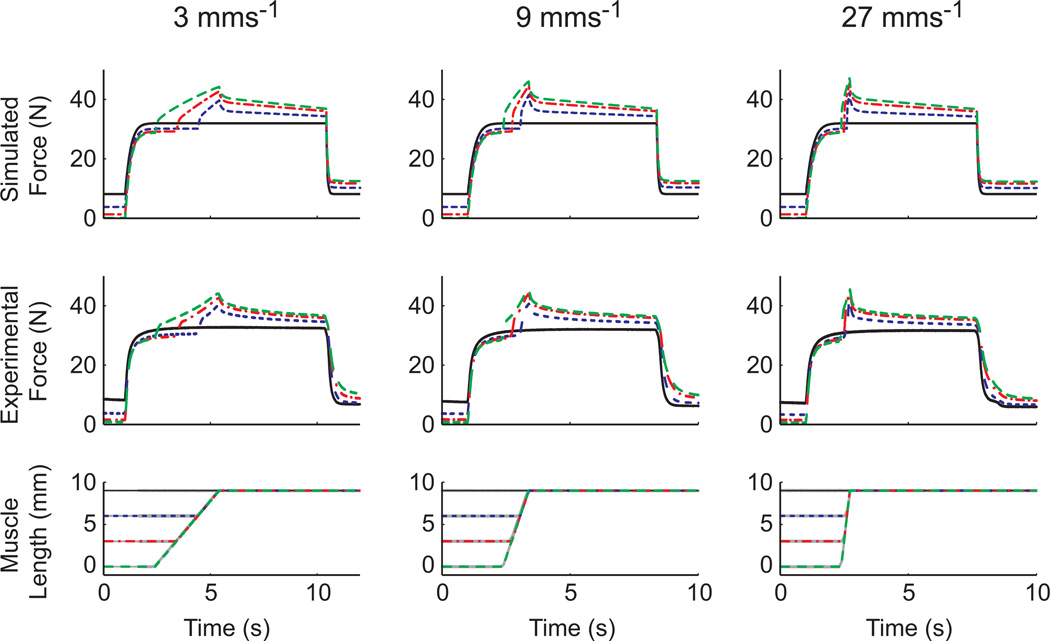
On the descending limb of the force-length curve, simulations of single muscle active stretches accurately reproduced experimental data for all conditions (Fig. 2). The average root mean square error (RMSE) between the simulations and experimental data while the muscle was active was 0.59 N (range: 0.45 – 0.85 N) for 3mm/s stretches, 0.60 N (range: 0.36 – 1.05 N) for 9mm/s stretches and 0.98 N (range: 0.68 – 1.42 N) for 27mm/s stretches. Across all simulations, the average RMSE was 0.72 N. Using the Hill-type model alone resulted in an average RMSE of 4.41 N (range: 2.62–5.86 N) across all conditions.
Figure 2.
A comparison of simulated and experimental in situ active stretch force data. Muscles were stretched over three different lengths (3, 6, and 9 mm) at three different speeds (3, 9 and 27 mm s−1). The simulated force outputs (top row) agreed well with experimental force data (middle row) in all conditions. The individual colors and patterns within each column correspond to a given trial. The experimental data are average data from cat soleus muscles taken from Leonard and Herzog (2002).
Simulations of the stretch-shorten and shorten-stretch cycles were consistent with experimental data (Herzog and Leonard, 2000; Lee, et al., 2001) and had an average RMSE of 2.41 N (range: 1.90–2.95 N). However, this was largely because the experimental data had a slightly higher isometric force than the model. When the model forces were adjusted such that the isometric force matched that of the experimental data, the RMSE was reduced to 0.74 N (range: 0.09–1.11 N). Thus, the model was able to reproduce the cumulative effects of force depression and enhancement when the muscle underwent shorten-stretch cycles and the non–cumulative effects during stretch-shorten cycles (Fig. 3).
Countermovement jumping
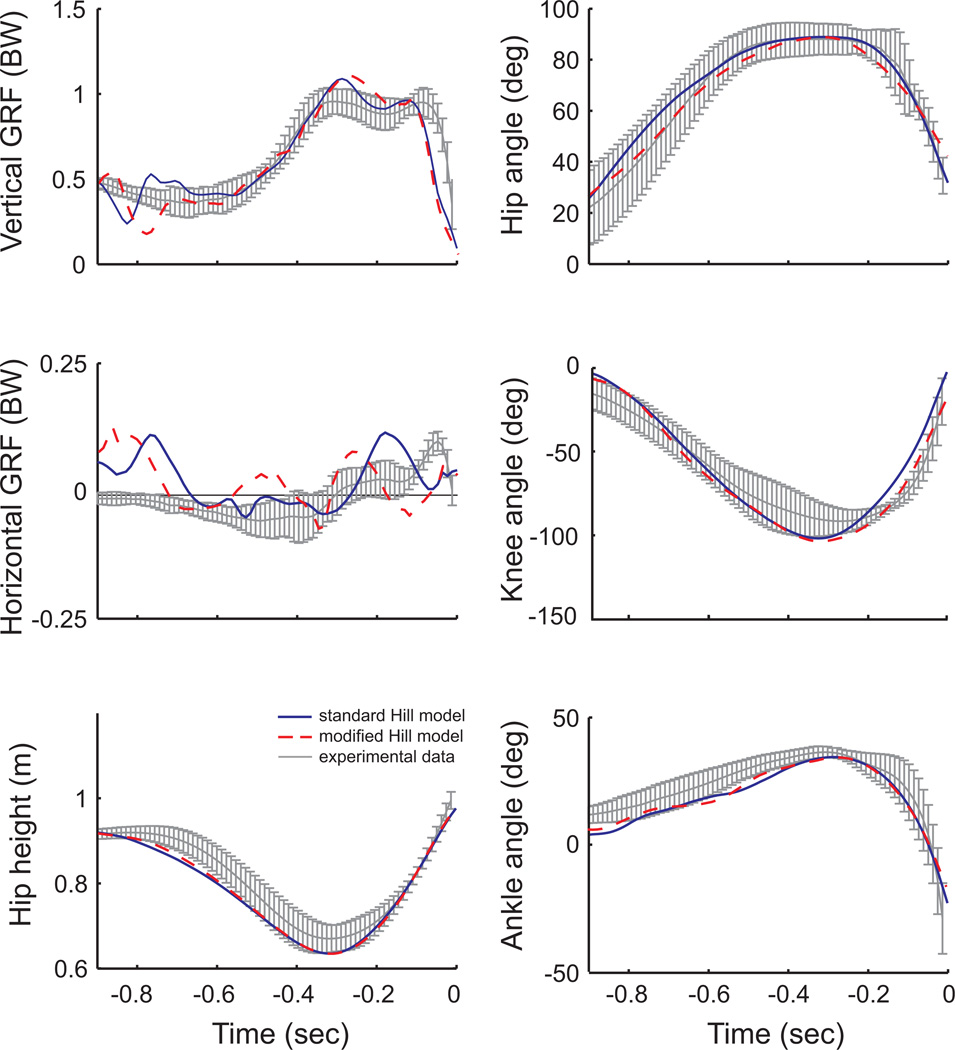
The simulation incorporating the modified muscle model was able to accurately reproduce the jumping motions generated by the control simulation, which agreed well with experimental data (Fig. 5). The RMSE between the ground reaction forces, joint angles and hip height from the control simulation and the experimental data were 0.066BW, 5.5°, and 0.043m, respectively; whereas the RMSE between the ground reaction forces, joint angles and hip height from the modified muscle simulation and the control simulation were 0.053BW, 2.4°, and 0.005m, respectively. The largest discrepancy between the data occurred in the horizontal ground reaction forces (Fig. 5), in which the simulated forces fluctuated around zero and did not match the pattern from the experimental data. However, these forces are quite small and likely do not contribute meaningfully to the predominately vertical jumping task. Rather, they likely reflect the simulations trying to maintain fore-aft balance without the feedback present on biological legs.
Figure 5.
Ground reaction force and kinematic data from the counter movement jump. The gray lines are the average experimental data (± 2 standard deviations) from 10 jumping trials from a single subject. The solid blue lines are data from the control simulation and the dashed red lines are data from simulation with the modified muscle model.
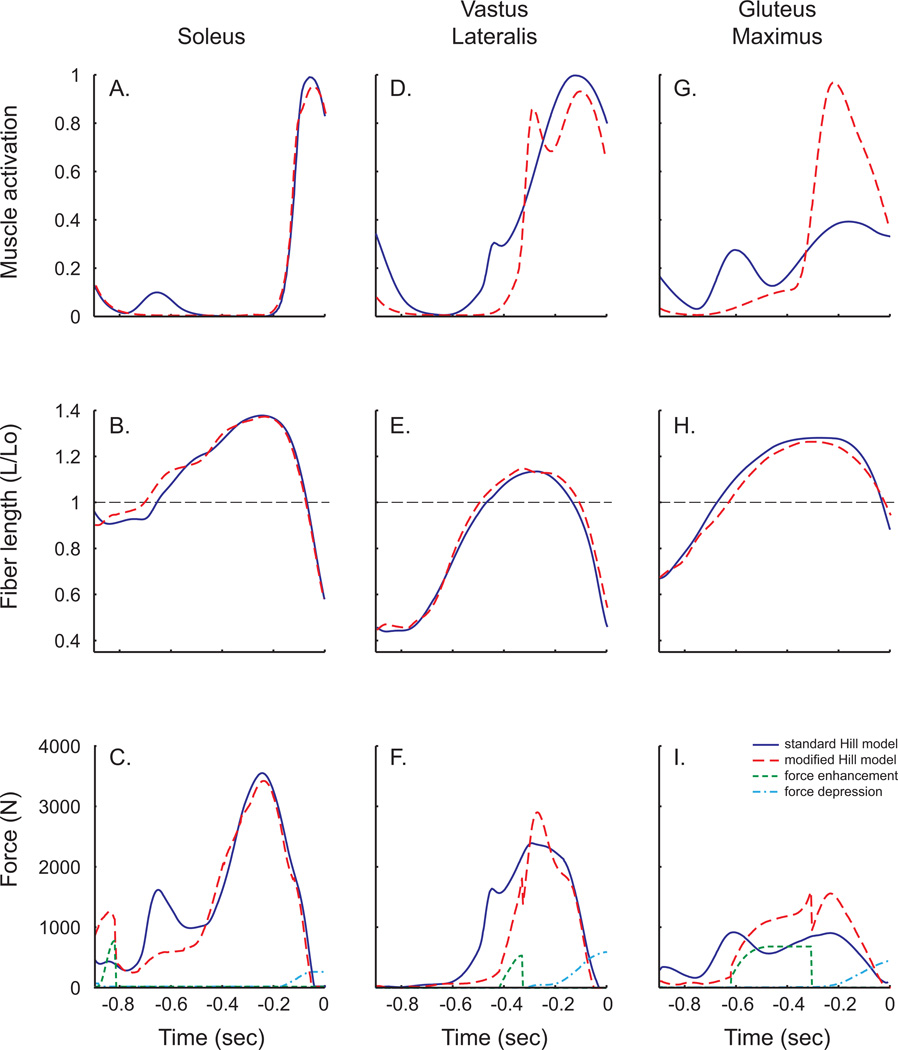
The uni-articular soleus, vastus lateralis and gluteus maximus were chosen to examine the effects of history dependent properties because they undergo the greatest length changes during the countermovement jump (Fig. 6). Soleus muscle activation patterns were nearly identical between the two simulations (Fig. 6A). Early active stretching of the soleus (Fig. 6B) produced a short duration force enhancement of 761N (Fig. 6C), whereas rapid shortening before toe-off resulted in relatively little force depression (245N). However, there was not a substantial effect on the total force produced during the upward acceleration phase of the jump. The vastus lateralis underwent a large stretch-shorten cycle, but was only active during a portion of the stretch compared to all of the shortening (Figs. 6D,E). The active stretch produced a force enhancement of 536N, and the active shortening produced 596N of force depression (Fig. 6F). The gluteus maximus was active throughout the jump motion; however, the activation patterns differed substantially between the two simulations (Fig. 6G). The active stretch of the muscle began on the ascending limb of the force-length curve and continued well onto the descending limb (Fig. 6H), producing 676N of force enhancement (Fig. 6I). Because the magnitude of the stretch exceeded 25% of the muscle’s rest length, force enhancement reached a plateau for much of the stretching phase. The subsequent active shortening produced 449N of force depression which was partially offset by higher muscle activation.
Figure 6.
Simulated muscle data for the soleus, vastus lateralis and gluteus maximus from the control simulation (solid lines) and simulation with the modified muscle model (dashed lines). Muscle activation patterns (top row) were allowed to vary between the two simulations. Slight differences in kinematics produced small differences in muscle length change (middle row). The magnitude of force generated by muscles with the modified muscle model included both stretch-induced force enhancement and shortening-induced force depression.
DISCUSSION
The goal of this study was to develop a phenomenological muscle model that could reproduce both shortening-induced force depression and stretch-induced force enhancement. The simulation results show that the modified muscle model was able to effectively reproduce both the magnitude and timing of history dependent effects measured during in situ stretch-shorten and shorten-stretch cycles. These results are consistent with previous phenomenological models that include both force depression and force enhancement (e.g., Ettema and Meijer, 2000; Forcinito, et al., 1998). However, our model was also able to reproduce the cumulative effects which sum during shorten-stretch cycles but not during stretch-shorten cycles (Fig. 3), which some previous models could not account for (e.g., Forcinito, et al., 1998). The influence of these effects on dynamic human movement was assessed during a countermovement jumping task. The jumping tasks showed that for a given excitation pattern, history dependent muscle properties have the capacity to substantially alter the timing and magnitude of muscle force production, which can result in changes in movement dynamics. However, when the muscle activation patterns were re-optimized, similar movement patterns were achieved with the modified-muscle model and standard-muscle model.
One of the outcomes of this study was to determine to what extent history dependent force enhancement and force depression offset one another in dynamic movement tasks. We found that in the countermovement jump (Fig. 6) the magnitudes of force enhancement and force depression were very similar. The force produced by each muscle was also affected by other factors. For example, slight differences in the joint motions meant that the muscle fibers were at slightly different states, and therefore other intrinsic properties (e.g., force-length, force-velocity) influenced the force output. Because the simulations were optimized independently, differences in muscle excitation patterns made it challenging to interpret isolated effects of individual history dependent properties. To control for this, we ran the modified muscle model jumping simulation without allowing it to re-optimize muscle excitation patterns. However, this simulation did not result in a jumping motion.
The results of the countermovement jump simulation highlight the range of effects possible with the modified-muscle (Fig. 6). The soleus experienced relatively small effects from history dependent properties, mainly because the muscle was active for only a short time during stretching and was not fully active until the end of the jump. This timing is generally consistent with experimental measurements of muscle activity during countermovement jumps (Voigt, et al., 1995). The amount of force depression that was developed while soleus was active was low because the muscle did relatively little work due the rapid drop in force during shortening, which was due in large part to the force-velocity relationship. The vastus lateralis was also only active for part of the stretch phase. The stretch-induced force enhancement and slight increase in muscle activation resulted in a peak force that was 22% higher, but changes in activation timing produced overall muscle force impulse that was 28% lower. Finally, the gluteus maximus was active throughout the stretch-shorten cycle and thus showed the greatest effects of history dependent properties. The active stretch was so great that it exceeded the threshold for which force enhancement has been shown to continue to increase (Hisey, et al., 2009), and thus force enhancement plateaued and accounted for over half of the force produced during this period.
The aim of this study was to develop a relatively simple phenomenological muscle model that includes both force depression and enhancement effects and can be incorporated into complex musculoskeletal models and forward dynamic simulations. While our model achieved this aim, there are some limitations. Most notably, as a muscle actively stretches from the ascending limb onto the plateau and descending limb of the force length curve, the force enhancement increases instantaneously. Further, when the muscle transitions from stretching to shortening, the force enhancement rapidly disappears. These discontinuities in force, which are not present in biological systems, appear in our simulations because each muscle in the musculoskeletal model is modeled as a single fiber. During the transition from stretching to shortening in a whole muscle, the timing of the transition for each fiber making up the muscle will be slightly offset, effectively damping out any transient forces. However, as a result of these abrupt changes, the numerical integration of the equations-of motion for the simulation becomes very stiff, thereby increasing the time for each simulation by as much as 10-fold. This means that the time required for optimization of more complex movements involving multiple muscle groups may become prohibitively long. Despite this limitation, the modified muscle model developed here was able to elucidate the influence of history dependent effects during a relatively simple dynamic movement task. And while future modifications to this model that eliminate discontinuities in force production may enable it to be used in more complex simulations, our results suggest that in most submaximal activities, history dependent effects will likely be compensated for by changes in muscle excitation. For example, incorporation of the modified-muscle model into simulations of more complex movement tasks (e.g., slow running) produced stable simulations. The results of these simulations were consistent with our finding for counter-movement jumping in that history dependent effects were compensated for by changes in muscle activation and had little impact on movement dynamics.
ACKNOWLEDGEMENTS
We would like to thank Melissa Thompson for her help with experimental data collection. We would also like to acknowledge two anonymous reviewers, whose comments helped improve the quality of this paper. This work was funded by NIH grants RO1 NS55380 and F32 AR054245.
Footnotes
Publisher's Disclaimer: This is a PDF file of an unedited manuscript that has been accepted for publication. As a service to our customers we are providing this early version of the manuscript. The manuscript will undergo copyediting, typesetting, and review of the resulting proof before it is published in its final citable form. Please note that during the production process errors may be discovered which could affect the content, and all legal disclaimers that apply to the journal pertain.
Conflict of Interest Statement
The authors have no conflict of interest.
REFERENCES
- Abbott BC, Aubert XM. The force exerted by active striated muscle during and after change of length. J Physiol. 1952;117:77–86. [PMC free article] [PubMed] [Google Scholar]
- Bullimore SR, Leonard TR, Rassier DE, Herzog W. History dependence of isometric muscle force: effect of prior stretch or shortening amplitude. J Biomech. 2007;40:1518–1524. doi: 10.1016/j.jbiomech.2006.06.014. [DOI] [PubMed] [Google Scholar]
- Edman KA. Mechanical deactivation induced by active shortening in isolated muscle fibres of the frog. J Physiol. 1975;246:255–275. doi: 10.1113/jphysiol.1975.sp010889. [DOI] [PMC free article] [PubMed] [Google Scholar]
- Edman KA, Elzinga G, Noble MI. Enhancement of mechanical performance by stretch during tetanic contractions of vertebrate skeletal muscle fibres. J Physiol. 1978;281:139–155. doi: 10.1113/jphysiol.1978.sp012413. [DOI] [PMC free article] [PubMed] [Google Scholar]
- Edman KA, Elzinga G, Noble MI. Residual force enhancement after stretch of contracting frog single muscle fibers. J Gen Physiol. 1982;80:769–784. doi: 10.1085/jgp.80.5.769. [DOI] [PMC free article] [PubMed] [Google Scholar]
- Edman KA, Tsuchiya T. Strain of passive elements during force enhancement by stretch in frog muscle fibres. J Physiol. 1996;490 (Pt1):191–205. doi: 10.1113/jphysiol.1996.sp021135. [DOI] [PMC free article] [PubMed] [Google Scholar]
- Ettema GJ. Effects of contraction history on control and stability in explosive actions. J Electromyogr Kinesiol. 2002;12:455–461. doi: 10.1016/s1050-6411(02)00039-1. [DOI] [PubMed] [Google Scholar]
- Ettema GJ, Meijer K. Muscle contraction history: modified Hill versus an exponential decay model. Biol Cybern. 2000;83:491–500. doi: 10.1007/s004220000190. [DOI] [PubMed] [Google Scholar]
- Forcinito M, Epstein M, Herzog W. Can a rheological muscle model predict force depression/enhancement? J Biomech. 1998;31:1093–1099. doi: 10.1016/s0021-9290(98)00132-8. [DOI] [PubMed] [Google Scholar]
- Goffe WL, Ferrier GD, Rodgers J. Global optimization of statistical functions with simulated annealing. J. Econometrics. 1994;60:65–99. [Google Scholar]
- Herzog W, Leonard TR. Depression of cat soleus forces following isokinetic shortening. J Biomech. 1997;30:865–872. doi: 10.1016/s0021-9290(97)00046-8. [DOI] [PubMed] [Google Scholar]
- Herzog W, Leonard TR. The history dependence of force production in mammalian skeletal muscle following stretch shortening and shortening stretch cycles. J Biomech. 2000;33:531–542. doi: 10.1016/s0021-9290(99)00221-3. [DOI] [PubMed] [Google Scholar]
- Herzog W, Leonard TR. Force enhancement following stretching of skeletal muscle: a new mechanism. J Exp Biol. 2002;205:1275–1283. doi: 10.1242/jeb.205.9.1275. [DOI] [PubMed] [Google Scholar]
- Herzog W, Leonard TR, Wu JZ. The relationship between force depression following shortening and mechanical work in skeletal muscle. J Biomech. 2000;33:659–668. doi: 10.1016/s0021-9290(00)00008-7. [DOI] [PubMed] [Google Scholar]
- Hisey B, Leonard TR, Herzog W. Does residual force enhancement increase with increasing stretch magnitudes? J Biomech. 2009;42:1488–1492. doi: 10.1016/j.jbiomech.2009.03.046. [DOI] [PubMed] [Google Scholar]
- Josephson RK, Stokes DR. Work dependent deactivation of a crustacean muscle. J Exp Biol. 1999;202:2551–2565. doi: 10.1242/jeb.202.18.2551. [DOI] [PubMed] [Google Scholar]
- Kadaba MP, Ramakrishnan HK, Wootten ME. Measurement of lower extremity kinematics during level walking. J Orthop Res. 1990;8:383–392. doi: 10.1002/jor.1100080310. [DOI] [PubMed] [Google Scholar]
- Kosterina N, Westerblad H, Lannergren J, Eriksson A. Muscular force production after concentric contraction. J Biomech. 2008;41:2422–2429. doi: 10.1016/j.jbiomech.2008.05.019. [DOI] [PubMed] [Google Scholar]
- Lee HD, Herzog W, Leonard T. Effects of cyclic changes in muscle length on force production in in situ cat soleus. J Biomech. 2001;34:979–987. doi: 10.1016/s0021-9290(01)00077-x. [DOI] [PubMed] [Google Scholar]
- Marechal G, Plaghki L. The deficit of the isometric tetanic tension redeveloped after a release of frog muscle at a constant velocity. J Gen Physiol. 1979;73:453–467. doi: 10.1085/jgp.73.4.453. [DOI] [PMC free article] [PubMed] [Google Scholar]
- McGowan CP, Kram R, Neptune RR. Modulation of leg muscle function in response to altered demand for body support and forward propulsion during walking. J Biomech. 2009;42:850–856. doi: 10.1016/j.jbiomech.2009.01.025. [DOI] [PMC free article] [PubMed] [Google Scholar]
- McGowan CP, Neptune RR, Herzog W. A phenomenological model and validation of shortening induced force depression during muscle contractions. J Biomech. 2010;43:449–454. doi: 10.1016/j.jbiomech.2009.09.047. [DOI] [PMC free article] [PubMed] [Google Scholar]
- Meijer K, Grootenboer HJ, Koopman HF, van der Linden BJ, Huijing PA. A Hill type model of rat medial gastrocnemius muscle that accounts for shortening history effects. J Biomech. 1998;31:555–563. doi: 10.1016/s0021-9290(98)00048-7. [DOI] [PubMed] [Google Scholar]
- Neptune RR, Clark DJ, Kautz SA. Modular control of human walking: a simulation study. J Biomech. 2009;42:1282–1287. doi: 10.1016/j.jbiomech.2009.03.009. [DOI] [PMC free article] [PubMed] [Google Scholar]
- Neptune RR, Wright IC, Van Den Bogert AJ. A Method for Numerical Simulation of Single Limb Ground Contact Events: Application to Heel Toe Running. Comput Methods Biomech Biomed Engin. 2000;3:321–334. doi: 10.1080/10255840008915275. [DOI] [PubMed] [Google Scholar]
- Peterson DR, Rassier DE, Herzog W. Force enhancement in single skeletal muscle fibres on the ascending limb of the force length relationship. J Exp Biol. 2004;207:2787–2791. doi: 10.1242/jeb.01095. [DOI] [PubMed] [Google Scholar]
- Rankin JW, Richter WM, Neptune RR. Individual muscle contributions to push and recovery subtasks during wheelchair propulsion. J Biomech. 2011;44:1246–1252. doi: 10.1016/j.jbiomech.2011.02.073. [DOI] [PMC free article] [PubMed] [Google Scholar]
- Voigt M, Simonsen EB, Dyhre Poulsen P, Klausen K. Mechanical and muscular factors influencing the performance in maximal vertical jumping after different prestretch loads. J Biomech. 1995;28:293–307. doi: 10.1016/0021-9290(94)00062-9. [DOI] [PubMed] [Google Scholar]
- Williams TL. A new model for force generation by skeletal muscle, incorporating work dependent deactivation. J Exp Biol. 2010;213:643–650. doi: 10.1242/jeb.037598. [DOI] [PMC free article] [PubMed] [Google Scholar]
- Woltring HJ. A FORTAN package for generalized cross validatory spline smoothing and differentation. Advances in Engineering Software. 1978;8:104–113. [Google Scholar]
- Zajac FE. Muscle and tendon: properties, models, scaling, and application to biomechanics and motor control. Crit Rev Biomed Eng. 1989;17:359–411. [PubMed] [Google Scholar]


