Abstract
Background and Purpose
There is no validated neuroimaging marker for quantifying brain edema. We sought to test whether MRI-based metrics would reliably change during the early subacute period in a manner consistent with edema and whether they would correlate with relevant clinical endpoints.
Methods
Serial MRI studies from patients in the EPITHET trial with initial diffusion weighted imaging (DWI) lesion volume >82 cm3 were analyzed. Two independent readers outlined the hemisphere and lateral ventricle on the involved side and calculated respective volumes at baseline and day 3 to 5. We assessed inter-rater agreement, volume change between scans and the association of volume change with early neurological deterioration (END: NIHSS score worsening ≥4 points), 90-day modified Rankin Scale (mRS) score 0–4 and mortality.
Results
Of 12 patients who met study criteria, average baseline and follow-up DWI lesion size was 138 cm3 and 234 cm3, respectively. Mean time to follow-up MRI was 62 hours. Concordance correlation coefficients between readers were >0.90 for both hemisphere and ventricle volume assessment. Mean percent hemisphere volume increase was 16.2±8.3% (p<.0001), and mean percent ventricle volume decrease was 45.6±16.9% (p<0.001). Percent hemisphere growth predicted END (area under the curve [AUC]=0.92, p=0.0005) and 90-day mRS 0–4 (AUC 0.80, p=0.02).
Conclusions
In this exploratory analysis of severe ischemic stroke patients, statistically significant changes in hemisphere and ventricular volumes within the first week are consistent with expected changes of cerebral edema. MRI-based analysis of hemisphere growth appears to be a suitable biomarker for edema formation.
Keywords: Acute Ischemic Stroke, Cerebral Edema, Malignant Stroke, MRI, Biomarker
INTRODUCTION
Cerebral edema is common in acute brain disorders including malignant middle cerebral artery infarction, intracranial hemorrhage and traumatic brain injury.1–3 The space occupying effect of edema can lead to midline shift, neurological deterioration and death. Furthermore, recent studies suggest that brain edema can independently impair cerebral metabolism and may lead to compression of the microcirculation and further ischemia.4
A fundamental challenge, however, is the lack of a validated neuroimaging marker for brain edema. Computed tomography hypodensity does not have sufficient sensitivity to quantify edema, and MRI sequences such as diffusion weighted imaging lack the specificity necessary to distinguish tissue infarction from swelling. In order to develop novel therapies against brain edema, as well as to evaluate current treatments, there is a critical need to identify radiographic biomarkers of edema formation. Prior attempts to use CT and MRI, in the context of comparing mannitol and hypertonic saline, have not achieved widespread acceptance.
To develop a neuroimaging marker for brain edema related to severe ischemic stroke, we examined serial MRI images from patients enrolled in the EPITHET trial who met imaging criteria highly predictive of malignant infarction.5 In this exploratory analysis, we hypothesized that ipsilateral cerebral hemisphere and lateral ventricle volumes would reliably change over the first three to five days after severe hemispheric infarction in a manner consistent with cerebral edema, and that these changes would correlate with various clinical endpoints.
METHODS
Patient selection
EPITHET was a phase II prospective, randomized controlled trial of acute ischemic stroke patients who were treated with IV tPA or placebo between 3 and 6 hours after stroke onset, and underwent serial MRI before and 3–5 days after treatment and at 90 days. Patients were excluded if baseline noncontrast CT demonstrated intracranial hemorrhage or major early ischemic change (i.e., >1/3rd MCA territory). The full methodology of EPITHET has been described previously.6 Patients from the EPITHET cohort were included in the present analysis if they had baseline diffusion-weighted imaging (DWI) lesion volume >82 cm3, and an evaluable post-treatment MRI within the first week. The 82-cm3 threshold was chosen because previous studies have identified this DWI lesion volume on hyperacute MRI (<6 hours) as highly specific for a malignant edema pattern following acute ischemic stroke.5
Imaging acquisition and analysis and clinical endpoints
All MRI studies were performed on 1.5-Tesla echoplanar-equipped MRI scanners. Standard whole-brain imaging was performed at baseline and day 3–5, and consisted of DWI, perfusion-weighted imaging and MR angiography. DWI lesion volumes at baseline and day 3–5 were measured by two independent readers using standard planimetric software (Analyze 7.0; Biomedical Imaging Resource, Mayo Clinic, Rochester MN, USA). The mean volumes were subsequently used to identify patients for the present study.
Of 13 EPITHET patients with pre-treatment DWI lesion volume >82 cm3, baseline and day 3–5 MRI were evaluable for 12; scans for one patient could not be imported for imaging analysis due to formatting issues. The analysis was performed on pre- and post-treatment DWI scans for all 12 patients, and on available pre- and post-treatment FLAIR scans for four patients. On baseline and follow up MRI for each patient, two independent readers (different from above) outlined the cerebral hemisphere ipsilateral to the acute stroke on all relevant slices, ensuring that whole brain coverage was achieved (Figure 1). Sulci that were at least 2mm wide and extending from the brain surface were excluded, as were the major cisterns and ventricles. For each patient, this hemisphere segmentation procedure took approximately 25–30 minutes. In addition, the volume of the ipsilateral lateral ventricle was measured on all relevant slices (Figure 1). A single reader measured midline shift at baseline and day 3–5 for all patients. Midline shift was measured at the point of maximal deviation from the line drawn between the anterior and posterior attachment of the falx cerebri. Imaging analysis was performed blinded to all clinical information. The readers were two board-certified radiologists with significant experience in neuroimaging. For one of the readers, a research fellow preliminarily created outlines of the hemispheres and ventricles, which were subsequently adjusted by the radiologist.
Figure 1.
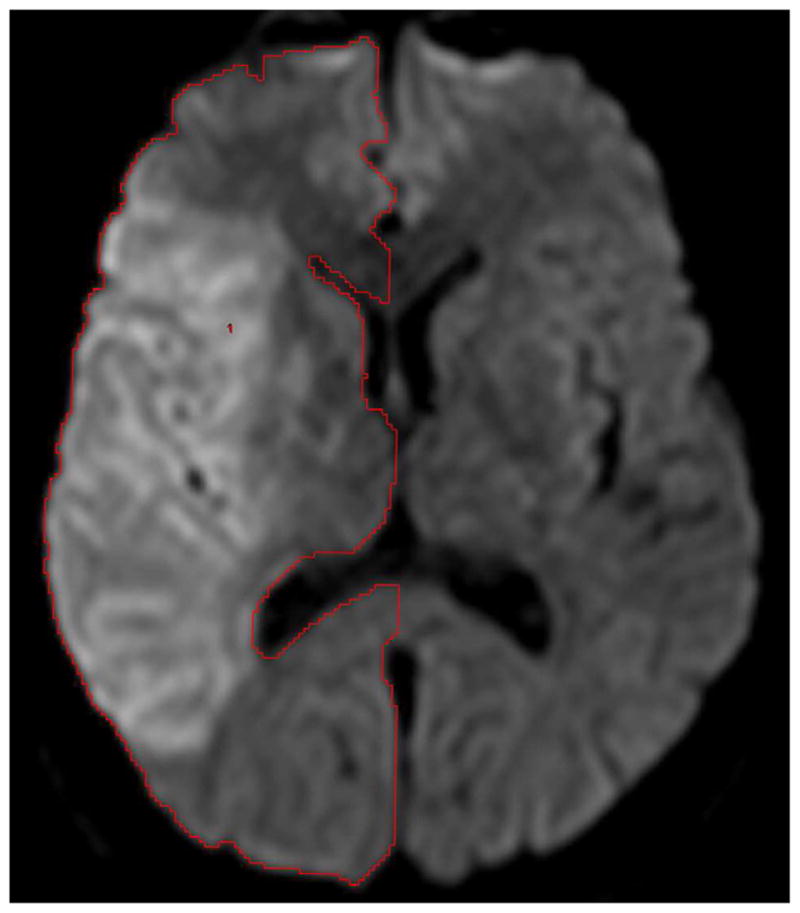
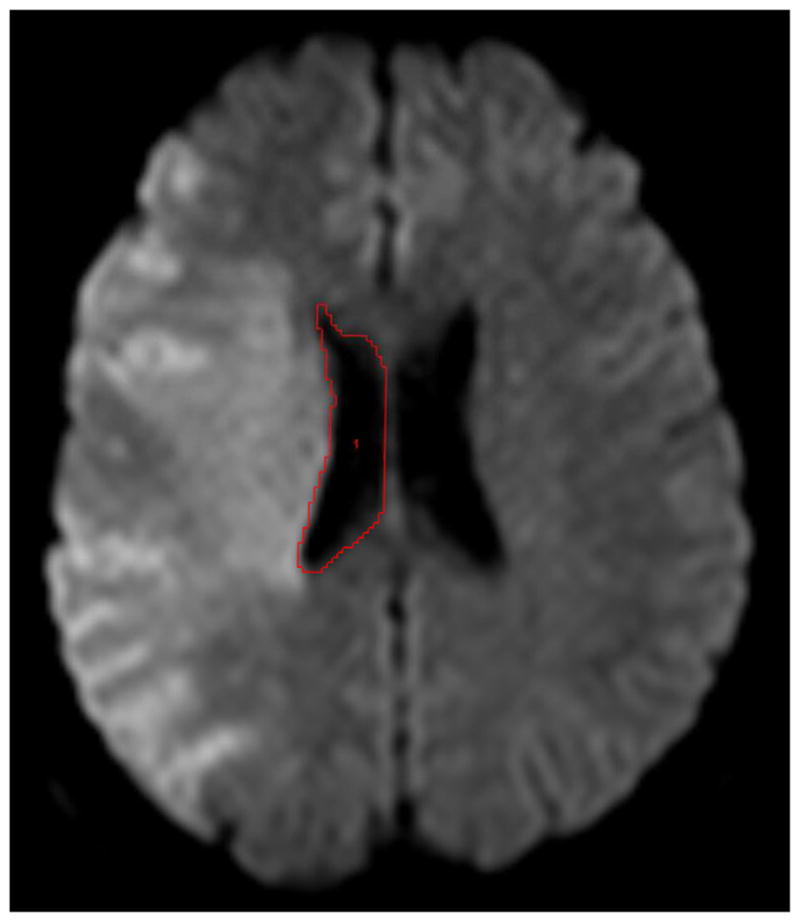
Examples of reader outlines on diffusion-weighted imaging for baseline hemisphere (a) and ventricle (b) volumes from one subject.
Clinical endpoints included 1) early neurological deterioration (END) which was defined as NIHSS score increase of 4 or more points at the time of the day 3–5 MRI; 2) favorable outcome which was taken as 90-day modified Rankin Scale (mRS) score 0–4 as this endpoint has been used in malignant stroke populations;1 and 3) 90-day mortality.
Statistical analysis
Descriptive statistics of baseline variables, treatment and outcomes were performed, and reported as mean ± standard deviation (for normally-distributed continuous data), median with interquartile range (IQR; for ordinal data) and proportions for categorical data. Normality was tested using the Kolmogorov-Smirnov test.
Paired Student t testing was employed to compare the hemisphere and lateral ventricle volumes between baseline and day 3–5 for each patient. Student t testing for independent samples was used to compare imaging measures of edema volume between the study endpoints. Receiver operating characteristic (ROC) analysis was performed to evaluate test characteristics of the various imaging measurements and to identify optimal thresholds for predicting clinical outcomes. Pearson coefficients were determined to assess the correlation between various imaging measurements. These analyses utilized the average volumes of the two readers.
Inter-rater agreement was assessed for hemisphere and ventricle volumes using the concordance correlation coefficient.7 This is a measure of agreement for continuous paired data that can be used to determine not only how closely the paired data falls along its line of best fit but also how much the paired data deviates from the 45° line of perfect agreement. Th e concordance correlation coefficient has the range of possible values from −1.0 to +1.0; in case of perfect agreement the coefficient would equal 1.0. In addition, Bland-Altman analysis was performed to quantify the degree of inter-rater difference.8 Statistical significance was taken at p<0.05. Statistical analyses were performed using MedCalc 11.2.1 (Mariakerke, Belgium).
RESULTS
Baseline demographics and outcomes (Table 1)
Table 1.
Baseline characteristics, treatment and outcomes
| Baseline characteristics and Outcome | N=12 pts |
|---|---|
| Age | 70.8 ± 14.4 |
| Female | 33.3% (4) |
| Baseline NIHSSS | 18.5 (17–22.5) |
| Time to baseline MRI (hrs) | 3.9 ± 0.8 |
| Baseline DWI lesion volume (cm3) | 137.7 ± 33.8 |
| Time from baseline to follow up MRI (days) | 2.6 ± 1.7 |
| Follow up DWI lesion volume (cm3) | 233.8 ± 41.5 |
| IV tPA treatment | 50% (6) |
| NIHSS score at follow up MRI | 19 (16–23) |
| 90 day NIHSS score | 14.5 (9–42) |
| 90 day mRS | 5 (4–6) |
| Good outcome (mRS 0–2) | 8.3% (1) |
| Favorable outcome (mRS 0–4) | 41.7% (5) |
| Mortality | 33.3% (4) |
Values reported as mean ± standard deviation, median (interquartile range) or proportions.
Of the twelve patients who met study criteria, the average age was 70.8 (range: 41–86) years; median baseline NIHSS score was 18.5 (range: 10–25). There were 4 (33.3%) females. Seven (58.3%) strokes involved the right hemisphere. The mean time from symptom discovery to baseline MRI was 231 (range: 142–320) minutes. The average baseline DWI lesion size was 137.7 (range: 88.2–196.7) cm3.
Six (50%) patients received IV tPA. The mean time from baseline MRI to follow up MRI was 61.9 (range: 17.2–161.3) hours. The average follow up DWI lesion size was 233.8 (range: 160.5–288.5) cm3. Three of 11 (27.3%) patients with available NIHSS score at follow up MRI demonstrated END. The median 90-day NIHSS score was 14.5 (range: 5–42), and the median 90-day mRS was 5 (range: 1–6). Five (41.7%) patients achieved a favorable outcome (mRS 0–4), and four (33.3%) patients died. No patients underwent decompressive hemicraniectomy. Complete clinical and imaging data are provided as an online supplement (Table S1).
Imaging measures of infarct-related edema (Tables 2 & 3)
Table 2.
Baseline and follow-up volume measurements of the involved hemisphere (DWI scans, n=12)
| Mean hemisphere volume, baseline (cm3) | Mean hemisphere volume, follow up (cm3) | Mean hemisphere volume increase (cm3) | Mean percent increase in hemisphere volume (%) | P-value* | |
|---|---|---|---|---|---|
| Reader 1 | 467.0 ± 65.7 | 533.6 ± 60.3 | 66.6 ± 31.3 | 15.0 ± 9.3 | <0.0001 |
| Reader 2 | 453.6 ± 61.6 | 530.1 ± 59.7 | 76.4 ± 27.3 | 17.4 ± 8.0 | <0.0001 |
| Average of Reader 1,2 | 460.3 ± 62.7 | 531.8 ± 59.6 | 71.5 ± 27.0 | 16.2 ± 8.3 | <0.0001 |
Values reported as mean ± standard deviation.
Paired Student t test between baseline and follow up volumes (first two columns).
Table 3.
Baseline and follow-up lateral ventricle volumes in the involved hemisphere (DWI scans, n=12)
| Mean ventricle volume, baseline (cm3) | Mean ventricle volume, follow up (cm3) | Mean ventricle volume decrease (cm3) | Mean percent decrease in ventricle volume (%) | P-value* | |
|---|---|---|---|---|---|
| Reader 1 | 20.0 ± 8.5 | 11.3 ± 6.3 | 8.7 ± 4.9 | 45.0 ± 15.4 | 0.0001 |
| Reader 2 | 22.6 ± 8.8 | 12.8 ± 7.3 | 9.9 ± 5.2 | 46.1 ± 18.9 | <0.0001 |
| Average of Reader 1,2 | 21.3 ± 8.6 | 12.0 ± 6.8 | 9.3 ± 5.0 | 45.6 ± 16.9 | <0.0001 |
All twelve patients underwent baseline and follow up DWI scans. A representative outline of the imaging measures is shown in Figure 1. The mean baseline and follow up volumes of the involved hemisphere on DWI are provided for each reader in Table 2. In paired testing, the follow up hemisphere volumes were significantly larger than the corresponding baseline volumes for both readers (both p<0.0001). The average increase in hemisphere volume was 71.5 (range: 43.3–135.7) cm3, which represented a 16.2% (range: 9.8%–38.5%) increase over baseline.
The mean lateral ventricle volumes in the involved hemisphere on DWI are provided for each reader in Table 3. For both readers, the follow up ventricle volumes were significantly smaller than the corresponding baseline volumes (p=0.0001 for reader 1; p<0.0001 for reader 2). The average decrease in lateral ventricle volume was 9.3 (range: 4.5–21.8) cm3, which represented a 45.6% (range: 14.2%–77.7%) decrease from baseline.
There were four patients who underwent both baseline and follow up FLAIR imaging. Hemisphere volumes on FLAIR were larger than on DWI at both baseline (mean 473.3 ± 28.4 cm3 vs. 434.7 ± 46.1 cm3; p=0.10) and follow up (547.1 ± 28.9 cm3 vs. 517.6 ± 43.5 cm3; p=0.03). However, there were no significant differences in the hemisphere volume increase over time (68.9 ± 18.1 vs. 68.3 ± 26.9 cm3; p=0.97) or the percent increase (14.6 ± 4.0% vs. 16.1 ± 7.3%; p=0.76) for FLAIR versus DWI, respectively.
For lateral ventricle volume, there were no significant differences between FLAIR vs. DWI at baseline (mean 18.2 ± 10.9 cm3 vs. 19.8 ± 10.4 cm3; p=0.39) and follow up (12.0 ± 8.2 cm3 vs. 13.2 ± 8.3 cm3; p=0.25). Similarly, there were no significant differences in the ventricular volume decrease over time (8.5 ± 2.5 cm3 vs. 8.0 ± 3.6 cm3; p=0.75). However, the percent decrease was higher for FLAIR (57.2 ± 26.4% vs. 49.3 ± 26.5%; p=0.04).
Inter-rater agreement for edema measurements on DWI
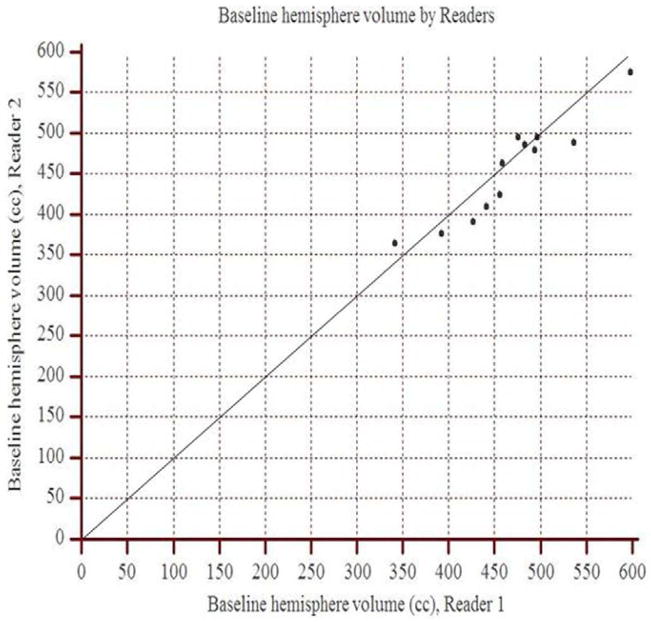
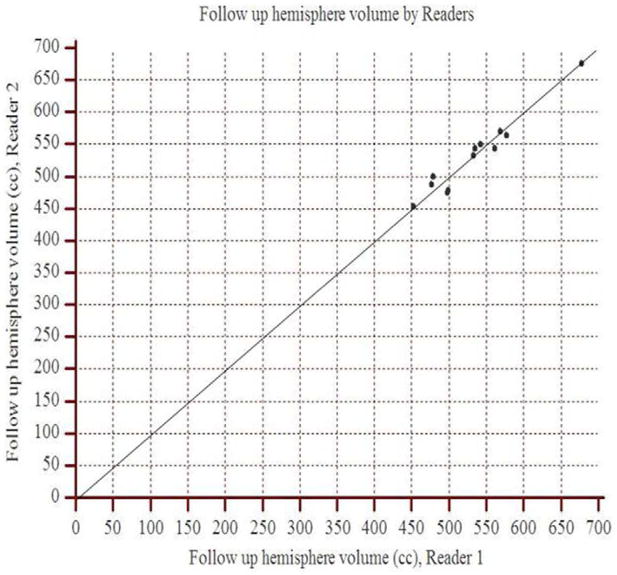
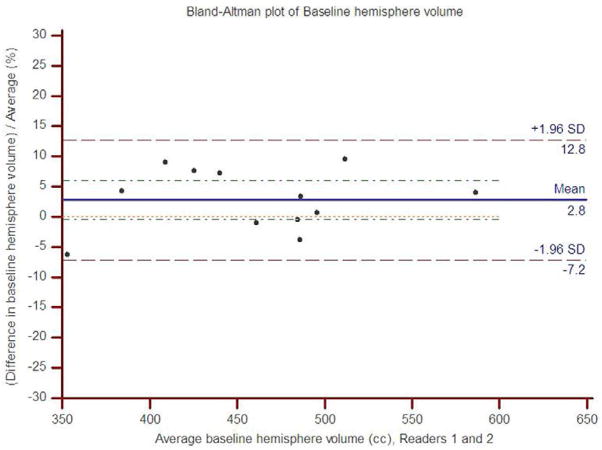
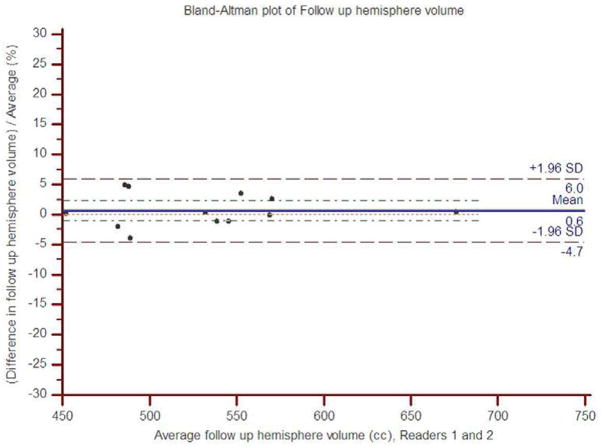
The concordance correlation coefficient between readers 1 and 2 for the baseline hemisphere volume was 0.92 (95% CI: 0.75 to 0.97), and for the follow up hemisphere volume, it was 0.97 (95% CI: 0.97 to 0.99). The scatter plots show the observed agreement between the two readers (Figure 2). The data points are scattered along the 45° diagonal line through the origin, which represents the identity line where the points would lie if agreement were perfect. The scatter plots show clustering along the line of agreement and similar numbers of points above and below the line. In Bland-Altman analysis of baseline volume, the mean percent difference between readers was 2.8% with limits of agreement (95% CI) of −7.2% to 12.8% (Figure 3). For follow up volume, the mean percent difference was 0.6% with limits of agreement between −4.7% and 6.0%.
Figure 2.
Scatter plots demonstrate the observed agreement between readers 1 and 2 for hemisphere volume measurements at (a) baseline and (b) follow up. On both graphs, data points approximate the identity line (slope=1) indicating strong agreement.
Figure 3.
Bland-Altman plots of percent inter-rater difference for hemisphere volume measurements relative to average hemisphere volume for (a) baseline and (b) follow up.
The concordance correlation coefficients for the baseline and follow up ventricle volumes were 0.94 (0.84 to 0.98) and 0.95 (0.88 to 0.98), respectively. In Bland-Altman analysis of baseline ventricle volume, the mean percent difference between readers was 51.1% with limits of agreement of −8.5% to 110.8%. For follow up ventricle volume, the mean difference was −10.0% with limits of agreement between −31.0% and 11.0%.
Relationships between edema measures and clinical and imaging outcomes (Table 4)
Table 4.
Comparisons of edema measures by clinical outcome and mortality
| No END* | END | P | Favorable outcome | Poor outcome | P | Survival | Death | P | |
|---|---|---|---|---|---|---|---|---|---|
| Hemisphere volume increase (cm3) | 59.7 ± 16.3 | 81.6 ± 17.7 | 0.08 | 58.4 ± 12.3 | 80.9 ± 31.4 | 0.16 | 67.7 ± 18.7 | 79.0 ± 41.7 | 0.52 |
| % Hemisphere volume increase | 12.2 ± 2.2 | 19.5 ± 5.4 | 0.008 | 12.1 ± 2.2 | 19.2 ± 9.9 | 0.11 | 14.5 ± 4.9 | 19.6 ± 13.1 | 0.51 |
| Ventricle volume decrease (cm3) | 9.2 ± 6.1 | 9.6 ± 2.8 | 0.91 | 10.7 ± 7.1 | 8.2 ± 3.0 | 0.42 | 10.3 ± 5.6 | 7.2 ± 3.1 | 0.33 |
| % Ventricle volume decrease | 43.3 ± 16.7 | 55.2 ± 19.9 | 0.34 | 45.7 ± 14.7 | 45.6 ± 19.6 | 0.99 | 46.7 ± 12.1 | 43.5 ± 26.5 | 0.77 |
END, early neurological deterioration; defined as NIHSS score increase of ≥4
The three patients with END had larger increases in hemisphere volume compared to the eight patients without END; this demonstrated a statistical trend (81.6 ± 17.7 cm3 vs. 59.7 ± 16.3 cm3; p=0.08) which did not meet our criteria for significance (p>0.05), although the sample size was small. The percent increase in hemisphere volume was significantly larger in patients with END (19.5 ± 5.4% vs. 12.2 ± 2.2%; p=0.008). In ROC analysis, the prediction of END was statistically significant for both absolute (area under the ROC curve [AUC]=0.83, p=0.04) and percent (AUC=0.92, p=0.0005) hemisphere volume increase. The optimal threshold for absolute hemisphere volume increase was 56.9 cm3 (sensitivity 100%, specificity 62.5% for END), and for percent increase it was 13.8% (sensitivity 100%, specificity 75% for END). Patients with END also demonstrated a trend toward smaller baseline hemisphere volume (423.6 ± 38.3 vs. 487.5 ± 51.9; p=0.09). There was no difference in final hemisphere volume (p=0.33). None of the ventricle volume measurements were statistically significantly associated with early neurological deterioration (Table 4).
Patients with favorable 90-day outcome (mRS 0–4) had smaller increases in hemisphere volume than those with poor outcome, although this did not achieve statistical significance (58.4 ± 12.3 cm3 vs. 80.9 ± 31.4 cm3; p=0.16). Similarly, the percent increase in hemisphere volume was smaller in those with favorable outcome (12.1 ± 2.2% vs. 19.2 ± 9.9%; p=0.11). In ROC analysis, the prediction of favorable outcome was statistically significant only for percent increase in hemisphere volume (AUC=0.80, p=0.02) with an optimal threshold of 15.0% (sensitivity 100%, specificity 57.1% for mRS 0–4). The optimal threshold for absolute volume increase was 74.6 cm3 (sensitivity 100%, specificity 57.1% for mRS 0–4; AUC=0.71, p=0.16). There were no significant differences in baseline (p=0.30) or final (p=0.64) hemisphere volume between patients with and without a favorable outcome. No statistically significant differences were detected in the ventricle volume measurements between those having a favorable vs. poor 90-day outcome (Table 4).
Among patients who died, the absolute and percent increases in hemisphere volume were numerically greater, although the differences were not statistically significant. Neither were there differences in baseline (p=0.21) or final (p=0.32) hemisphere volume between death and survival. None of the ventricle volume measurements were statistically significantly different for those who survived versus died (Table 4).
There was no significant correlation between midline shift and absolute (r=−0.17, p=0.59) or percent (r=−0.21, p=0.51) hemisphere volume increase. Similarly, there was no significant correlation between midline shift and absolute (r=−0.07, p=0.82) ventricle volume decrease. However, there was a significant correlation between midline shift and percent ventricle volume decrease (r=0.63, p=0.03). Midline shift was not associated with END (p=0.58), favorable outcome (p=0.51) or mortality (p=0.89).
DISCUSSION
Our findings demonstrate that within the first three to five days of severe hemispheric stroke onset, volumes of the cerebral hemisphere and lateral ventricle determined using MRI change in a manner consistent with edema formation. Specifically, there is significant growth in hemisphere volume and significant reduction in ventricular volume over time. Importantly, these measurements demonstrate excellent inter-rater agreement. In addition, we have shown that increases in hemisphere volume are predictive of both early neurological deterioration and poor 90-day functional outcome, supporting their longitudinal validity and use as a biomarker of malignant stroke-related edema.
Cerebral edema is common in patients with malignant infarction and leads to poor outcome, including death. The earliest phase of cerebral edema formation is characterized by cytotoxic edema, where ions move between the extra- and intracellular spaces, and water follows along a consequent osmotic gradient.9 This phase occurs in the first several hours of ischemia, when the blood brain barrier is intact. The second phase represents vasogenic edema and occurs in the setting of blood-brain barrier disruption. Permeability of macromolecules increases significantly, and hydrostatic and osmotic forces play an increasingly important role.10 It is vasogenic edema which accounts for the increase in hemispheric water content and volume.3 Our findings support the use of MRI to quantitatively measure this volume increase, and are consistent with data from a rat MCA stroke model demonstrating a strong correlation (r=0.95) between hemisphere growth measured by MRI and the absolute increase in brain water content.11
A neuroimaging biomarker must satisfy two requirements: demonstration of a strong association with relevant clinical endpoints, and good measurement reliability. Based on our exploratory analysis, the optimal imaging parameter for cerebral edema is the change in hemisphere volume, in particular the percent change relative to the baseline hemisphere size. The percent hemisphere growth was the strongest predictor of both END (AUC=0.92) and favorable outcome at 90 days (AUC=0.80), and meets accepted criteria for biomarker validation (AUC ≥0.80).12 The optimal thresholds for predicting END or a favorable outcome were similar and were in the range of greater than or less than a 14–15% increase in hemisphere volume, respectively. The absolute increase in hemisphere volume was a significant predictor of END (AUC=0.83), but not for 90-day favorable outcome. However, this may be related to the small number of patients in this analysis. Ventricular volume measurements were not significantly associated with any of the clinical endpoints.
With respect to measurement reliability, there was strong inter-observer agreement for both hemisphere and lateral ventricle volumes using the concordance correlation coefficient (>0.9 in all cases). However, given the small size of the ventricles, the variance was of similar magnitude to the percent change related to edema. The mean relative decrease in ventricle volume between the baseline and follow up imaging was 45.6%, and the mean inter-observer difference for the baseline ventricle volume was 51.1%. On the other hand, the mean relative increase in hemisphere volume between the two scans was 16.2%, which is several-fold larger than the mean inter-observer differences of 2.8% for the baseline hemisphere volume and 0.6% for the follow up volume. Therefore, measurement error would be much less likely to affect the measurement of edema using hemisphere volumes.
With respect to imaging modality, we utilized diffusion imaging for our volume measurements because it was available at both time points in all twelve patients. Comparing hemisphere volumes between diffusion and FLAIR scans in the same patients (n=4), the volumes were greater by an average of approximately 40 cm3 on the FLAIR images at baseline (p=0.10) and at follow up (p=0.03). However, there was no significant difference in the absolute or percent increase in hemisphere size between the two modalities. Therefore, it appears critical that calculations of volume change be performed using measurements derived from the same modality.
The lack of association of our imaging measures with mortality likely stems from selection bias. EPITHET excluded patients with major early ischemic changes on baseline NCCT, removing those patients most likely to have malignant edema, herniation and death.13 This is supported by the much lower mortality rate in our cohort (33%) compared with control populations in randomized trials of hemicraniectomy (71%).1 This selection bias would further explain our low rate of significant midline shift. Only two patients in our cohort demonstrated shift greater than 10 mm (one died and the other had a 90-day mRS of 4).
Because our patients had lesser degrees of mass effect compared to traditional malignant stroke populations, our findings suggest that cerebral edema may produce neurologic dysfunction and impair functional outcome independent of global mass effect and herniation. This is supported by the greater clinical importance of relative hemisphere growth compared to absolute growth in our study. One potential explanation is that cerebral edema may have local compressive effects that may impair collateral circulation and brain metabolism in the absence of brain herniation.4 While these results are clearly preliminary, they suggest that imaging measures of stroke-related edema in the early subacute period may provide additional prognostic information over baseline (<6 hours) imaging findings such as DWI lesion volume >82 cm3, and may serve as an effective biomarker for anti-edema strategies in patients with severe ischemic stroke.
There are several limitations to our study. First, the EPITHET cohort contained a relatively small number of patients who presented with large hemispheric infarction. This was due in part to the exclusion of patients with major early ischemic change on baseline noncontrast CT scan. Despite this limitation, we were able to demonstrate statistically significant increases in hemisphere volumes between serial MRI exams and statistically significant associations between hemisphere growth and patient outcomes. Second, as mentioned above, our cohort had a more benign clinical course than previously described malignant stroke populations deemed eligible for hemicraniectomy. Thus, our findings, particularly with respect to clinical outcome prediction, require further investigation. Third, follow up scans were performed at variable time points following stroke onset, and this may have introduced variability in edema formation and hence our volume measurements. Because edema-related neurological deterioration following stroke usually occurs by 48 hours14 and treatments such as hemicraniectomy are beneficial in this time window,1 future studies should evaluate early edema formation within the first 24–36 hours. Finally, our findings pertain only to patients with severe ischemic stroke. The imaging measures used in this study may not adequately quantify edema or correlate with clinical outcome in milder forms of stroke and should be tested in more diverse populations.
CONCLUSIONS
In this exploratory analysis, we have demonstrated statistically significant growth in hemisphere volume over the first three to five days after the onset of severe hemispheric infarction, consistent with expected changes from cerebral edema. MRI-based measurements of hemisphere growth appear to be a suitable biomarker for stroke-related edema formation given the strong association with relevant clinical endpoints and the small relative inter-rater differences. These findings require prospective validation in a larger stroke population.
Supplementary Material
Footnotes
Disclosures:
- Albert Yoo – Penumbra, Inc for core imaging laboratory activities
- Kevin Sheth – Research Funding - American Academy of Neurology Clinical Research Award, American Heart Association Clinical Research Award, Remedy Pharmaceuticals, Inc
- W. Taylor Kimberly - American Academy of Neurology Clinical Research Award, Clinical Investigator Training Program: Beth Israel Deaconess Medical Center – Harvard Medical School, in collaboration with Pfizer Inc. and Merck & Co., NIH 1K23NS076597
- Zeshaun Chaudhry – None
- Jordan J. Elm – None
- Sven Jacobson – CEO, Remedy Pharmaceticals
- Stephen Davis – Advisor boards - PAION, Servier, and Novo Nordisk; honoraria Novo Nordisk, Sanofi-Aventis, Pfizer, and Boehringer Ingelheim.
- Geoffrey Donnan – Advisory boards - Boehringer Ingelheim, PAION, Servier, and Sanofi-Aventis; honoraria or consulting payments from and has had costs of participating in scientific meetings reimbursed by Boehringer Ingelheim, Sanofi-Aventis, Servier. Grant funding from Sanofi-Aventis, and grants and consultancy payments from Boehringer Ingelheim
- Gregory Albers - Grant funding: NIH, Lundbeck; Consulting: Lundbeck; Equity: iSchemaView
- Barney Stern – NIH
- Ramon Gil Gonzalez – None
Publisher's Disclaimer: This is a PDF file of an unedited manuscript that has been accepted for publication. As a service to our customers we are providing this early version of the manuscript. The manuscript will undergo copyediting, typesetting, and review of the resulting proof before it is published in its final citable form. Please note that during the production process errors may be discovered which could affect the content, and all legal disclaimers that apply to the journal pertain.
References
- 1.Vahedi K, Hofmeijer J, Juettler E, Vicaut E, George B, Algra A, et al. Early decompressive surgery in malignant infarction of the middle cerebral artery: A pooled analysis of three randomised controlled trials. Lancet Neurol. 2007;6:215–222. doi: 10.1016/S1474-4422(07)70036-4. [DOI] [PubMed] [Google Scholar]
- 2.Venkatasubramanian C, Mlynash M, Finley-Caulfield A, Eyngorn I, Kalimuthu R, Snider RW, et al. Natural history of perihematomal edema after intracerebral hemorrhage measured by serial magnetic resonance imaging. Stroke. 2011;42:73–80. doi: 10.1161/STROKEAHA.110.590646. [DOI] [PMC free article] [PubMed] [Google Scholar]
- 3.Donkin JJ, Vink R. Mechanisms of cerebral edema in traumatic brain injury: Therapeutic developments. Curr Opin Neurol. 2010;23:293–299. doi: 10.1097/WCO.0b013e328337f451. [DOI] [PubMed] [Google Scholar]
- 4.Walberer M, Ritschel N, Nedelmann M, Volk K, Mueller C, Tschernatsch M, et al. Aggravation of infarct formation by brain swelling in a large territorial stroke: A target for neuroprotection? J Neurosurg. 2008;109:287–293. doi: 10.3171/JNS/2008/109/8/0287. [DOI] [PubMed] [Google Scholar]
- 5.Thomalla G, Hartmann F, Juettler E, Singer OC, Lehnhardt FG, Kohrmann M, et al. Prediction of malignant middle cerebral artery infarction by magnetic resonance imaging within 6 hours of symptom onset: A prospective multicenter observational study. Ann Neurol. 2010;68:435–445. doi: 10.1002/ana.22125. [DOI] [PubMed] [Google Scholar]
- 6.Davis SM, Donnan GA, Parsons MW, Levi C, Butcher KS, Peeters A, et al. Effects of alteplase beyond 3 h after stroke in the echoplanar imaging thrombolytic evaluation trial (epithet): A placebo-controlled randomised trial. Lancet Neurol. 2008;7:299–309. doi: 10.1016/S1474-4422(08)70044-9. [DOI] [PubMed] [Google Scholar]
- 7.Lin LI. A concordance correlation coefficient to evaluate reproducibility. Biometrics. 1989;45:255–268. [PubMed] [Google Scholar]
- 8.Bland JM, Altman DG. Statistical methods for assessing agreement between two methods of clinical measurement. Lancet. 1986;1:307–310. [PubMed] [Google Scholar]
- 9.Simard JM, Kent TA, Chen M, Tarasov KV, Gerzanich V. Brain oedema in focal ischaemia: Molecular pathophysiology and theoretical implications. Lancet Neurol. 2007;6:258–268. doi: 10.1016/S1474-4422(07)70055-8. [DOI] [PMC free article] [PubMed] [Google Scholar]
- 10.Vorbrodt AW, Lossinsky AS, Wisniewski HM, Suzuki R, Yamaguchi T, Masaoka H, et al. Ultrastructural observations on the transvascular route of protein removal in vasogenic brain edema. Acta Neuropathol. 1985;66:265–273. doi: 10.1007/BF00690958. [DOI] [PubMed] [Google Scholar]
- 11.Gerriets T, Stolz E, Walberer M, Muller C, Kluge A, Bachmann A, et al. Noninvasive quantification of brain edema and the space-occupying effect in rat stroke models using magnetic resonance imaging. Stroke. 2004;35:566–571. doi: 10.1161/01.STR.0000113692.38574.57. [DOI] [PubMed] [Google Scholar]
- 12.Johnston KC, Barrett KM, Ding YH, Wagner DP. Clinical and imaging data at 5 days as a surrogate for 90-day outcome in ischemic stroke. Stroke. 2009;40:1332–1333. doi: 10.1161/STROKEAHA.108.528976. [DOI] [PMC free article] [PubMed] [Google Scholar]
- 13.Krieger DW, Demchuk AM, Kasner SE, Jauss M, Hantson L. Early clinical and radiological predictors of fatal brain swelling in ischemic stroke. Stroke. 1999;30:287–292. doi: 10.1161/01.str.30.2.287. [DOI] [PubMed] [Google Scholar]
- 14.Qureshi AI, Suarez JI, Yahia AM, Mohammad Y, Uzun G, Suri MF, et al. Timing of neurologic deterioration in massive middle cerebral artery infarction: A multicenter review. Crit Care Med. 2003;31:272–277. doi: 10.1097/00003246-200301000-00043. [DOI] [PubMed] [Google Scholar]
Associated Data
This section collects any data citations, data availability statements, or supplementary materials included in this article.


