

Abstract
Alterations in cell metabolism are increasingly recognized as a hallmark of cancer and are being exploited for the development of diagnostic tools and targeted therapeutics. Recently, 13C magnetic resonance spectroscopy (MRS)-detectable hyperpolarized pyruvate to lactate conversion was validated in models as a noninvasive imaging method for the detection of tumors and treatment response, and successfully passed phase I clinical trials. To date, response to treatment was associated with a drop in hyperpolarized lactate production. Here, we monitored the effect of treatment with the MEK inhibitor U0126 in prostate and breast cancer cells. Following treatment we observed a 31% drop in flux of hyperpolarized 13C label in treated MCF-7 breast cancer cells compared to controls. In contrast and unexpectedly, flux increased to 167% in treated PC3 prostate cancer cells. To mechanistically explain these observations we investigated treatment-induced changes in the different factors known to affect pyruvate to lactate conversion. NADH levels remained unchanged whereas lactate dehydrogenase expression and activity as well as intracellular lactate increased in both cell lines, providing an explanation for the elevated hyperpolarized lactate observed in PC3 cells. The expression of MCT1, which mediates pyruvate transport, dropped in treated MCF-7 but not in PC3 cells. This identifies pyruvate transport as rate limiting in U0126-treated MCF-7 cells and explains the drop in hyperpolarized lactate observed in those cells following treatment. Our findings highlight the complexity of interactions between MEK and metabolism, and the need for mechanistic validation before hyperpolarized 13C MRS can be used for monitoring treatment-induced molecular responses.
Keywords: Hyperpolarized pyruvate, lactate, U0126, breast cancer, prostate cancer
Introduction
The clinical availability of an increasing number of new targeted therapies and treatment options requires timely and effective methods to evaluate individual response in order to improve the outcome by personalizing treatment. However, the evaluation of response to targeted therapies using traditional imaging methods is complicated by the fact that this response is frequently associated with inhibition of growth or tumor stasis and therefore only detectable after prolonged treatment. The development of novel methods to evaluate early response is therefore of key importance. Several novel imaging methods, recently introduced in the clinic or under development, exploit altered tumor metabolism and its normalization in treatment-responsive tumors as methods to evaluate treatment response. Most notably, when compared to their normal counterparts, several oncogenically transformed cells are known to have increased glycolytic rates, known as the Warburg effect (1). This peculiar aspect of cancer cell metabolism has been successfully exploited in the clinic, whereby monitoring the increased uptake of the glucose analogue [18F]-2-fluoro-2-deoxy-D-glucose (FDG) using positron emission tomography (PET) enables the detection of tumors in vivo. Similarly, FDG-PET has also been used for the evaluation of clinical outcome and the early detection of tumor response to treatment (2–8). However, this approach is limited by the fact that the readout can be affected by such factors as high background glucose uptake, for example in brain, the presence of inflammation in the area of the tumor, or hyperglycemia (9–12). Restrictions on radiation exposure can also limit the use of PET for assessing response to targeted therapies, particularly if long term monitoring of response through repeat longitudinal imaging is required. In addition, the detection of elevated lactate using 1H magnetic resonance spectroscopy (MRS) has also been proposed as a readout of tumor metabolism (13).
More recently, an alternative approach, based on the combination of dynamic nuclear polarization (DNP) and 13C MRS, has been used to monitor abnormal tumor metabolism and detect response to a range of antineoplastic treatments. Several compounds have been successfully hyperpolarized and their metabolism detected in cancer cells and animals models, including pyruvate (14–23), bicarbonate (24), glutamine (25), glutamate (26), fumarate (27), succinate (28, 29), ketoisocaproate (30), acetate (31), and fructose (32). This approach has shown great potential in preclinical models and a highly successful phase I clinical trial was recently concluded at UCSF ((33); http://clinicaltrials.gov/ct2/show/NCT01229618).
Pyruvate is the substrate that has received most attention for hyperpolarized 13C MRS applications. Owing to its relatively long T1 relaxation time and its central role in several key metabolic pathways, pyruvate provides a method to probe the rate of pyruvate to lactate conversion, alanine production and flux into the citric acid cycle, depending on the specific 13C labeling scheme of the substrate used. In the context of cancer, pyruvate has proved valuable in the evaluation of response to therapy early during treatment in in vitro and in vivo models. An approximately 80% reduction in the conversion of hyperpolarized pyruvate to lactate was observed in a murine lymphoma model after only 16 h of treatment with etoposide, as well as after radiation and temozolomide treatment (16, 34, 35). A decrease in hyperpolarized lactate was observed following administration of dichloroacetate in lung cancer cells (21). Recently, we used hyperpolarized 13C MRS of pyruvate to monitor the effect of inhibition of the phosphoinositide 3-kinase (PI3K) pathway. We observed a significant decrease in pyruvate to lactate conversion prior to a detectable change in tumor size following treatment with a PI3K or a mammalian target of rapamycin (mTOR) inhibitor in breast cancer and glioma models, and following inhibition of the upstream platelet-derived growth factor receptor in a prostate cancer model (15, 22, 36).
Although these studies have all reported a decrease in pyruvate to lactate conversion following treatment, the mechanism driving this drop can differ. Several factors regulate hyperpolarized lactate production. First, hyperpolarized pyruvate needs to be transported from the extracellular space into the cell. This is mediated by monocarboxylate transporters (MCTs) (37–39). Several MCT isoforms are expressed in mammalian cells with MCT1–4 regulating pyruvate and lactate transport (39). Among these, MCT1 and MCT4 have the widest tissue distribution. MCT1 has a greater affinity for pyruvate than MCT4. The Km value for MCT1 is ~2 mM whereas it is over 100 mM for MCT4 (39) Accordingly, MCT1 is likely the main transporter for hyperpolarized pyruvate and was proposed as the rate limiting step for hyperpolarized lactate production in the case of T47D breast cancer cells (38). Once inside the cell, hyperpolarized pyruvate can be converted to lactate by lactate dehydrogenase (LDH), with NADH as a necessary cofactor (40). The level of LDH expression was shown as the dominant factor mediating a decrease in hyperpolarized lactate in PI3K inhibited cells, whereas a decrease in NADH mediates this effect in etoposide-treated cells (15, 16, 22, 36). Finally, the size of the intracellular lactate pool has also been shown to affect the hyperpolarized pyruvate to lactate conversion (16). Treatment can therefore affect the pyruvate to lactate conversion by modulating MCT1, LDH, NADH or the size of the lactate pool.
Here, we investigated for the first time the effect of treatment with the mitogen-activated protein kinase/extracellular signal-regulated kinase kinase (MEK) inhibitor U0126 on hyperpolarized pyruvate to lactate conversion in prostate and breast cancer cells. Since the mitogen-activated protein kinase (MAPK) signaling pathway is known to affect cell metabolism, including glucose metabolism, we were interested in investigating whether hyperpolarized pyruvate could represent a valuable readout of MAPK inhibition (41). In the MCF-7 breast cancer cells treatment led to a decrease in hyperpolarized lactate levels. In contrast, and unexpectedly, in PC3 prostate cancer cells hyperpolarized lactate increased following treatment. Our mechanistic studies indicate that, while in both cell lines drug treatment induced increased LDH expression and activity as well as an elevation in total intracellular lactate levels, the drop in hyperpolarized pyruvate to lactate conversion observed in MCF-7 cells was due to a drop in MCT1 expression in those cells. These observations highlight the complexity of factors affecting the hyperpolarized pyruvate to lactate conversion, and indicate that hyperpolarized MRS findings require mechanistic validation before they can be used to monitor response to treatment with MAPK inhibitors.
Methods
Cell culture and treatments
PC3 (prostate) and MCF-7 (breast) cancer cell lines were obtained from American Type Culture Collection via the UCSF Cell Culture Facility (San Francisco, CA, USA). All the experiments were performed within 6–12 months of cell line authentication (using short tandem repeat (STR) analysis, PowerPlex 1.2 System, Promega, Madison, WI, USA) and mycoplasma testing (MycoAlert™ mycoplasma detection kit, Lonza, Rockland, ME, USA). Cells were maintained in exponential proliferation in Dulbecco’s Modified Eagle’s Medium (DMEM) supplemented with 10% heat-inactivated fetal bovine serum, 2 mM L-glutamine, 100 units ml−1 of penicillin and 100 μg ml−1 of streptomycin and cultured in a humidified chamber at 37 °C in an atmosphere of 5% CO2 in air.
For all the experiments cells were incubated for 48 hours with 50 μM and 25 μM U0126 (LC Laboratories, Woburn, MA, USA) for PC3 and MCF-7 cells, respectively. Treatment doses were determined as follows. First response to different doses of U0126 was assessed using the WST-1 cell proliferation assay as previously described (22). Treatment doses were then selected such that they decreased cell proliferation to approximately 50% of solvent control after 48 hours of treatment. All treatments were performed with matching DMSO (dimethylsulfoxide) solvent controls (1:1000 final concentration in culture medium) and were replenished every 24 hours. The effect of drug treatment on cell size was monitored using a Coulter Counter and no significant changes were observed.
Western Blotting
The effect of treatment with U0126 on the levels of proteins of interest was analyzed by Western blotting. Whole cell extracts were obtained (RIPA buffer, Cell signaling, Danvers, MA, USA) and separated on 4% to 20% SDS-PAGE gels (Bio-Rad, Hercules, CA, USA). Proteins were then transferred onto nitrocellulose membranes, blocked and incubated with primary and secondary (anti-IgG horseradish peroxidase-linked, Cell Signaling) antibodies. Primary antibodies against p44/42 MAPK (ERK1/2), phospho- p44/42 MAPK (p-ERK1/2), β-actin (as loading control; Cell Signaling), LDHA (Epitomics, Burlingame, CA, USA for PC3 and Cell Signaling for MCF-7 cells) and MCT1 (Santa Cruz Biotechnology, Santa Cruz, CA, USA) were used. Immunocomplexes were visualized using Pierce ECL Western Blotting Substrate (Pierce Biotechnology, Rockford, IL, USA). Quantification of bands was performed using the gel analysis submenu of ImageJ (http://rsbweb.nih.gov/ij/index.html).
NADH Quantification
Steady state intracellular levels of NADH were determined in cell lysates using a spectrophotometric enzymatic cycling assay, as previously described (15). Briefly, cells were harvested by trypsinization, washed and lysed by freeze-thaw (2 cycles). In order to quantify the levels of NADH, cell lysates were heated at 60 °C for 30 min to selectively destroy NAD+. Changes in absorbance at 570 nm due to reduction of the reporter molecule thiazolyl blue were spectrophotometrically measured on a M200 Tecan spectrophotometer and compared to a standard curve established using known NADH concentrations.
LDH Activity Assay
LDH activity was monitored in vitro by detecting consumption of the cofactor NADH during the LDH-catalyzed conversion of pyruvate to lactate in cell lysates, as previously described (15). Briefly, cell lysates were obtained and NADH consumption was monitored for 10 minutes at 340 nm on a Tecan spectrophotometer. Km and Vmax values were calculated by fitting the initial velocity plots using a Lineweaver-Burke plot.
Cell extraction and proton MRS data acquisition and analysis
Cell extracts were prepared as previously described (42–44). Briefly, cell samples were grown as a monolayer in tissue culture flasks and were treated either with the appropriate dose of U0126 or solvent. After 48 hours of treatment cells were placed on ice and extracted using the dual phase extraction method as previously described (45). A parallel flask was trypsinized and used to count the cells. At the time of extraction the extracellular medium was also collected and 1 ml snap frozen and stored at −80 °C until the 1H MR analysis.
The acquisition of 1H MR spectra was performed at 600 MHz using a 90° pulse, 3 s relaxation delay, 8 kHz spectral width and either presat or excitation sculpting (46) for suppression of the water signal. Sodium 3-(trimethylsilyl)propionate-2,2,3,3-d4 (TMSP; Cambridge Isotope Laboratories, Andover, MA, USA) was used as internal reference. Fully relaxed spectra (90° pulse and 60 s relaxation delay) were also obtained and saturation correction factors were used for the quantification of lactate concentrations. ACD/Spec Manager version 9.15 (Advanced Chemistry Development) software was used for the analysis of spectra and for peak area integration. Peak assignments were based on previous literature and available databases such as HMDB (http://www.hmdb.ca/) and BML (www.bml-nmr.org). The intensities of total intracellular and extracellular lactate were obtained by integration of the proton MR spectra and were normalized to cell number.
Cell perfusion system
For MRS studies of live cells, experiments were performed using a cell perfusion (bioreactor) system. Briefly, cells were seeded and allowed to adhere and grow on Biosilon® microcarrier beads (Nunc, Roskilde, Denmark) for approximately 24 hours prior to starting treatment. Because treatment inhibited cell growth and because we wanted to have comparable cell numbers in control and treated samples, 4 × 10⁷ cells were seeded for samples receiving U0126 treatment and 2–3 × 10⁷ cells for control samples. Cells were treated for approximately 48 hours prior to the MRS analysis. In addition to the cells required for the MRS studies, one extra aliquot of cells was seeded on microcarrier beads at the same density and treated in the same way. At the time of the MRS study these cells were detached from the microcarrier beads by trypsinization and used to obtain a cell count. Immediately prior to MRS studies, the cell-bearing beads were loaded into a MR-compatible bioreactor system previously described (22, 42, 47). Briefly, a perfusion system consisting of one inflow and two outflow lines enabled circulation of growth medium to a 10-mm MR tube at the bottom of which the cells on beads were immobilized. The system was under a 5% CO2/95% air over-pressure and placed in the MR probe at 35 °C. A three-way valve allowed for introduction of hyperpolarized material to the inflow line. The growth medium (100 ml) was circulated at 1.5 ml min−1 throughout the MRS studies and contained either the appropriate dose of U0126 or DMSO.
Hyperpolarization and injection of hyperpolarized material
Samples of 1-13C pyruvic acid (Isotech, Sigma Aldrich, St. Louis, MO, USA) containing 15 mM of the OX063 trityl radical (Oxford Instruments, Tubney Wood, UK) were hyperpolarized using the Hypersense DNP polarizer (Oxford Instruments) as previously described (14, 17). After 1–1.5 h, polarized pyruvic acid was rapidly dissolved in 6 ml of isotonic 40 mM Tris-based buffer containing 3.0 μM EDTA (to achieve a final pH of 7.8) and injected into the perfusion system within 15 s at approximately 37 °C and to a final concentration of 5 mM hyperpolarized pyruvate. To prevent rapid wash out of the hyperpolarized substrate, the perfusion system was stopped briefly during injection of hyperpolarized pyruvate and the subsequent acquisition of 13C spectra and was restarted immediately after the completion of data acquisition.
MRS data acquisition and analysis
All MRS studies on live cells were performed on a 500 MHz INOVA NMR spectrometer (Varian, Palo Alto, CA, USA) equipped with a 10 mm broadband probe. Prior to and at the end of each experiment, 31P MRS spectra were acquired to confirm cell viability. A single injection was performed on each PC3 cell samples while a maximum of 2 injections were performed in MCF-7 cells few hours apart of each other. To exclude the possibility that the outcome of the second injection can be influenced by the first injection, data from the two injections were compared. No significant difference was observed. 31P spectra were acquired using a pulse-acquire scheme with 30° pulse, 3 s relaxation delay, 8k datapoints, 8 kHz spectral width and composite pulse 1H decoupling during acquisition. Following injection of hyperpolarized pyruvate, single-transient 13C spectra were acquired every 3 s over a period of 300 s using 5° pulses, 40k datapoints and 20 kHz spectral width. The ACD/Spec Manager version 9.15 software was used for data analysis. Peak area integration was performed and the intensities of the hyperpolarized lactate peak were normalized to the intensity of the total hyperpolarized signal at maximum and to cell number. Changes in the conversion of pyruvate into lactate levels were determined by comparing the maximum normalized lactate levels in control and treated cells, as previously described (22). In addition, the apparent pyruvate to lactate rate constants (kP) were determined by fitting the levels of hyperpolarized pyruvate and lactate over time to the Bloch equations, as previously described (16, 22). The apparent pyruvate to lactate flux, Vobs, was then obtained by multiplying kP by the concentration of pyruvate.
Studies in cell lysates
To discriminate the individual contribution of LDH and MCT to Vobs determined in intactcells, we used a previously described method (48) and determined the apparent LDH flux VLDH in cell lysates (where VMCT=0) and then calculated VMCT assuming Vobs −1=VLDH−1+VMCT−1 (48). Following appropriate treatment, approximately 107 cells were passed 5 times through a fine needle syringe and lysed by sonication in 100 mM Tris-HCl buffer (pH 8) with 100 mM NaCl, 10 mM DTT and 1 mM EDTA. Lysates were spun down (14,000 rpm for 30 min at 4 °C) and the supernatant was transferred to a 10 mm NMR tube. Hyperpolarized pyruvate (hyperpolarization and dissolution as described above) was injected in the NMR tube to final concentrations of 2.5, 5 and 10 mM. Acquisition of MR spectra (as described above) was started immediately after injection and data analyzed as above.
Statistics
All data are reported as mean ± S.D. Statistical significance was determined using a student t-test with p<0.05 considered significant.
Results
Effect of treatment with U0126 on signaling
The inhibition of MAPK signaling following treatment with the MEK-inhibitor U0126 was confirmed in PC3 and MCF-7 cells by probing for ERK and p-ERK levels in untreated and treated cells. As illustrated in Figure 1, p-ERK levels dropped in both of our cell lines confirming the molecular effect of U0126.
Figure 1.

Inhibition of MAPK signaling following treatment with U0126. The successful inhibition of MAPK signaling following treatment with the MEK inhibitor U0126 in PC3 and MCF-7 cells (50 μM and 25 μM, respectively) was confirmed by probing ERK and pERK levels by Western blotting.
Effect of treatment with U0126 on conversion of hyperpolarized pyruvate into lactate
Modulation of conversion of hyperpolarized 1-13C pyruvate into lactate in live PC3 and MCF-7 cells treated with U0126 was probed using 13C MRS. Comparison of the maximum hyperpolarized lactate levels in MCF-7 cells indicated that treatment with U0126 induced a drop to 62 ± 26% (p = 0.05) of control. In contrast, the maximum hyperpolarized lactate levels in treated PC3 cells increased to 162 ± 23% (p = 0.02) compared to control cells. In addition we calculated the apparent hyperpolarized pyruvate to lactate flux Vobs (representative fits shown in Figure 2A). In agreement with the changes in maximum lactate levels, we found that in MCF-7 cells treatment with U0126 induced a drop to approximately 69% of control from 45±11 to 31±6 fmol/cell/min (p = 0.025, N=6–9), whereas in treated PC3 cells the flux of hyperpolarized 13C label increased to 167% of control from 23±6 to 39±9 fmol/cell/min (p = 0.02, N=5; Figure 2B). Importantly, 31P MR spectra recorded prior to and following hyperpolarized pyruvate injection were unchanged (data not shown) for each individual combination of cell line and treatment condition. In particular this was true for nucleoside triphosphate (NTP) levels, and confirmed that cell viability was not affected by exposure of cells to hyperpolarized pyruvate. When comparing control and treated cells, our 31P MRS data confirmed previous findings and detected a drop in phosphocholine levels (49).
Figure 2.

Effects of treatment with U0126 on PC3 and MCF-7 cell metabolism. (A) Experimental build-up curves (symbols) for hyperpolarized lactate and their fit to the Bloch equation (solid line) for untreated and U0126-treated PC3 cells; (B) Flux of 13C hyperpolarized label in untreated (black) and U0126-treated (white) PC3 and MCF-7 cells. Data is shown as mean ± standard deviation. *: p<0.025.
Total intracellular lactate levels
Because the conversion of hyperpolarized pyruvate to lactate can be affected by intracellular lactate levels, we first assessed the effect of U0126 on the concentration of intracellular lactate using 1H MRS of cell extracts. Our findings are illustrated in Figure 3A. Treatment resulted in a significant increase in total intracellular lactate to 134 ± 16% (p=0.002, N=8) and 206 ± 42% (p=0.001, N=3) of control in PC3 and MCF-7 cells, respectively (Figure 3B). Consistent with the intracellular lactate levels, data from PC3 cells showed that the extracellular lactate in medium also increased with treatment to 174% of control from 7.7 ± 0.1 to 13.5 ± 0.4 μmol/106 cells (p=0.001, N=3).
Figure 3.

Effects of treatment with U0126 on PC3 and MCF-7 cell metabolism. (A) Enlarged proton spectral regions (between 1.3–1.36 ppm and 4.1–4.16 ppm, the latter shown with 10 times increased intensity) showing the lactate signals in untreated and U0126-treated PC3 cells. Data is shown as mean (symbols) ± standard deviation (shaded area). (B) Intracellular lactate concentrations (fmol/cell) in untreated (black) and U0126-treated (white) PC3 and MCF-7 cell extracts as quantified from proton spectra. Data is shown as mean ± standard deviation. *: p<0.002.
LDH level and activity
LDH is the enzyme that catalyzes the conversion of pyruvate to lactate. The effect of treatment with U0126 on LDH expression and activity was assessed in PC3 and MCF-7 cells. Consistent with the increase in total intracellular lactate levels observed in both cell lines, LDHA protein levels increased in both PC3 (138 ± 19%, p=0.03, N=4) and MCF-7 (212 ± 57%, p=0.03, N=4) cells following treatment with U0126 (Figure 4A). Similarly, LDH activity (Vmax calculated from the spectrophotometric data) increased significantly to 136 ± 18% of control (p=0.037, N=3) in PC3 cells and to 245 ± 38% of control (p=0.02, N=4) in MCF-7 cells following treatment with U0126 (Figure 4B).
Figure 4.
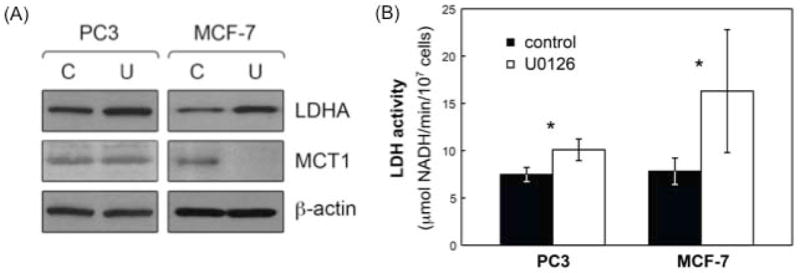
Effects of treatment with U0126 on LDHA expression and activity and MCT1 levels in PC3 and MCF-7 cells. (A) LDHA and MCT1 levels in untreated (solvent control; C) and U0126-treated (U) PC3 and MCF-7 cells probed using Western blotting. β-actin was used as a loading control; (B) LDH activity modulation in untreated (black) and U0126-treated (white) PC3 and MCF-7 cells. Data is shown as mean ± standard deviation. *: p<0.037.
NADH level
The conversion of pyruvate into lactate is catalyzed by LDH with NADH serving as its cofactor and thus NADH can affect hyperpolarized pyruvate to lactate conversion (16). We probed the effect of U0126 treatment on steady state intracellular NADH levels and found that, in both PC3 and MCF-7 cells, levels of NADH remained unchanged following treatment (Figure 5).
Figure 5.

Effects of treatment with U0126 on intracellular NADH levels in PC3 and MCF-7 cells. Intracellular NADH concentrations (fmol/cell) in untreated (black) and U0126-treated (white) PC3 and MCF-7 cells. Data is shown as mean ± standard deviation.
Monocarboxylate transporter
MCT1 has been shown as the rate limiting step for hyperpolarized lactate production in T47D breast cancer cells (38). We therefore probed for MCT1 in control and treated PC3 and MCF-7 cells. Interestingly, while treatment with U0126 induced a significant decrease in the expression of MCT1 in MCF-7 cells (57 ± 8% of control, p=0.01, N=3), the transporter levels remained unchanged (94 ± 31%, p=0.77, N=3) in PC3 cells (Figure 4A).
Contribution of LDH and MCT to hyperpolarized pyruvate to lactate flux
To further confirm the role of MCT in modulating the pyruvate to lactate conversion in treated MCF-7 cells, we used a previously described approach (48) to discriminate the individual contribution of LDH and MCT to the apparent flux Vobs.. First we quantified VLDH, the flux in cell lysates (where VMCT =0). As previously reported VLDH did not show a clear dependence on pyruvate concentration in either PC3 or MCF-7 cells (48). The averages of VLDH for three pyruvate concentrations (2.5, 5 and 10 mM; N=1 for each concentration) were 53 ± 18 and 65 ± 24 fmol/cell/min in untreated and U0126-treated PC3 cells, and 65 ± 22 and 99 ± 33 fmol/cell/min in untreated and treated MCF-7 cells. Assuming that VLDH is the same in intact and lysed cells, and using Vobs−1=VLDH−1+VMCT−1, the values calculated for VMCT were then 42 ± 39 and 96 ± 125 fmol/cell/min in untreated and treated PC3 and 144 ± 241 and 45 ± 31 fmol/cell/min in untreated and treated MCF-7 cells. The drop in VMCT observed in treated MCF-7 cells, but not PC3 cells, was in line with the reduced expression of MCT1 observed by western blot analysis.
Discussion
As the key role of cell metabolism in oncogenesis and cancer progression is being established, several methods to detect changes in cell metabolism are being evaluated as approaches than can improve both diagnosis and evaluation of patient response to anticancer therapy. The latter is of key importance as standard tumor imaging methods are often unable to inform on response to novel targeted therapeutics due to their limited effect on tumor size. In some cases, FDG-PET, which can be used to measure the treatment-induced modulation of FDG uptake by the tumor, has provided an effective method for the detection of early response (5–8). Moreover, methods and technologies for the simultaneous acquisition of PET and MR images have been developed and the clinical value of PET/MRI as a new molecular imaging modality is being evaluated (50). In vivo metabolism has also been investigated using 13C MRS following the administration of 13C labeled metabolites (e.g. glucose; (51)). However, the limited sensitivity of thermal equilibrium 13C MRS has hampered its widespread application, particularly in the clinic. Recently, 13C MRS detection of hyperpolarized substrates has received increasing attention as a valuable radiation-free tool, which could provide an alternative method for the detection of metabolic modulation in the tumor environment during treatment. In particular, MRS of hyperpolarized pyruvate, which probes the conversion of pyruvate into lactate at the end of the glycolytic pathway, has been proposed as an alternative to FDG-PET, which probes the first step of that pathway (i.e. glucose uptake) (23, 52). Both these methods can be used to detect the modulation of glycolysis and can be valuable in clinical diagnosis and response assessment. Indeed, a recent study compared hyperpolarized 13C MRS of pyruvate with FDG-PET as methods to detect response to treatment in a murine lymphoma model (23). That study showed that, although the PET-detected modulation of radiolabeled FDG uptake preceded the decrease in conversion of hyperpolarized pyruvate to lactate, the magnitude of the changes detected using these two methods were comparable within 24 hours of treatment.
To date, previous studies investigating changes in hyperpolarized pyruvate to lactate conversion in response to traditional chemotherapy or targeted therapies have all observed a drop in the conversion of hyperpolarized pyruvate to lactate (15, 16, 21–23). In this study we investigated the effect of treatment with the MEK inhibitor U0126 on the conversion of hyperpolarized pyruvate to lactate in prostate and breast cancer cells. Our results indicate that, in response to treatment, the hyperpolarized lactate level and the pyruvate to lactate flux decrease in MCF-7 breast cancer cells. However, in contrast, the hyperpolarized lactate level and flux increase in PC3 prostate cancer cells following the same treatment.
In an effort to mechanistically explain our observations we investigated the effect of U0126 treatment on the different factors known to affect the pyruvate to lactate conversion, namely NADH concentration, LDH expression and activity, total intracellular lactate levels, and expression of the monocarboxylate transporter MCT1. The NADH concentration was found to be unchanged following treatment in both cell lines and thus could not explain any of our findings. In contrast, LDH expression, LDH activity and the total intracellular lactate pool were all significantly elevated in both cell lines. This was an unexpected finding, and might indicate that flux through the glycolytic pathway is increased by U0126 treatment, at least in our prostate (PC3) and breast (MCF-7) cancer cells. In this context, therapies targeting Raf have been shown to induce a drop in FDG-PET-detected glucose uptake (53, 54). Moreover, chemotherapy or radiation led to a drop in 1H-MRS detectable total lactate levels (55–57) associated with modulations in enzyme activities or in vivo vasculature. Further studies are thus needed to monitor the effect of U0126 on glycolysis in our cells as well as in vivo.
The elevation of LDH expression and activity as well as the elevation of total intracellular lactate could both contribute to formation of higher levels of hyperpolarized lactate, as indicated by previous studies (16, 22). In the case of PC3 cells, this is indeed what we observed. Treatment with U0126 led to an increase in the hyperpolarized pyruvate to lactate conversion. In contrast, in MCF-7 cells we observed a drop in the pyruvate to lactate conversion, in spite of an even greater elevation in both LDH activity and total intracellular lactate levels. We believe that this is due to the significant drop in cellular MCT1 levels observed in treated MCF-7 cells, an effect that was not observed in the PC3 cells. We also characterized the contributions of LDH and MCT to the observed hyperpolarized pyruvate to lactate conversion. Our findings based on the expression of MCT1 were paralleled by the MRS-based contribution of MCT to the observed hyperpolarized flux. Independent of the elevation in total intracellular lactate levels and LDH activity, our experiments indicate that the reduction in hyperpolarized pyruvate delivery into the cytosol is likely the explanation for the different results observed in PC3 and MCF-7 cells following U0126 treatment.
Our findings highlight the complexity of the interactions between signaling pathways and metabolism, and, in some cases, the dependence of these effects on the specific cell type. Although additional investigations, currently under way, are needed to fully understand the mechanistic links between signaling pathways and metabolism, our findings demonstrate the value of the hyperpolarized 13C approach to enhance our understanding of the metabolic sequelae of treatment. Furthermore, our work illustrates the need to understand the underlying factors affecting the pyruvate to lactate conversion before this new methodology can be used for monitoring response to MAPK inhibitors.
Acknowledgments
This work was supported by NIH grant RO1 CA130819, NIBIB grant P41EB013598 and UC Discovery grant in conjunction with GE Healthcare.
Abbreviations
- DMEM
Dulbecco’s Modified Eagle’s Medium
- DMSO
dimethylsulfoxide
- DNP
dynamic nuclear polarization
- FDG
[18F]-2-fluoro-2-deoxy-D-glucose
- LDH
lactate dehydrogenase
- MAPK
mitogen-activated protein kinase
- MCT
monocarboxylate transporter
- MEK
mitogen-activated protein kinase/extracellular signal-regulated kinase kinase
- MRS
magnetic resonance spectroscopy
- mTOR
mammalian target of rapamycin
- NTP
nucleoside triphosphate
- PET
positron emission tomography
- PI3K
phosphoinositide 3-kinase
- STR
short tandem repeat
- TMSP
sodium 3-trimethylsilylpropionate
References
- 1.Warburg O. On the origin of cancer cells. Science. 1956;123:309–314. doi: 10.1126/science.123.3191.309. [DOI] [PubMed] [Google Scholar]
- 2.Avril N, Sassen S, Schmalfeldt B, Naehrig J, Rutke S, Weber WA, Werner M, Graeff H, Schwaiger M, Kuhn W. Prediction of response to neoadjuvant chemotherapy by sequential F-18-fluorodeoxyglucose positron emission tomography in patients with advanced-stage ovarian cancer. J Clin Oncol. 2005;23:7445–7453. doi: 10.1200/JCO.2005.06.965. [DOI] [PubMed] [Google Scholar]
- 3.Schelling M, Avril N, Nährig J, Kuhn W, Römer W, Sattler D, Werner M, Dose J, Jänicke F, Graeff H, Schwaiger M. Positron emission tomography using [F-18]fluorodeoxyglucose for monitoring primary chemotherapy in breast cancer. J Clin Oncol. 2000;18:1689–1695. doi: 10.1200/JCO.2000.18.8.1689. [DOI] [PubMed] [Google Scholar]
- 4.Spaepen K, Stroobants S, Dupont P, Van Steenweghen S, Thomas J, Vandenberghe P, Vanuytsel L, Bormans G, Balzarini J, DeWolf-Peeters C, Mortelmans L, Verhoef G. Prognostic value of positron emission tomography (PET) with fluorine-18 fluorodeoxyglucose ([F-18]FDG) after first-line chemotherapy in non Hodgkin’s lymphoma: is [F-18] FDG-PET a valid alternative to conventional diagnostic methods? J Clin Oncol. 2001;19:414–419. doi: 10.1200/JCO.2001.19.2.414. [DOI] [PubMed] [Google Scholar]
- 5.Stroobants S, Goeminne J, Seegers M, Dimitrijevic S, Dupont P, Nuyts J, Martens M, van den Borne B, Cole P, Sciot R, Dumez H, Silberman S, Mortelmans L, van Oosterom A. 18FDG-Positron emission tomography for the early prediction of response in advanced soft tissue sarcoma treated with imatinib mesylate (Glivec) Eur J Cancer. 2003;39:2012–2020. doi: 10.1016/s0959-8049(03)00073-x. [DOI] [PubMed] [Google Scholar]
- 6.Van den Abbeele AD, Badawi RD. Use of positron emission tomography in oncology and its potential role to assess response to imatinib mesylate therapy in gastrointestinal stromal tumors (GISTs) Eur J Cancer. 2002;38:S60–S65. doi: 10.1016/s0959-8049(02)80604-9. [DOI] [PubMed] [Google Scholar]
- 7.Van den Abbeele AD, Ertuk M. FDG-PET to measure response to targeted therapy: The example of gastrointestinal stromal tumor and imatinib mesylate (Gleevec) PET Clinics. 2008;3:77–87. doi: 10.1016/j.cpet.2008.08.001. [DOI] [PubMed] [Google Scholar]
- 8.Weber WA, Petersen V, Schmidt B, Tyndale-Hines L, Link T, Peschel C, Schwaiger M. Positron emission tomography in non small-cell lung cancer: Prediction of response to chemotherapy by quantitative assessment of glucose use. J Clin Oncol. 2003;21:2651–2657. doi: 10.1200/JCO.2003.12.004. [DOI] [PubMed] [Google Scholar]
- 9.Diederichs CG, Staib L, Glatting G, Beger HG, Reske SN. FDG PET: Elevated plasma glucose reduces both uptake and detection rate of pancreatic malignancies. J Nucl Med. 1998;39:1030–1033. [PubMed] [Google Scholar]
- 10.Phelps ME, Mazziotta JC. Positron emission tomography: human brain function and biochemistry. Science. 1985;228:799–809. doi: 10.1126/science.2860723. [DOI] [PubMed] [Google Scholar]
- 11.Roy FN, Beaulieu S, Boucher L, Bourdeau I, Cohade C. Impact of intravenous insulin on 18F-FDG PET in diabetic cancer patients. J Nucl Med. 2009;50:178–183. doi: 10.2967/jnumed.108.056283. [DOI] [PubMed] [Google Scholar]
- 12.Zhuang H, Pourdehnad M, Lambright ES, Yamamoto AJ, Lanuti M, Li P, Mozley PD, Rossman MD, Albelda SM, Alavi A. Dual time point 18F-FDG PET imaging for differentiating malignant from inflammatory processes. J Nucl Med. 2001;42:1412–1417. [PubMed] [Google Scholar]
- 13.Mellon EA, Lee SC, Pickup S, Kim S, Goldstein SC, Floyd TF, Poptani H, Delikatny EJ, Reddy R, Glickson JD. Detection of lactate with a hadamard slice selected, selective multiple quantum coherence, chemical shift imaging sequence (HDMD-SelMQC-CSI) on a clinical MRI scanner: Application to tumors and muscle ischemia. Magn Reson Med. 2009;62:1404–1413. doi: 10.1002/mrm.22141. [DOI] [PMC free article] [PubMed] [Google Scholar]
- 14.Albers MJ, Bok R, Chen AP, Cunningham CH, Zierhut ML, Zhang VY, Kohler SJ, Tropp J, Hurd RE, Yen Y-F, Nelson SJ, Vigneron DB, Kurhanewicz J. Hyperpolarized 13C lactate, pyruvate, and alanine: Noninvasive biomarkers for prostate cancer detection and grading. Cancer Res. 2008;68:8607–8615. doi: 10.1158/0008-5472.CAN-08-0749. [DOI] [PMC free article] [PubMed] [Google Scholar]
- 15.Dafni H, Larson PEZ, Hu S, Yoshihara HAI, Ward CS, Venkatesh HS, Wang C, Zhang X, Vigneron DB, Ronen SM. Hyperpolarized 13C spectroscopic imaging informs on hypoxia-inducible factor-1 and Myc activity downstream of platelet-derived growth factor receptor. Cancer Res. 2010;70:7400–7410. doi: 10.1158/0008-5472.CAN-10-0883. [DOI] [PMC free article] [PubMed] [Google Scholar]
- 16.Day SE, Kettunen MI, Gallagher FA, Hu D-E, Lerche M, Wolber J, Golman K, Ardenkjaer-Larsen JH, Brindle KM. Detecting tumor response to treatment using hyperpolarized 13C magnetic resonance imaging and spectroscopy. Nat Med. 2007;13:1382–1387. doi: 10.1038/nm1650. [DOI] [PubMed] [Google Scholar]
- 17.Kohler SJ, Yen Y, Wolber J, Chen AP, Albers MJ, Bok R, Zhang V, Tropp J, Nelson S, Vigneron DB, Kurhanewicz J, Hurd RE. In vivo 13 carbon metabolic imaging at 3T with hyperpolarized 13C-1-pyruvate. Magn Reson Med. 2007;58:65–69. doi: 10.1002/mrm.21253. [DOI] [PubMed] [Google Scholar]
- 18.Merritt ME, Harrison C, Storey C, Jeffrey FM, Sherry AD, Malloy CR. Hyperpolarized 13C allows a direct measure of flux through a single enzyme-catalyzed step by NMR. Proc Natl Acad Sci USA. 2007;104:19773–19777. doi: 10.1073/pnas.0706235104. [DOI] [PMC free article] [PubMed] [Google Scholar]
- 19.Schroeder MA, Atherton HJ, Ball DR, Cole MA, Heather LC, Griffin JL, Clarke K, Radda GK, Tyler DJ. Real-time assessment of Krebs cycle metabolism using hyperpolarized 13C magnetic resonance spectroscopy. FASEB J. 2009;23:2529–2538. doi: 10.1096/fj.09-129171. [DOI] [PMC free article] [PubMed] [Google Scholar]
- 20.Schroeder MA, Cochlin LE, Heather LC, Clarke K, Radda GK, Tyler DJ. In vivo assessment of pyruvate dehydrogenase flux in the heart using hyperpolarized carbon-13 magnetic resonance. Proc Natl Acad Sci USA. 2008;105:12051–12056. doi: 10.1073/pnas.0805953105. [DOI] [PMC free article] [PubMed] [Google Scholar]
- 21.Seth P, Grant A, Tang J, Vinogradov E, Wang X, Lenkinski R, Sukhatme VP. On-target inhibition of tumor fermentative glycolysis as visualized by hyperpolarized pyruvate. Neoplasia. 2011;13:60–71. doi: 10.1593/neo.101020. [DOI] [PMC free article] [PubMed] [Google Scholar]
- 22.Ward CS, Venkatesh HS, Chaumeil MM, Brandes AH, VanCriekinge M, Dafni H, Sukumar S, Nelson SJ, Vigneron DB, Kurhanewicz J, James CD, Haas-Kogan DA, Ronen SM. Noninvasive detection of target modulation following phosphatidylinositol 3-kinase inhibition using hyperpolarized 13C magnetic resonance spectroscopy. Cancer Res. 2010;70:1296–1305. doi: 10.1158/0008-5472.CAN-09-2251. [DOI] [PMC free article] [PubMed] [Google Scholar]
- 23.Witney TH, Kettunen MI, Day SE, Hu DE, Neves AA, Gallagher FA, Fulton SM, Brindle KM. A comparison between radiolabeled fluorodeoxyglucose uptake and hyperpolarized 13C-labeled pyruvate utilization as methods for detecting tumor response to treatment. Neoplasia. 2009;11:574–582. doi: 10.1593/neo.09254. [DOI] [PMC free article] [PubMed] [Google Scholar]
- 24.Gallagher FA, Kettunen MI, Day SE, Hu D-E, Ardenkjær-Larsen JH, In ‘t Zandt R, Jensen PR, Karlsson M, Golman K, Lerche MH, Brindle KM. Magnetic resonance imaging of pH in vivo using hyperpolarized 13C-labelled bicarbonate. Nature. 2008;453:940–943. doi: 10.1038/nature07017. [DOI] [PubMed] [Google Scholar]
- 25.Gallagher FA, Kettunen MI, Day SE, Lerche M, Brindle KM. 13C MR spectroscopy measurements of glutaminase activity in human hepatocellular carcinoma cells using hyperpolarized 13C-labeled glutamine. Magn Reson Med. 2008;60:253–257. doi: 10.1002/mrm.21650. [DOI] [PubMed] [Google Scholar]
- 26.Gallagher FA, Kettunen MI, Day SE, Hu D-E, Karlsson M, Gisselsson A, Lerche MH, Brindle KM. Detection of tumor glutamate metabolism in vivo using 13C magnetic resonance spectroscopy and hyperpolarized [1–13C]glutamate. Magn Reson Med. 2011;66:18–23. doi: 10.1002/mrm.22851. [DOI] [PubMed] [Google Scholar]
- 27.Gallagher FA, Kettunen MI, Hu D-E, Jensen PR, In ‘t Zandt R, Karlsson M, Gisselsson A, Nelson SK, Witney TH, Bohndiek SE, Hansson G, Peitersen T, Lerche MH, Brindle KM. Production of hyperpolarized [1,4–13C2]malate from [1,4–13C2]fumarate is a marker of cell necrosis and treatment response in tumors. Proc Natl Acad Sci USA. 2009;106:19801–19806. doi: 10.1073/pnas.0911447106. [DOI] [PMC free article] [PubMed] [Google Scholar]
- 28.Bhattacharya P, Chekmenev EY, Perman WH, Harris KC, Lin AP, Norton VA, Tan CT, Ross BD, Weitekamp DP. Towards hyperpolarized 13C-succinate imaging of brain cancer. J Magn Reson. 2007;186:150–155. doi: 10.1016/j.jmr.2007.01.017. [DOI] [PMC free article] [PubMed] [Google Scholar]
- 29.Chekmenev EY, Hövener J, Norton VA, Harris K, Batchelder LS, Bhattacharya P, Ross BD, Weitekamp DP. PASADENA hyperpolarization of succinic acid for MRI and NMR spectroscopy. J Am Chem Soc. 2008;130:4212–4213. doi: 10.1021/ja7101218. [DOI] [PMC free article] [PubMed] [Google Scholar]
- 30.Karlsson M, Jensen PR, In ‘t Zandt R, Gisselsson A, Hansson G, Duus JØ, Meier S, Lerche MH. Imaging of branched chain amino acid metabolism in tumors with hyperpolarized 13C ketoisocaproate. Int J Cancer. 2010;127:729–736. doi: 10.1002/ijc.25072. [DOI] [PubMed] [Google Scholar]
- 31.Jensen PR, Peitersen T, Karlsson M, In ‘t Zandt R, Gisselsson A, Hansson G, Meier S, Lerche MH. Tissue-specific short chain fatty acid metabolism and slow metabolic recovery after ischemia from hyperpolarized NMR in vivo. J Biol Chem. 2009;284:36077–36082. doi: 10.1074/jbc.M109.066407. [DOI] [PMC free article] [PubMed] [Google Scholar]
- 32.Keshari KR, Wilson DM, Chen AP, Bok R, Larson PEZ, Hu S, Criekinge MV, Macdonald JM, Vigneron DB, Kurhanewicz J. Hyperpolarized [2–13C]-fructose: A hemiketal DNP substrate for in vivo metabolic imaging. J Am Chem Soc. 2009;131:17591–17596. doi: 10.1021/ja9049355. [DOI] [PMC free article] [PubMed] [Google Scholar]
- 33.Vigneron DB, Nelson S, Harzstark A, Bok R, Kurhanewicz J. Preclinical and Phase I Human Studies of Hyperpolarized Carbon-13 Metabolic MRI. Third International Symposium on Dynamic Nuclear Polarization; Lausanne, Switzerland. 2011. [Google Scholar]
- 34.Day SE, Kettunen MI, Krishna MC, Mitchell JB, Lizak MJ, Morris HD, Matsumoto S, Koretsky AP, Brindle KM. Detecting response of rat C6 glioma tumors to radiotherapy using hyperpolarized [1–13C] pyruvate and 13C magnetic resonance spectroscopic imaging. Magn Reson Med. 2011;65:557–563. doi: 10.1002/mrm.22698. [DOI] [PMC free article] [PubMed] [Google Scholar]
- 35.Park I, Bok R, Ozawa T, Phillips JJ, James CD, Vigneron DB, Ronen SM, Nelson SJ. Detection of early response to temozolomide treatment in brain tumors using hyperpolarized 13C MR metabolic imaging. J Magn Reson Imaging. 2011;33:1284–1290. doi: 10.1002/jmri.22563. [DOI] [PMC free article] [PubMed] [Google Scholar]
- 36.Chaumeil MM, Ozawa T, Park I, Scott K, James CD, Nelson SJ, Ronen SM. Hyperpolarized 13C MR spectroscopic imaging can be used to monitor Everolimus treatment in vivo in an orthotopic rodent model of glioblastoma. Neuroimage. 2012;59:193–201. doi: 10.1016/j.neuroimage.2011.07.034. [DOI] [PMC free article] [PubMed] [Google Scholar]
- 37.Halestrap AP, Price NT. The proton-linked monocarboxylate transporter (MCT) family: structure, function and regulation. Biochem J. 1999;343:281–299. [PMC free article] [PubMed] [Google Scholar]
- 38.Harris T, Eliyahu G, Frydman L, Degani H. Kinetics of hyperpolarized 13C1-pyruvate transport and metabolism in living human breast cancer cells. Proc Natl Acad Sci USA. 2009;106:18131–18136. doi: 10.1073/pnas.0909049106. [DOI] [PMC free article] [PubMed] [Google Scholar]
- 39.Morris ME, Felmlee MA. Overview of the proton-coupled MCT (SLC16A) family of transporters: characterization, function and role in the transport of the drug of abuse gamma-hydroxybutyric acid. AAPS J. 2008;10:311–321. doi: 10.1208/s12248-008-9035-6. [DOI] [PMC free article] [PubMed] [Google Scholar]
- 40.Kurhanewicz J, Vigneron DB, Brindle K, Chekmenev EY, Comment A, Cunningham CH, DeBerardinis RJ, Green GG, Leach MO, Rajan SS, Rizi RR, Ross BD, Warren WS, Malloy CR. Analysis of cancer metabolism by imaging hyperpolarized nuclei: Prospects for translation to clinical research. Neoplasia. 2011;13:81–97. doi: 10.1593/neo.101102. [DOI] [PMC free article] [PubMed] [Google Scholar]
- 41.Gehart H, Kumpf S, Ittner A, Ricci R. MAPK signalling in cellular metabolism: stress or wellness? EMBO Rep. 2010;11:834–840. doi: 10.1038/embor.2010.160. [DOI] [PMC free article] [PubMed] [Google Scholar]
- 42.Brandes A, Ward C, Ronen SM. 17-allyamino-17-demethoxygeldanamycin treatment results in a magnetic resonance spectroscopy-detectable elevation in choline-containing metabolites associated with increased expression of choline transporter SLC44A1 and phospholipase A2. Breast Cancer Res. 2010;12:R84. doi: 10.1186/bcr2729. [DOI] [PMC free article] [PubMed] [Google Scholar]
- 43.Lodi A, Ronen SM. Magnetic resonance spectroscopy detectable metabolomic fingerprint of response to antineoplastic treatment. PLoS ONE. 2011;6:e26155. doi: 10.1371/journal.pone.0026155. [DOI] [PMC free article] [PubMed] [Google Scholar]
- 44.Su JS, Woods SM, Ronen SM. Metabolic Consequences of Treatment with AKT Inhibitor Perifosine in Breast Cancer Cells. NMR Biomed. 2012;25:379–388. doi: 10.1002/nbm.1764. [DOI] [PMC free article] [PubMed] [Google Scholar]
- 45.Ronen SM, Jackson LE, Beloueche M, Leach MO. Magnetic resonance detects changes in phosphocholine associated with Ras activation and inhibition in NIH 3T3 cells. Br J Cancer. 2001;84:691–696. doi: 10.1054/bjoc.2000.1663. [DOI] [PMC free article] [PubMed] [Google Scholar]
- 46.Hwang TL, Shaka AJ. Water suppression that works - Excitation sculpting using arbitrary wave-forms and pulsed-field gradients. J Magn Reson. 1995;112:275–279. [Google Scholar]
- 47.Ronen SM, Rushkin E, Degani H. Lipid metabolism in T47D human breast cancer cells: 31P and 13C-NMR studies of choline and ethanolamine uptake. Biochim Biophys Acta. 1991;1095:5–16. doi: 10.1016/0167-4889(91)90038-y. [DOI] [PubMed] [Google Scholar]
- 48.Witney TH, Kettunen MI, Brindle KM. Kinetic modeling of hyperpolarized 13C label exchange between pyruvate and lactate in tumor cells. J Biol Chem. 2011;286:24572–24580. doi: 10.1074/jbc.M111.237727. [DOI] [PMC free article] [PubMed] [Google Scholar]
- 49.Beloueche-Babari M, Jackson LE, Al-Saffar NM, Workman P, Leach MO, Ronen SM. Magnetic resonance spectroscopy monitoring of mitogen-activated protein kinase signaling inhibition. Cancer Res. 2005;65:3356–3363. doi: 10.1158/10.1158/0008-5472.CAN-03-2981. [DOI] [PubMed] [Google Scholar]
- 50.Schlemmer H-PW, Pichler BJ, Schmand M, Burbar Z, Michel C, Ladebeck R, Jattke K, Townsend D, Nahmias C, Jacob PK, Heiss W-D, Claussen CD. Simultaneous MR/PET Imaging of the Human Brain: Feasibility Study. Radiology. 2008;248:1028–1035. doi: 10.1148/radiol.2483071927. [DOI] [PubMed] [Google Scholar]
- 51.de Graaf RA, Mason GF, Patel AB, Behar KL, Rothman DL. In vivo 1H-[13C]-NMR spectroscopy of cerebral metabolism. NMR Biomed. 2003;16:339–357. doi: 10.1002/nbm.847. [DOI] [PubMed] [Google Scholar]
- 52.Golman K, in’t Zandt R, Lerche M, Pehrson R, Ardenkjaer-Larsen JH. Metabolic imaging by hyperpolarized 13C magnetic resonance imaging for in vivo tumor diagnosis. Cancer Res. 2006;66:10855–10860. doi: 10.1158/0008-5472.CAN-06-2564. [DOI] [PubMed] [Google Scholar]
- 53.Søndergaard JN, Nazarian R, Wang Q, Guo D, Hsueh T, Mok S, Sazegar H, MacConaill LE, Barretina JG, Kehoe SM, Attar N, von Euw E, Zuckerman JE, Chmielowski B, Comin-Anduix B, Koya RC, Mischel PS, Lo RS, Ribas A. Differential sensitivity of melanoma cell lines with BRAF V600E mutation to the specific Raf inhibitor PLX4032. J Transl Med. 2010;8:39. doi: 10.1186/1479-5876-8-39. [DOI] [PMC free article] [PubMed] [Google Scholar]
- 54.Tseng JR, Stuart D, Aardalen K, Kaplan A, Aziz N, Hughes NP, Gambhir SS. Use of DNA Microarray and Small Animal Positron Emission Tomography in Preclinical Drug Evaluation of RAF265, a Novel B-Raf/VEGFR-2 Inhibitor. Neoplasia. 2011;13:266–275. doi: 10.1593/neo.101466. [DOI] [PMC free article] [PubMed] [Google Scholar]
- 55.Lee SC, Delikatny EJ, Poptani H, Pickup S, Glickson JD. In vivo 1H MRS of WSU-DLCL2 human non-Hodgkin’s lymphoma xenografts: response to rituximab and rituximab plus CHOP. NMR Biomed. 2009;22:259–265. doi: 10.1002/nbm.1316. [DOI] [PubMed] [Google Scholar]
- 56.Lee SC, Huang MQ, Nelson DS, Pickup S, Wehrli S, Adegbola O, Poptani H, Delikatny EJ, Glickson JD. In vivo MRS markers of response to CHOP chemotherapy in the WSU-DLCL2 human diffuse large B-cell lymphoma xenograft. NMR Biomed. 2008;21:723–733. doi: 10.1002/nbm.1250. [DOI] [PubMed] [Google Scholar]
- 57.Lee SC, Poptani H, Pickup S, Jenkins WT, Kim S, Koch CJ, Delikatny EJ, Glickson JD. Early detection of radiation therapy response in non-Hodgkin’s lymphoma xenografts by in vivo 1H magnetic resonance spectroscopy and imaging. NMR Biomed. 2010;23:624–632. doi: 10.1002/nbm.1505. [DOI] [PubMed] [Google Scholar]