Abstract
Photosynthetic reaction centers (PRCs) employ multiple-step tunneling (hopping) to separate electrons and holes that ultimately drive the chemistry required for metabolism. We recently developed hopping maps that can be used to interpret the rates and energetics of electron/hole hopping in three-site (donor-intermediate-acceptor) tunneling reactions, including those in PRCs. Here we analyze several key ET reactions in PRCs, including forward ET in the L-branch, and hopping that could involve thermodynamically uphill intermediates in the M-branch, which is ET-inactive in vivo. We also explore charge recombination reactions, which could involve hopping. Our hopping maps support the view that electron flow in PRCs involves strong electronic coupling between cofactors and reorganization energies that are among the lowest in biology (≤ 0.4 eV).
Keywords: Electron transfer, multistep tunneling, hopping maps, photosynthesis, bacterial photosynthetic reaction centers
1. Introduction
Electron transfer (ET) reactions are essential for energy transduction in living cells. The respiratory ET cascade in eukaryotic cells produces the proton gradient that drives ATP synthesis, in part through the reduction of dioxygen to water [1]. Conversely, the protons and electrons released when two water molecules are photochemically oxidized to dioxygen are responsible for ATP synthesis and NAD reduction in plants [2,3]. Purple sulfur bacteria also convert light into chemical potential, producing proton gradients, but they use sulfur-containing compounds as electron donors [3,4]. The viability of each phototrophic organism depends on effective capture of a photon and generation of a relatively long-lived electron-hole pair. The lessons learned from such organisms could facilitate the design of photosynthetic molecular machines for the production of solar fuels [5].
We have shown that hopping maps can be used to predict the rates of two-step electron tunneling (hopping) reactions [6]. In these maps, semiclassical ET theory (Eqns. 1 and 2) [7] is extended to calculate reaction times (τhopping) for generation of the product state (Z in Eqns. 3–4). Hopping requires at least three sites: the electron/hole donor (D); an intermediate (I) that can transiently accommodate the electron/hole; and an electron/hole acceptor (A) (Eqns. 3–4). The expression for τhopping is shown in Eqn. 5; and a complete derivation is given in Ref. [6]. Our treatment is derived specifically for a three-site system [6] but could be adapted for hopping that includes additional steps.
The dependences of τhopping on the driving force for the first step, −ΔG°XY (Eqn. 4a), and the overall driving force −ΔG°XZ (Eqn 4c) are displayed in a hopping map. We show these dependences as contour maps where −log10(τhopping) is plotted with −ΔG°XY as the x-axis and −ΔG°XZ as the y-axis. The white area at the upper right part of a map is the region in which single-step ET is faster than hopping; the white area at the lower left is where the electron/hole remains bound in the intermediate (Eqn. 4b). Construction of a hopping map requires the usual parameter inputs (Eqn. 1) as well as three distances [D→I (r1), I→A (r2) and D→A (rT)]. In the following analysis we assume the same reorganization energy (λ) and electronic coupling at van der Waals contact (HAB(r0)) for both tunneling steps. A computer program for construction of hopping maps is available for download [8].
| (1) |
| (2) |
| (3) |
| (4a) |
| (4b) |
| (4c) |
| (5) |
We can conclude from examination of natural [6] and engineered [9] hopping systems that hopping is most favorable when intervening steps are less than ~200 meV uphill; and that ionizable protons in transiently oxidized residues must be tightly controlled. When Tyr is involved, for example, proton content is usually managed using a Brønsted base, such as histidine, aspartate or glutamate [10]. Herein we use hopping maps to evaluate the steps involved in charge separation in bacterial photosynthetic reaction centers, and highlight some recent advances in understanding the mechanism of PRC ET.
2. Photosynthetic reaction centers (PRCs)
Bacterial PRCs, which were the first membrane proteins to be characterized by x-ray diffraction [11], share structural and kinetic similarities with analogous redox machines in PS I and PS II [12–14]. The 6 light-absorbing cofactors comprising the reaction centers are arranged with pseudo-C2 symmetry. The symmetry-related branches or PRCs are referred to as L (or A) and M (or B). Only the L-branch is involved in charge-separation reactions [15], which occur with a quantum yield near unity [16]. The striking difference in ET reactivity in the L- and M-branches is thought to arise from asymmetry in the amino acids surrounding the pigments that modulate reduction potentials, as well as a slightly more favorable arrangement of cofactors in the L-branch [17]. Indeed, mutating the residues in the M-branch to mimic those in the L-branch [18], or combining mutations and addition of non-native cofactors [19], yields PRCs where M-branch ET occurs.
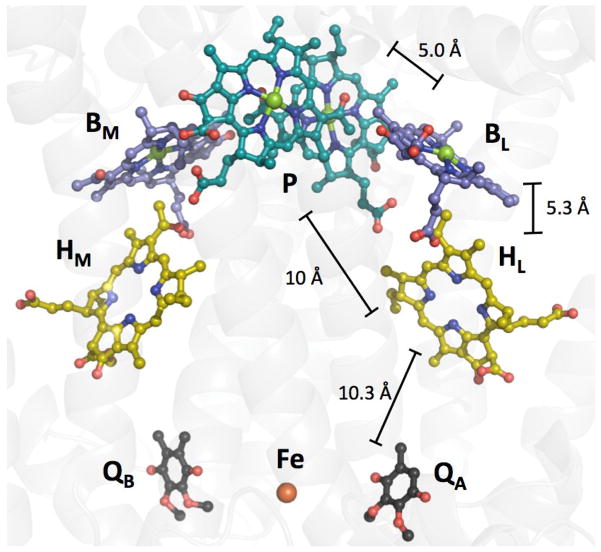
PRCs are involved in producing proton gradients that drive ATP synthesis. Absorption of a photon by the special pair of chlorophylls (P, Figure 1) initiates an ET cascade that eventually reaches a bound quinone (QA), producing a charge-separated state (P+QA−) [20]. It is well established that forward ET in PRCs is facilitated by hopping through bacteriochlorophyll (BL) and bacteriopheophytin (HL). The oxidized special pair (P+) is reduced by internal or external cytochromes (depending upon the system); and absorption of a second photon ultimately produces a fully reduced product (quinone + 2H+ + 2e− → hydroquinone), which is in turn is released and reoxidized by the cytochrome bc1 complex that pumps 2H+ across the bacterial membrane. In PRCs, as well as PS I and PS II, the cost of charge-separated states (P+/QA−) with millisecond to second lifetimes is the loss of close to 50% of the photon energy.
Figure 1.
PRC from Rhodobacter sphaeroides 2.4.1 (PDB ID 3ID4). Alkyl tails in all cofactors are omitted for clarity. The special pair (P) is teal, bacteriochlorphylls (BL and BM) are purple, bacteriophenphytins (HL and HM) are yellow and quinones (QA and QB) are black. Nitrogen atoms are shown in blue, oxygen in red and magnesium in green. Edge-to-edge distances between cofactors are shown (see text).
2.1 Cofactor arrangement and ET energetics
The two most extensively studied PRCs are from Blastochloris viridis (formerly Rhodopseudomonas viridis) and Rhodobacter sphaeroides (Figure 1). In our analysis we will largely ignore subtle differences in the kinetics and energetics of these reaction centers, as our aim here is to shed light on principal features that underlie PRC hopping function. Our model is admittedly simplified, as it does not include protein dynamics, which likely plays a role in modulating ET in PRCs [21].
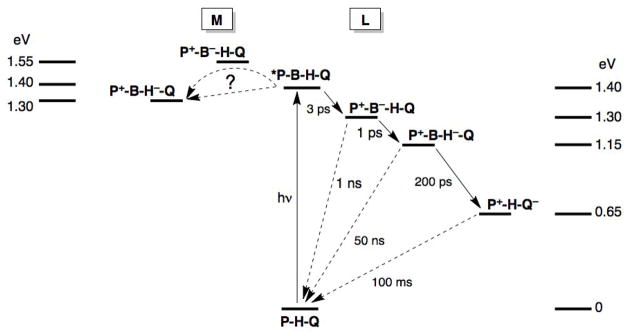
A great deal of effort has gone into determining PRC reduction potentials, but the results are not definitive, because many of the cofactors are membrane bound. The good news is that relative reduction potentials (and thus driving forces, −ΔG°) have been extracted from theory and kinetics studies; and PRCs in different organisms have similar ET energetics (± 50 meV) and reaction times (Figure 2) that include data obtained at different temperatures [20,22]. It is noteworthy that the reaction times increase by a factor of 2–3 from 295 to 10 K [23], demonstrating that they are effectively driving-force-optimized [24a]. Some of the charge recombination steps also are temperature independent, as described below.
Figure 2.
Energetics of charge separation and recombination in bacterial PRCs. References for the energy levels are given in the text. P, B, H, and Q are shown in Figure 2.
Evaluation of the distances between cofactors in PRCs is problematic because the transferring electron is delocalized over large molecules. One approach is to take average distances between cofactors obtained from the coordinates of the R. sphaeroides protein (Figure 1). While average distances could be a better approximation for electron/hole transfer calculations, such distances are not in accord with the close-contact value (r0) of 3 Å [6,24]. The alternative is edge-to-edge distances. For large donors/acceptors, these two limiting cases correspond to very different distances between PRC cofactors, as Boxer pointed out [20a].
We will use the ET step from HL− to QA to show the different predictions of average versus edge-to-edge distances. Since HL is reduced with a time constant of 3 ps, while the subsequent reduction of QA is much slower (200 ps) (Figure 2), we assume that ET from HL− to QA is a single-step reaction. We take the average distance between HL and QA (14.5 Å, Figure 1) as the distance between the 4 pyrrole nitrogens (HL) to the C6O2 quinone core (QA). The distance from the nearest aromatic carbon in HL to the nearest aromatic carbon in QA is 10.3 Å. As noted above, the reorganization energy is probably close to −ΔG° (0.5 eV); this is reasonable because aromatic organic cofactors typically have lower reorganization energies than inorganic complexes [25,26]. We take 1.1 Å−1 for the distance decay constant, an experimentally validated parameter for protein ET reactions [24]. Employing average distances, the predicted time constant (Eqn. 1) for reduction of QA by HL− is 25 ns, which is not in accord with experiment. Since much better agreement with experiment is obtained using edge-to-edge distances (250 ps calculated tunneling time), we will employ those distances in our PRC analyses.
It is of interest that the best agreement with experiment comes from a map constructed with β = 1.1 Å−1. We also could obtain good agreement employing average distances with lower β, as has been shown to be the case in ET systems where the donor and acceptor interact through aromatic bridges [27]. Whichever the case, it is clear that delocalized cofactor electronic wave functions can enhance donor-acceptor coupling relative to those established for Ru-modified metalloproteins [24], as has been suggested for the initial ET reaction between *P and BL [28]. We thus conclude that driving-force-optimized ET and enhanced donor-acceptor coupling facilitate light-induced charge separation in PRCs, and likely also in PS I and II.
3. Hopping in the first charge-separation step
The involvement of BL in PRC ET reaction was unclear when experiments first showed *P → HL ET occurs with a time constant of about 3 ps [29], and theoretical work favored a superexchange mechanism without direct involvement of BL. In the late 1980s and early 1990s, data collected with better sensitivity and temporal resolution showed that there was an intermediate in the net *P → HL ET reaction [30,31]. These studies confirmed that BL is reduced by *P with a time constant of 3 ps and BL then reduces HL with a time constant of 0.9 ps. Recent work using single-crystal polarized spectroscopy at 100 K suggests that BL reduction is the faster of the two steps (the relative rate constants stay the same) [32].
The energy gaps between *P, BL and HL are reasonably well known (Figure 2). BL−/0 [33] and HL−/0 [34] are about 0.05 to 0.1 and 0.2 to 0.3 eV, respectively, below *P. Most workers agree on these relative energy gaps, having approached this problem from several different directions [20,33,34]. As above, we take each distance between cofactors to be that between the two nearest aromatic carbons: P → BL (5.0); BL → HL (5.3) and P → HL (10 Å), with a distance decay constant of 1.1 Å−1 [24]. Thermal protein motions do not appear to influence the very fast initial charge separation steps [21a], but such dynamics could be important for subsequent, slower steps (see below).
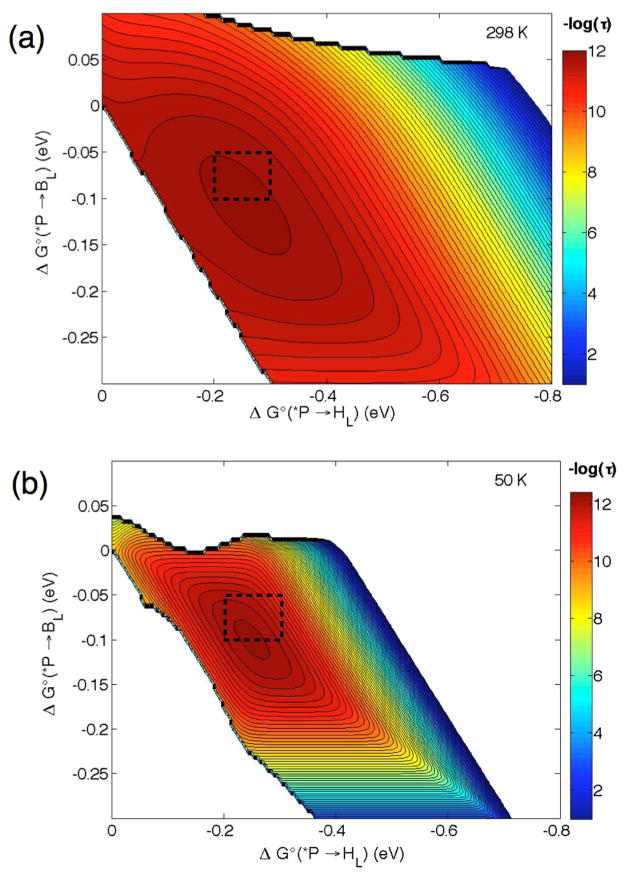
The initial *P → HL charge-separation event is almost insensitive to temperature [23], indicating that each ET step is nearly driving-force-optimized. Thus, we take the reorganization energy for the first step as 0.1 eV and that of the second step and single-step ET as 0.15 eV. Our hopping maps (Figure 3) compare the hopping advantages for *P → BL → HL ET at 298 and 50 K. As expected, the range of driving forces where hopping is predicted to occur is drastically narrowed at low temperature (note that the axes have the same range in Figure 3a and 3b). However, hopping is still expected to occur in the driving-force-optimized region with a time constant between 1 and 25 ps, in good agreement with experiment. The larger range of hopping time constants is a result of the points in the hopping map where the driving forces differ substantially from the reorganization energies. In sum, our model derived from semiclassical ET theory, with no additional parameters, reproduces reaction times for forward ET in the initial charge-separation events in PRCs. Our results also are in good agreement with predictions from tunneling pathway analyses [35]. Both models underscore the importance of cofactor arrangement in optimizing electronic coupling.
Figure 3.
Hopping maps for *P → BL → HL PRCs at 298 (a) and 50 K (b) with λ*P/BL = 0.1, λBL/HL = λ*P/HL = 0.15 eV and β = 1.1 Å−1. Distances (Å) are r1 = 5.0, r2 = 5.3, rT = 10. The black box in each map represents the range of predicted time constant based on driving forces from Figure 2. The contour lines are plotted at 0.2 log unit intervals.
The hopping maps shown in Figure 3 are very sensitive to the choice of reorganization energy, in particular the map at 50 K. Increasing λ to 0.3 eV (for all steps) produces a map where hopping is not predicted at low temperatures. We suggest that functional ET in PRCs requires driving-force-optimized ET, but not necessarily low nuclear reorganization. Instead, the reorganization energy could be optimized for low-driving-force ET reactions that minimize loss of energy gained from light absorption.
4. Hopping in the M-branch
The cofactors that comprise PRCS are arranged in a pseudo-C2 fashion, but ET only occurs through the L-branch because of asymmetry in the amino acids surrounding the pigments in each branch that modulates their energies with respect to P*. Investigators have produced a variety of mutant PRCs that modify reduction potentials of the pigments and their observed ET reactivities. Noteworthy examples are those variants where some amino acids associated with the M-branch are replaced with those from the L-branch, resulting in “symmetric” PRCs [36]. One such scaffold is the DLL PRC, which actually lacks HL, facilitating work on M-branch ET reactivity. In this section we use hopping maps to analyze M-branch electron flow in WT PRCs as well as mutants that are especially well characterized.
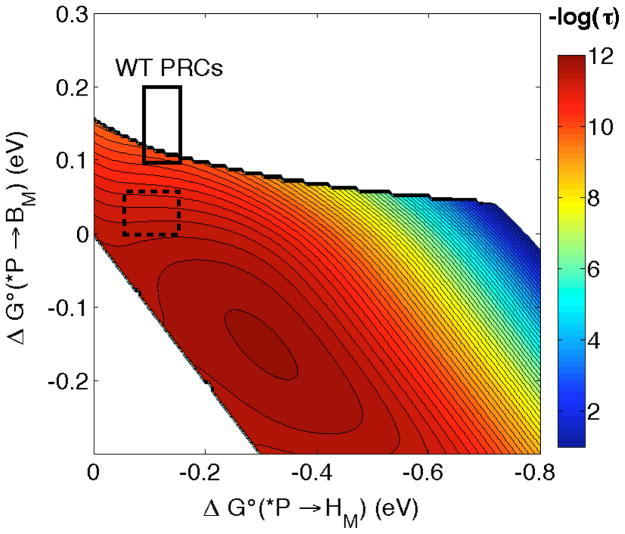
The hopping map for M-branch ET is shown in Figure 4. BM lies 0.1 to 0.2 eV above *P and HM is 0.1 to 0.15 eV below *P in WT PRCs [37]. The map is constructed with a λ of 0.15 eV (for all steps), β = 1.1 Å−1 and T = 298 K. Hopping is not expected to occur over most of the estimated driving force range. The time constant for the instances where hopping is predicted to occur is ~100 ps, 100 times slower than ET in the L-branch. Likewise, no ET is observed in the symmetrical DLL PRC variant lacking HL, consistent with the first step being >200 meV uphill and overall ET being roughly isoergic with *P [18].
Figure 4.
Hopping map for *P → BM → HM in PRCs at 298 K with λ*P/BM = λBM/HM = λ*P/HM = 0.15 eV and β = 1.1 Å−1. Distances (Å) are r1 = 5.0, r2 = 5.3, rT = 10 Å. The solid black box is the estimated range of driving forces in WT PRCs and the dotted box is the estimated driving force range in modified DLL PRCs [18]. The contour lines are plotted at 0.2 log unit intervals.
Boxer and coworkers further modified the DLL scaffold to allow for observation of M-branch ET [18a]. Substitution of the Phe near P, BM and HM with Tyr lowers the relative energies of BM− and HM−, while the opposite mutation raises the corresponding energies in the L-branch, thereby enabling M-branch ET. The observed changes in energy levels are in accord with calculations [38]. The dashed box in Figure 4 shows predicted time constants (~10 ps) for hopping in these modified DLL PRCs. The calculated values are in good agreement with experiment (40–70 ps), which reinforces our conclusion that hopping via thermodynamically uphill intermediates is disfavored under most biologically relevant circumstances.
5. Hopping versus single-step ET in charge recombination reactions
Charge recombination reactions along the PRC ET chain have been investigated: the kinetics of recombination are well established, but the mechanism is not. The best studied reactions are recombination from the P+QA− and P+HL− states, where the observed rate constants are roughly independent of temperature [20a,39]. Recombination from the P+QA− state occurs with a time constant near 100 ms [39] at a driving force near 0.6 eV. It is possible that recombination from P+QA− involves transient reduction of HL (or BL). In this case the first step would require uphill ET (−ΔG° = −0.5 eV) followed by highly downhill recombination (−ΔG° = 1.1 eV) to the relaxed, neutral state. A hopping map for this charge recombination reaction (not shown) shows that such a thermodynamically uphill intermediate step will not promote hopping. We emphasize that our model does not consider nuclear tunneling, which could be operative in the highly exergonic step [40].
Recombination from the P+HL− state occurs over about 10 Å with a time constant near 12–25 ns [39c,41]: Eqns. 1 and 2 predict a 300 ps time constant for driving-force-optimized ET, which requires a reorganization energy of 1.1 eV, far greater than for forward ET (≤ 0.2 eV). Several studies suggest that charge recombination does not occur by a simple single-step mechanism [42], and protein conformation could modify the relative energy levels of P, BL and HL [43]. In WT PRCs charge recombination from the P+HL is suggested to at least partially proceed through an activated state resembling P+BL−. Substituting amino acids near the pigments in the L-branch modulates the relative reduction potentials of HL and BL and thus affects the kinetics of charge recombination [42]. When HL and BL are energetically close (ΔG° ~ 0), charge recombination is about 10 times more rapid.
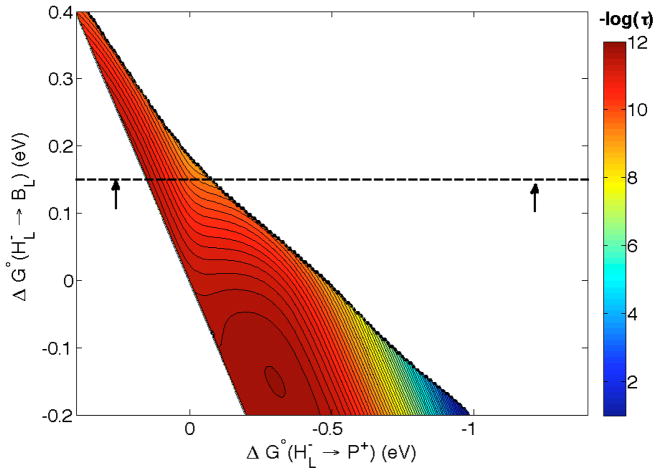
We have constructed a hopping map for the charge recombination reaction starting from the P+HL state (Figure 5). We estimate the reorganization energy for HL− → BL and for BL− → P+ as 0.15 eV. The overall λ for ET from HL → P+ single-step ET is 0.25 eV, as in Figure 3. The black arrow at the right of Figure 4 shows the driving force for charge recombination to the ground state; and the arrow at left shows the driving force for recombination to a state at the same energy as *P, which would then rapidly relax to the ground state. We take these as limiting cases.
Figure 5.
Hopping map for HL− → BL → P+ charge recombination in PRCs at 298 K λHL/BL =, λBL/P = 0.15, λHL/P = 0.25 eV and β = 1.1 Å−1. Distances (Å) are r1 = 5.3, r2 = 5.0, rT = 10. The dashed line is drawn at 0.15 eV (Figure 2) and the arrows at −1.3 and 0.25 eV are estimated limits of the overall driving force regime (see text). The contour lines are plotted at 0.2 log unit intervals.
Our map for HL− → BL → P+ charge recombination indicates that hopping does not occur (Figure 5), which is hard to understand since it is known that the HL/BL energy gap affects the rate of recombination, as noted above [42]. Hopping is predicted to occur in maps constructed with overall λ > 1 eV, but this is not realistic since reorganization should be the same in forward and reverse directions. Furthermore, nuclear tunneling could come into play the very high driving forces for charge recombination reactions. We emphasize that that it is very difficult to decouple changes in the relative energy levels and protein dynamics in site-directed PRC mutants, because single mutations can change the energies of more than one cofactor [40,41,42]. An ET pathway model predicts that large through space gaps inhibit charge recombination [35]; and, from a design perspective, there is no apparent advantage to hopping-assisted recombination, as this would only accelerate loss of productive charge-separated states.
6. Conclusions
Our hopping maps indicate that the charge-separation steps in PRCs, and likely also in structurally similar photoredox machines (PS I and II), occur at the maximum possible rates owing to very low nuclear reorganization energies. Forward ET is also promoted by a favorable arrangement of electronically coupled cofactors. High-driving-force charge recombination is more complicated, and our model does not account for many experimental observations. Fully understanding the factors that control hopping-assisted charge separation in reaction centers will aid the design and construction of artificial devices for solar energy conversion to electricity and fuels.
Highlights.
Photosynthetic reaction centers (PRCs) use hopping to separate electrons and holes.
We employ hopping maps to interpret electron flow in PRCs.
Charge-separation and charge-recombination reactions in PRCS are discussed.
Acknowledgments
Our work is supported by NIH (DK019038 to HBG and JRW; GM095037 to JJW), and an NSF Center for Chemical Innovation (Powering the Planet, CHE-0947829).
Footnotes
Dedicated to Ed Solomon on the occasion of his 65th birthday.
Publisher's Disclaimer: This is a PDF file of an unedited manuscript that has been accepted for publication. As a service to our customers we are providing this early version of the manuscript. The manuscript will undergo copyediting, typesetting, and review of the resulting proof before it is published in its final citable form. Please note that during the production process errors may be discovered which could affect the content, and all legal disclaimers that apply to the journal pertain.
References
- 1.(a) Brzezinski P, Aedelroth P. Curr Opin Struct Biol. 2006;16:465–472. doi: 10.1016/j.sbi.2006.06.012. [DOI] [PubMed] [Google Scholar]; (b) Kaila VRI, Verkhovsky MI, Wikström M. Chem Rev. 2010;110:7062–7081. doi: 10.1021/cr1002003. [DOI] [PubMed] [Google Scholar]
- 2.(a) Nelson N, Yocum CF. Annu Rev Plant Biol. 2006;57:521–565. doi: 10.1146/annurev.arplant.57.032905.105350. [DOI] [PubMed] [Google Scholar]; (b) Moore GF, Brudvig GW. Annu Rev Condens Matter Phys. 2011;2:303–327. [Google Scholar]
- 3.Voet DG, Voet JG. Biochemistry. 4. John Wiley and Sons; Hoboken, NJ: 2011. [Google Scholar]
- 4.Frigaard NU, Dahl C. Adv Microb Physiol. 2009;54:103–200. doi: 10.1016/S0065-2911(08)00002-7. [DOI] [PubMed] [Google Scholar]
- 5.Scholes GD, Fleming GR, Olaya-Castro A, van Grondelle R. Nat Chem. 2011;3:763–774. doi: 10.1038/nchem.1145. [DOI] [PubMed] [Google Scholar]
- 6.Warren JJ, Ener ME, Vlçek A, Jr, Winkler JR, Gray HB. Coord Chem Rev. doi: 10.1016/j.ccr.2012.03.032. [DOI] [PMC free article] [PubMed] [Google Scholar]
- 7.(a) Marcus RA, Sutin N. Biochim Biophys Acta. 1985;811:265–322. [Google Scholar]; (b) Sutin N. In: Progress in Inorganic Chemistry. Lippard SJ, editor. 1983. pp. 441–498. [Google Scholar]; (c) Barbara PF, Meyer TJ, Ratner MA. J Phys Chem. 1996;100:13148–13168. [Google Scholar]
- 8.http://www.bilrc.caltech.edu
- 9.(a) Shih C, Museth AK, Abrahamsson M, Blanco-Rodriguez AM, Di B, Angel J, Sudhamsu J, Crane BR, Ronayne KL, Towrie M, Vlček A, Jr, Richards JH, Winkler JR, Gray HB. Science. 2008;320:1760–1762. doi: 10.1126/science.1158241. [DOI] [PubMed] [Google Scholar]; (b) Blanco-Rodríguez AM, Di Bilio AJ, Shih C, Museth AK, Clark IP, Towrie M, Cannizzo A, Sudhamsu J, Crane BR, Sykora J, Winkler JR, Gray HB, Zális S, Vlček A. Chem Eur J. 2011;17:5350–5361. doi: 10.1002/chem.201002162. [DOI] [PMC free article] [PubMed] [Google Scholar]
- 10.Warren JJ, Winkler JR, Gray HB. FEBS Letters. 2012;586:596–602. doi: 10.1016/j.febslet.2011.12.014. [DOI] [PMC free article] [PubMed] [Google Scholar]
- 11.Deisenhofer J, Epp O, Miki K, Huber R, Michel H. Nature. 1985;318:618–624. doi: 10.1038/318618a0. [DOI] [PubMed] [Google Scholar]
- 12.Hohmann-Marriott MF, Blankenship RE. Annu Rev Plant Biol. 2011;62:515–548. doi: 10.1146/annurev-arplant-042110-103811. [DOI] [PubMed] [Google Scholar]
- 13.Brettel K. Biochim Biophys Acta. 1997;1318:322–373. [Google Scholar]
- 14.Rappaport F, Diner BA. Coord Chem Rev. 2008;252:259–272. [Google Scholar]
- 15.Michel-Beyerle ME, Plato M, Deisenhofer J, Michel H, Bixon M, Jortner J. Biochim Biophys Acta. 1988;932:52–70. [Google Scholar]
- 16.Kirmaier C, Gaul D, DeBey R, Holten D, Schenck CC. Science. 1991;251:922–927. doi: 10.1126/science.2000491. [DOI] [PubMed] [Google Scholar]
- 17.(a) Parson WW, Chu Z-T, Warshel A. Biochim Biophys Acta. 1990;1017:251–272. doi: 10.1016/0005-2728(90)90192-7. [DOI] [PubMed] [Google Scholar]; (b) Nagarajan V, Parson WW, Davis D, Schenck CC. Biochemistry. 1993;32:12324–12336. doi: 10.1021/bi00097a008. [DOI] [PubMed] [Google Scholar]; (c) Bylina EJ, Kirmaier C, McDowell L, Holten D, Youvan DC. Nature. 1988;336:182–184. [Google Scholar]
- 18.(a) Chuang JI, Boxer SG, Holten D, Kirmaier C. Biochemistry. 2006;45:3845–3851. doi: 10.1021/bi0601048. [DOI] [PubMed] [Google Scholar]; (b) Chuang JI, Boxer SG, Holten D, Kirmaier C. J Phys Chem B. 2008;112:5487–5499. doi: 10.1021/jp800082m. [DOI] [PubMed] [Google Scholar]
- 19.Marchanka A, Savitsky A, Lubitz W, Möbius K, van GMJ. Phys Chem B. 2010;114:14364–14372. doi: 10.1021/jp1003424. [DOI] [PubMed] [Google Scholar]
- 20.(a) Boxer SG. Annu Rev Biophys Biophys Chem. 1990;19:267–299. doi: 10.1146/annurev.bb.19.060190.001411. [DOI] [PubMed] [Google Scholar]; (b) Zinth W, Wachtveitl J. ChemPhysChem. 2005;6:871–880. doi: 10.1002/cphc.200400458. [DOI] [PubMed] [Google Scholar]
- 21.(a) Wang H, Lin S, Allen JP, Williams JC, Blankert S, Laser C, Woodbury NW. Science. 2007;316:747–750. doi: 10.1126/science.1140030. [DOI] [PubMed] [Google Scholar]; (b) Du M, Rosenthal SJ, Xie X, DiMagno TJ, Schmidt M, Hanson DK, Schiffer M, Norris JR, Fleming GR. Proc Natl Acad Sci USA. 1992;89:8517–8521. doi: 10.1073/pnas.89.18.8517. [DOI] [PMC free article] [PubMed] [Google Scholar]; (c) Balabin IA, Onuchic JN. Science Science. 2000;290:114–117. doi: 10.1126/science.290.5489.114. [DOI] [PubMed] [Google Scholar]; (d) Spiedel D, Roszak AW, McKendrick K, McAuley KE, Fyfe PK, Nabedryk E, Breton J, Robert B, Cogdell RJ, Isaacs NW, Jones MR. Biochim Biophys Acta. 2002;1554:75–93. doi: 10.1016/s0005-2728(02)00215-3. [DOI] [PubMed] [Google Scholar]
- 22.(a) Franzen S, Goldstein RF, Boxer SG. J Phys Chem. 1993;97:3040–3053. [Google Scholar]; (b) Gao JL, Shopes RJ, Wraight CA. Biochim Biophys Acta. 1990;1015:96–108. [Google Scholar]
- 23.(a) Kirmaier C, Holten D, Parson WW. Biochim Biophys Acta. 1985;810:33–48. [Google Scholar]; (b) Fleming GR, Martin JL, Breton J. Nature. 1988;333:190–192. [Google Scholar]; (c) Guo Z, Lin S, Xin Y, Wang H, Blankenship RE, Woodbury NW. J Phys Chem B. 2011;115:11230–11238. doi: 10.1021/jp204239v. [DOI] [PubMed] [Google Scholar]
- 24.(a) Gray HB, Winkler JRQ. Rev Biophys. 2003;36:341–372. doi: 10.1017/s0033583503003913. [DOI] [PubMed] [Google Scholar]; (b) Gray HB, Winkler JR. Biochim Biophys Acta. 2010;1797:1563–1572. doi: 10.1016/j.bbabio.2010.05.001. [DOI] [PubMed] [Google Scholar]
- 25.Meyer TJ, Taube H. In: Comp Coord Chem. Wilkinson G, editor. Pergamon; New York: 1987. pp. 331–384. [Google Scholar]
- 26.Eberson L. Adv Phys Org Chem. 1982:79–185. [Google Scholar]
- 27.(a) Wenger OS, Leigh BS, Villahermosa RM, Gray HB, Winkler JR. Science. 2005;307:99–102. doi: 10.1126/science.1103818. [DOI] [PubMed] [Google Scholar]; (b) Wenger OS. Chem Soc Rev. 2011;40:3538–3550. doi: 10.1039/c1cs15044h. [DOI] [PubMed] [Google Scholar]
- 28.See, for example: Kolbasov D, Scherz A. J Phys Chem B. 2000;104:1802–1809.Ceccarelli M, Marchi M. J Phys Chem B. 2003;107:5630–5641.Parson WW, Warshel A. J Phys Chem B. 2004;108:10474–10483.
- 29.(a) Martin JL, Breton J, Hoff AJ, Migus A, Antonetti A. Proc Natl Acad Sci USA. 1986;83:957–961. doi: 10.1073/pnas.83.4.957. [DOI] [PMC free article] [PubMed] [Google Scholar]; (b) Breton J, Martin JL, Migus A, Antonetti A, Orszag A. Proc Natl Acad Sci USA. 1986;83:5121–5125. doi: 10.1073/pnas.83.14.5121. [DOI] [PMC free article] [PubMed] [Google Scholar]
- 30.Kirmaier C, Holten D. Proc Natl Acad Sci USA. 1990;87:3552–3556. doi: 10.1073/pnas.87.9.3552. [DOI] [PMC free article] [PubMed] [Google Scholar]
- 31.(a) Lauterwasser C, Finkele U, Scheer H, Zinth W. Chem Phys Lett. 1991;183:471–477. [Google Scholar]; (b) Holzapfel W, Finkele U, Kaiser W, Oesterhelt D, Scheer H, Stilz HU, Zinth W. Proc Natl Acad Sci USA. 1990;87:5168–5172. doi: 10.1073/pnas.87.13.5168. [DOI] [PMC free article] [PubMed] [Google Scholar]; (c) Arlt T, Schmidt S, Kaiser W, Lauterwasser C, Meyer M, Scheer H, Zinth W. Proc Natl Acad Sci USA. 1993;90:11757–11761. doi: 10.1073/pnas.90.24.11757. [DOI] [PMC free article] [PubMed] [Google Scholar]
- 32.Huang L, Ponomarenko N, Wiederrecht GP, Tiede DM. Proc Natl Acad Sci USA. 2012;109:4851–4856. doi: 10.1073/pnas.1116862109. [DOI] [PMC free article] [PubMed] [Google Scholar]
- 33.(a) Bixon M, Jortner J, Michel-Beyerle ME. Chem Phys. 1995;197:389–404. [Google Scholar]; (b) Holzwarth AR, Müller MG. Biochemistry. 1996;35:11820–11831. doi: 10.1021/bi9607012. [DOI] [PubMed] [Google Scholar]; (c) Katilius E, Babendure J, Lin S, Woodbury N. Photosynth Res. 2004;81:165–180. [Google Scholar]
- 34.(a) Volk M, Aumeier G, Langenbacher T, Feick R, Ogrodnik A, Michel-Beyerle ME. J Phys Chem B. 1998;102:735–751. [Google Scholar]; (b) Goldstein RA, Boxer SG. Biochim Biophys Acta. 1989;977:78–86. [Google Scholar]; (c) Hartwich G, Lossau H, Michel-Beyerle ME, Ogrodnik A. J Phys Chem B. 1998;102:3815–3820. [Google Scholar]
- 35.Curry WB, Grabe MD, Kurnikov IV, Skourtis SS, Beratan DN, Regan JJ, Aquino AJA, Beroza P, OnuchicJ JN. Bioenerg Biomembr. 1995;27:285–293. doi: 10.1007/BF02110098. [DOI] [PubMed] [Google Scholar]
- 36.(a) Robles SJ, Breton J, Youvan DC. Science. 1990;248:1402–1405. doi: 10.1126/science.2192455. [DOI] [PubMed] [Google Scholar]; (b) Taguchi AKW, Stocker JW, Alden RG, Causgrove TP, Peloquin JM, Boxer SG, Woodbury NW. Biochemistry. 1992;31:10345–10355. doi: 10.1021/bi00157a024. [DOI] [PubMed] [Google Scholar]
- 37.(a) Katilius E, Katiliene Z, Lin S, Taguchi AKW, Woodbury NW. J Phys Chem B. 2002;106:1471–1475. [Google Scholar]; (b) Katilius E, Katiliene Z, Lin S, Taguchi AKW, Woodbury NW. J Phys Chem B. 2002;106:12344–12350. [Google Scholar]
- 38.Alden RG, Parson WW, Chu ZT, Warshel A. J Phys Chem. 1996;100:16761–16770. [Google Scholar]
- 39.(a) Woodbury NW, Parson WW, Gunner MR, Prince RC, Dutton PL. Biochim Biophys Acta. 1986;851:6–22. doi: 10.1016/0005-2728(86)90243-4. [DOI] [PubMed] [Google Scholar]; (b) Arata H, Parson WW. Biochim Biphys Acta. 1981;636:70–81. doi: 10.1016/0005-2728(81)90077-3. [DOI] [PubMed] [Google Scholar]; (c) Ortega JM, Mathis P, Williams JC, Allen JP. Biochemistry. 1996;35:3354–3361. doi: 10.1021/bi952882y. [DOI] [PubMed] [Google Scholar]
- 40.(a) Closs GL, Miller JR. Science. 1988;240:440–447. doi: 10.1126/science.240.4851.440. [DOI] [PubMed] [Google Scholar]; (b) Liang N, Miller JR, Closs GL. J Am Chem Soc. 1990;112:5353–5354. [Google Scholar]
- 41.Tang C-K, Williams JC, Taguchi AKW, Allen JP, Woodbury NW. Biochemistry. 1999;38:8794–8799. doi: 10.1021/bi990346q. [DOI] [PubMed] [Google Scholar]
- 42.(a) Gibasiewicz K, Pajzderska M, Ziółek M, Karolczak J, Dobek A. J Phys Chem B. 2009;113:11023–11031. doi: 10.1021/jp811234q. [DOI] [PubMed] [Google Scholar]; (b) Gibasiewicz K, Pajzderska M, Ziólek M, Karolczak J, Dobek A. J Phys Chem B. 2009;113:11023–11031. doi: 10.1021/jp811234q. [DOI] [PubMed] [Google Scholar]; (c) Wang H, Hao Y, Jiang Y, Lin S, Woodbury NW. J Phys Chem B. 2011;116:711–717. doi: 10.1021/jp211702b. [DOI] [PubMed] [Google Scholar]; (d) Gibasiewicz K, Pajzderska M, Potter JA, Fyfe PK, Dobek A, Brettel K, Jones MR. J Phys Chem B. 2011;115:13037–13050. doi: 10.1021/jp206462g. [DOI] [PubMed] [Google Scholar]
- 43.Pawlowicz NP, van Grondelle R, van Stokkum IHM, Breton J, Jones MR, Groot ML. Biophys J. 2008;95:1268–1284. doi: 10.1529/biophysj.108.130880. [DOI] [PMC free article] [PubMed] [Google Scholar]


