

Abstract
Systemic lupus erythematosus (SLE) is a systemic autoimmune disease with abnormal T cell immune responses. We hypothesized that aberrant expression of microRNAs (miRNAs) in T cells may contribute to the pathogenesis of SLE. First, we analysed the expression profiles of 270 human miRNAs in T cells from five SLE patients and five healthy controls and then validated those potentially aberrant-expressed miRNAs using real-time polymerase chain reaction (PCR). Then, the expression of mRNAs regulated by these aberrant-expressed miRNAs was detected using real-time PCR. Finally, miRNA transfection into Jurkat T cells was conducted for confirming further the biological functions of these miRNAs. The initial analysis indicated that seven miRNAs, including miR-145, miR-224, miR-513-5p, miR-150, miR-516a-5p, miR-483-5p and miR-629, were found to be potentially abnormally expressed in SLE T cells. After validation, under-expressed miR-145 and over-expressed miR-224 were noted. We further found that STAT1 mRNA targeted by miR-145 was over-expressed and apoptosis inhibitory protein 5 (API5) mRNA targeted by miR-224 was under-expressed in SLE T cells. Transfection of Jurkat cells with miR-145 suppressed STAT1 and miR-224 transfection suppressed API5 protein expression. Over-expression of miR-224 facilitates activation-induced cell death in Jurkat cells. In the clinical setting, the increased transcript levels of STAT1 were associated significantly with lupus nephritis. In conclusion, we first demonstrated that miR-145 and miR-224 were expressed aberrantly in SLE T cells that modulated the protein expression of their target genes, STAT1 and API5, respectively. These miRNA aberrations accelerated T cell activation-induced cell death by suppressing API5 expression and associated with lupus nephritis by enhancing signal transducer and activator of transcription-1 (STAT)-1 expression in patients with SLE.
Keywords: API5, miR-145, miR-224, STAT-1, systemic lupus erythematosus
Introduction
Systemic lupus erythematosus (SLE) is a systemic autoimmune disease with complex aberrant cellular and humoral immune responses [1–3]. Diverse T cell dysfunction, such as defective gene transcription and altered cytokine production, has been found in patients with SLE. Thus, dysregulated T cells could play an important role in lupus pathogenesis [4]. MicroRNAs (miRNAs) are small conserved non-coding RNA molecules that regulate the expression of multiple target genes by targeting the 3′-untranslated region (UTR) of messenger RNAs (mRNAs), resulting in degradation or translational repression of mRNA. In the immune system, miRNA modulate both innate and adaptive immune responses [5]. Altered miRNA expression is implicated in the pathogenesis of many different autoimmune diseases [6–9]. Recently, several studies have demonstrated that altered expression of miRNAs, including miR-146a, miR-21, miR-126, miR-125a and miR-148a, in peripheral blood mononuclear cells (PBMCs) or T cells from patients with SLE is associated with innate immunity, inflammation and DNA methylation [10–15]. The altered expression of miRNAs is found even in sera and urine from lupus patients [16,17], and is involved in the development of lupus nephritis [18,19]. In considering the extremely complex pathogenesis of immune dysfunction in SLE, it is possible that many more miRNAs may be involved in the immunopathogenesis of SLE. Therefore, we hypothesized that aberrant expression of miRNAs in T cells from SLE patients would affect the downstream target molecule expressions that contribute to lupus pathogenesis.
In the present study, we first demonstrated that the expression of miR-145 and miR-224 was altered in SLE T cells. We also confirmed that altered expression of miR-145 and miR-224 affected the expression of their target proteins, signal transducer and activator of transcription-1 (STAT-1) and apoptosis inhibitory protein 5 (API5). Transfection of miR-224 into Jurkat T cells promptly caused cell apoptosis, which is consistent with T cell abnormalities in SLE. In addition, increased expression of STAT-1 mRNA was found to have a significant association with lupus nephritis in the clinical setting.
Material and methods
Patients and controls
Twenty-six patients in total satisfying the 1982 American College of Rheumatology (ACR) revised criteria for the classification of SLE [20] were recruited, and 27 age-matched healthy volunteers served as a control group. Each participant signed an informed consent approved by the local Internal Review Board and Ethics Committee of Buddhist Dalin Tzu Chi General Hospital, Chia-Yi, Taiwan (no. B09702020). Demographic and clinical data of the SLE patients were recorded. Blood samples were collected at least 12 h after the last dose of immunosuppressants in order to minimize drug effects in the in-vitro studies.
First, blood samples from five SLE patients and five healthy controls (the screening group) were used to analyse the expression profile of 270 human miRNAs in T cells by real-time polymerase chain reaction (PCR). Secondly, we validated the expression levels of these potentially aberrant miRNAs in T cells from another 21 SLE patients and 22 healthy controls (the validation group). Finally, we analysed the correlation between different clinical parameters and expression levels of miRNA and mRNA using all the SLE patients from both the screening and validation groups. Three patients in the screening group were excluded due to lack of enough specimens for analysis of the expression levels of mRNA.
Preparation of RNA from T cells
Heparinized venous blood obtained from SLE patients and healthy volunteers was mixed with a one-quarter volume of 2% dextran solution (MW 464 000 Da; Sigma-Aldrich, St Louis, MO, USA) and incubated at room temperature for 30 min. Leucocyte-enriched supernatant was collected and layered over a Ficoll-Hypaque density gradient solution (specific gravity 1·077; Pharmacia Biotech, Uppsala, Sweden). After centrifugation (250 g) at room temperature for 25 min, mononuclear cells were aspirated from the interface. T cells were purified further using anti-human CD3 magnetic particles using an IMag Cell Separation System (BD Bioscience, Franklin Lakes, NJ, USA). Total RNA, including miRNA, was extracted from the purified T cells using the mirVana miRNA isolation kit (Ambion, Austin, TX, USA), according to the manufacturer's protocol. The concentration of RNA was quantified using a NanoDrop Spectrophotometer.
Reverse transcription (RT) of miRNAs
All the extracted miRNAs were converted into corresponding cDNAs following the method of Chen et al. [21]. Briefly, a 10-μl reaction mixture containing miRNA-specific stem-loop RT primers (final concentration 2 nM each), 500 μM deoxyribonucleotide triphosphates (dNTPs), 0·5 μl Superscript III (Invitrogen, Carlsbad, CA, USA) and 1 μg total RNA were used for the reverse transcription (RT) reaction. The pulsed RT reaction was performed under the following conditions: 16°C for 30 min, followed by 50 cycles at 20°C for 30 s, 42°C for 30 s and 50°C for 1 s. After RT, the products were diluted 20-fold before further analysis.
Measurement of miRNA expression by real-time PCR
A real-time PCR-based method was used to quantify the expression levels of miRNAs using a protocol described previously [22]. The prepared RT product (1 μl) was used as the PCR template. Each PCR reaction contained 1 × SYBR Master Mix (Applied Biosystems, Foster City, CA, USA), 200 nM miRNA-specific forward primer and 200 nM universal reverse primer. All reactions were performed in duplicate on an ABI Prism 7500 fast real-time PCR system (Applied Biosystems). The conditions for quantitative PCR were 95°C for 10 min, followed by 40 cycles of 95°C for 15 s and 63°C for 32 s. Expression of the U6 small nuclear RNA was used as an endogenous control for data normalization. The threshold cycle (Ct) is defined as the cycle number at which the fluorescence intensity change crosses the average background level of the fluorescence signal. In the initial screening studies, the normalized miRNA level was defined by the equation (39 – Ct after normalization by the internal control) with global median normalization before further analysis. For the analysis of individual miRNA expression, the value of each Ct was first normalized by U6 small nuclear RNA (snRNA) and then the normalized miRNA level was defined by the equation (39 – Ct after normalization by the expression of U6 snRNA).
Measurement of STAT-1 and API5 mRNA expression by real-time PCR
The expression levels of STAT-1 and API5 mRNA were quantified by real-time PCR using the one-step RT–PCR kit (TaKaRa, Shiga, Japan) on an ABI Prism 7500 fast real-time PCR system (Applied Biosystems). The primers for STAT-1 were 5′-ACC-GCACCTTCAGTCTTTTCC-3′ (forward) and 5′-TGAACTGGACCCCTGTCT-TCA-3′ (reverse) [23]. The primers for API5 were 5′-TGATGGGTTTGGAGAA-GTTCCG-3′ (forward) and 5′-TCACTTGATAGGCATCTTTATGC-3′ (reverse) [24]. Conditions for the quantitative PCR were 42°C for 5 min and 95°C for 10 s for RT, followed by 40 cycles of 95°C for 5 s and 34°C for 34 s. Expression of 18S ribosomal RNA was used as endogenous control for data normalization. The normalized mRNA level was defined by the equation (39 – Ct after normalization by the expression of 18S ribosomal RNA).
Transfection of miRNA into Jurkat cells
Jurkat T cells (1 × 10⁶/ml) purchased from the American Type Culture Collection (Manassas, VA, USA) were electroporated with 1 μg of scrambled oligonucleotides or miRNA mimics (Ambion) using the Gene Pulser MXcell electroporation system (Bio-Rad Laboratories, Hercules, USA) using the condition developed by Jordan et al. [25]. Jurkat cells were then lysed with 1% NP-40 (Sigma-Aldrich) in the presence of a proteinase inhibitor cocktail (Sigma-Aldrich) 24 h after transfection for further analysis.
Western blotting of cell lysates
One hundred μg of the cell lysates were electrophoresed and transferred to a polyvinylidene difluoride (PVDF) sheet (Sigma-Aldrich). The membranes were incubated with the primary antibodies followed by horseradish peroxidase (HRP)-conjugated secondary antibodies. Mouse monoclonal anti-STAT-1 and rabbit polyclonal anti-API5 antibodies were purchased from Santa Cruz Biotechnology (Santa Cruz, CA, USA), and mouse monoclonal anti-β-actin antibody was purchased from Sigma-Aldrich as an internal control. Goat anti-rabbit and goat anti-mouse immunoglobulin (Ig)G antibodies were purchased from Jackson ImmunoResearch Laboratories (West Grove, PA, USA). The cognate molecules were visualized using a chemiluminescence reaction (ECL; GE Healthcare, Little Chalfont, UK). The band intensities were analysed using Image J software (version 1·42; http://rsb.info.nih.gov/ij).
Detection of apoptosis by flow cytometry
Jurkat cells (1 × 10⁶/ml) were activated by 500 ng/ml ionomycin (Sigma-Aldrich) and 10 ng/ml phorbol 12-myristate 13-acetate (PMA; Sigma-Aldrich) for 24 h. The percentage apoptosis of Jurkat cells was then determined after staining with propidium iodide (BD Bioscience) and analysed by fluorescence activated cell sorter (FACS)can flow cytometry (Becton Dickinson) using Lysis II software.
Statistical analysis
All data are presented as mean ± standard deviation (s.d.). Statistical significance was assessed using the Mann–Whitney U-test and a P-value of less than 0·05 was considered statistically significant.
Results
Patients
The demographic and clinical data of the patients with SLE and healthy volunteers are presented in Table 1.
Table 1.
Demographic and clinical data of systemic lupus erythematosus (SLE) patients and healthy volunteers
| SLE patients (screening) (n = 5 ) | SLE patients (validation) (n = 21 ) | Healthy volunteers (n = 22) | P-value* | |
|---|---|---|---|---|
| Age (mean years ± s.d.) | 40·0 ± 9·3 | 35·1 ± 10·8 | 37·3 ± 8·0 | 0·197 |
| Sex (female : male) | 4:1 | 17:4 | 11:11 | 0·055 |
| SLEDAI score | 1·4 ± 1·7 | 4·4 ± 5·6 | – | |
| Anti-dsDNA (IU/ml) | 17·4 ± 21·2 | 67·0 ± 71·5 | – | |
| C3 (mg/dl) | 104·4 ± 7·7 | 92·9 ± 29·3 | – | |
| Lupus nephritis | 40% (2/5) | 52·4% (11/21) | – | |
| Immunosuppressants | ||||
| Corticosteroids | 100% (5/5) | 100% (21/21) | – | |
| Steroid dosage equivalence tomethylprednisolone (mg/day) | 4·8 ± 1·8 | 6·0 ± 2·8 | – | |
| Hydroxychloroquine | 100% (5/5) | 100% (21/21) | – | |
| Mycophenolic acid | 0% (0/5) | 14·3% (3/21) | – | |
| Azathioprine | 20% (1/5) | 38·1% (8/21) | – | |
| Cyclosporin | 0% (0/5) | 4·8% (1/21) | – |
Comparison between the SLE patients (the validation group) and healthy volunteers. DAI: disease activity index; s.d.: standard deviation.
Identification and verification of differential expression of miRNAs in T cells from patients with SLE and controls
To identify miRNAs that were expressed potentially differentially in SLE T cells, we analysed the expression levels of 270 human miRNAs in T cells from five SLE patients and five healthy controls (Fig. 1a). We found that the expression of seven microRNAs, including miR-145, miR-224, miR-513-5p, miR-150, miR-516a-5p, miR-483-5p and miR-629, in T cells was different between SLE patients and control groups (defined by fold change > 3·9 and P-value < 0·05; Fig. 1b). We then validated these results by comparing the expression levels of these seven miRNAs in additional T cells from 21 SLE patients and 22 healthy controls. We confirmed that decreased miR-145 (fold change: 0·43, P = 0·020) and increased miR-224 (fold change: 2·01, P = 0·015) expressions were found in SLE T cells compared to normal T cells (Fig. 1c). The fold change was transformed from the difference of Ct value by exponentiation.
Fig. 1.
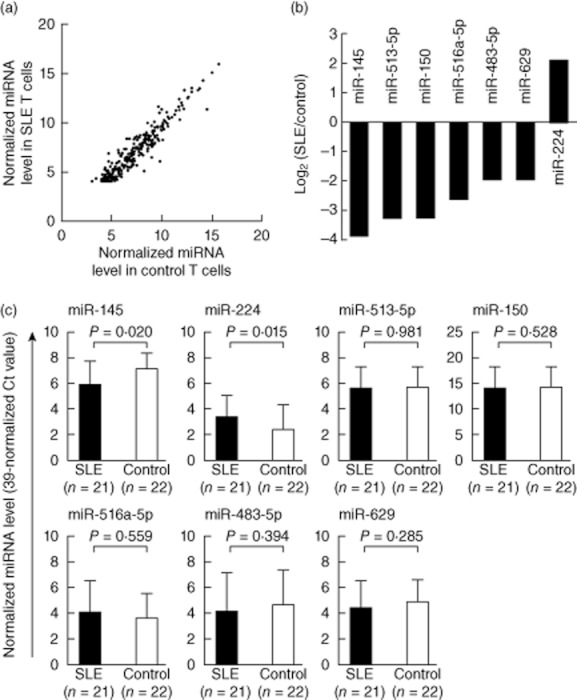
Altered expression of microRNA (miRNA) in T cells from patients with systemic lupus erythematosus (SLE). (a) Expression profile of 270 microRNAs (miRNAs) in T cells from SLE patient and healthy controls measured by real-time polymerase chain reaction (PCR). Each scatter spot represents the average normalized expression level in T cells from five SLE patients and five healthy controls for each miRNA. The threshold cycle (Ct) is defined as the cycle number at which the change of fluorescence intensity crosses the average background level of the fluorescence signal. The normalized miRNA level was defined as (39 – Ct) after normalization with the internal control (U6 small nuclear RNA). All data are presented as mean ± standard deviation. (b) Seven miRNAs were found to be potentially aberrant expressions in SLE T cells. miR-145, miR-513-5p, miR-150, miR-516a-5p, miR-483-5p and miR-629 were down-regulated, whereas miR-224 was up-regulated (fold change > 3·9; P-value < 0·05). (c) Altered expression of miR-145 and miR-224 in T cells from SLE patients after validation. The seven abnormally expressed miRNAs in T cells were validated by real-time PCR from 21 SLE patients and 22 healthy controls.
Correlation of STAT-1 and API5 mRNA levels and their corresponding miRNA expression in T cells from SLE patients and healthy controls
Gregersen et al. [23] and Wang et al. [24] found that miR-145 and miR-224, respectively, targeted their corresponding gene transcripts, STAT-1 and API5, separately. Accordingly, we decided to compare the mRNA expression levels of STAT-1 and API5 in T cells from SLE patients and healthy controls using real-time PCR. We confirmed that the mRNA levels of STAT-1 (target of miR-145) were increased modestly but significantly (fold change: 1·59), whereas the expression level of API5 (target of miR-224) was decreased significantly (fold change: 0·70) in SLE T cells compared to normal T cells (Fig. 2a). The fold change was transformed from the Ct value difference by exponentiation. The inverse correlation between miR-145 and STAT-1 mRNA expressions is shown in Fig. 2b. In contrast, no significant correlation was noted between miR-224 and API5 expression (Fig. 2c).
Fig. 2.
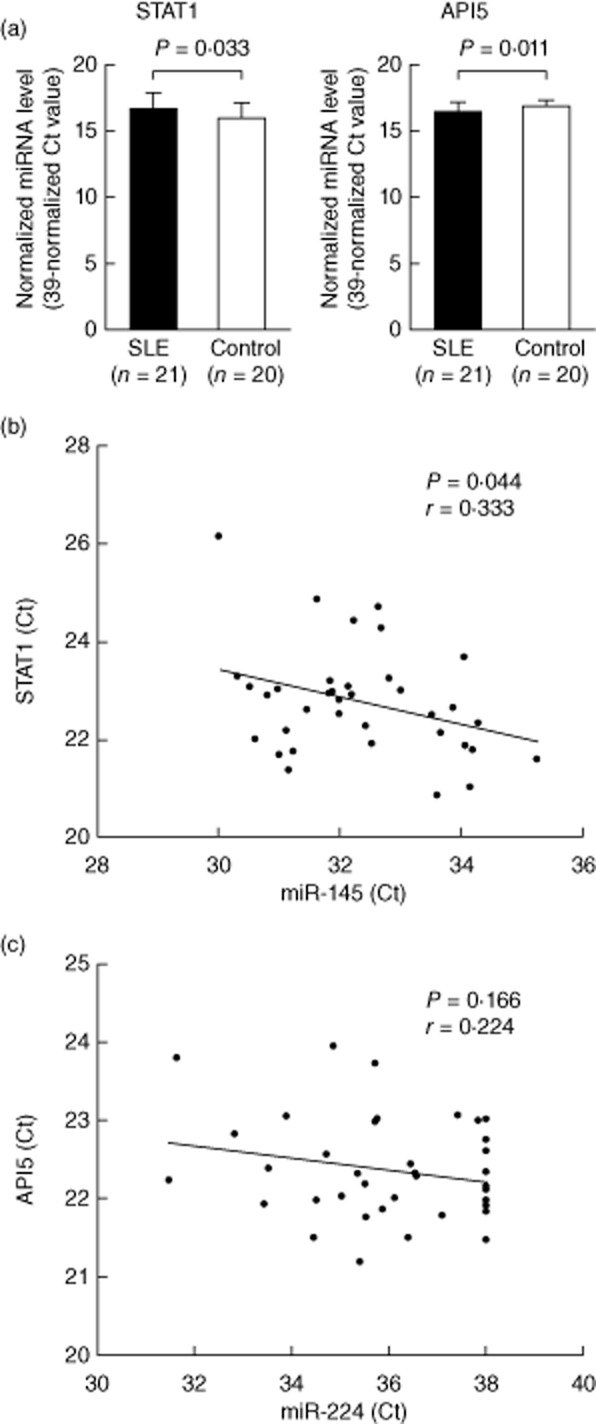
Comparison of signal transducer and activator of transcription-1 (STAT)-1 and apoptosis inhibitory protein 5 (API)5 microRNA (miRNA) expression levels in systemic lupus erythematosus (SLE) patients and normal controls and the correlation of mRNA expression with their corresponding miRNAs in SLE T cells. (a) The mRNA expression levels of STAT-1 increased and those of API5 decreased in SLE T cells analysed by real-time polymerase chain reaction (PCR). The normalized mRNA level was defined as (39 – Ct) after normalization with the internal control (18S ribosomal RNA). (b) Inverse correlation between STAT-1 mRNA and miR-145 expression. (c) No significant correlation between API5 mRNA and miR-224 expression.
miR-145 transfection suppressed STAT-1 expression
In the next experiment, we transfected miR-145 into Jurkat cells for direct observation of the effects on STAT-1 mRNA and protein expression. We found that the levels of miR-145 increased dramatically after transfection (Fig. 3a), and suppressed the expression of STAT-1 mRNA modestly but significantly (Fig. 3b). The increased expression of miR-145 inhibited significantly the protein expression of STAT-1, shown in Fig. 3c,d, 24 h after transfection.
Fig. 3.
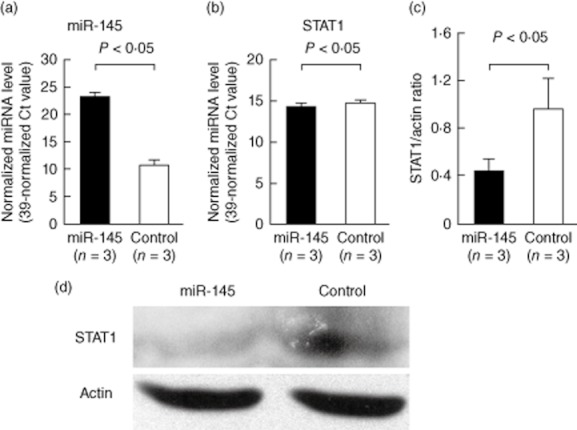
Effects of microR (miR)-145 transfection on signal transducer and activator of transcription-1 (STAT)-1 gene expression in Jurkat cells after electroporation. The expression of mRNA, miRNAs and protein was analysed 24 h after transfection. (a) The expression level of miR-145 was elevated dramatically in the Jurkat cells after transfection with miR-145 compared to the scramble oligonucleotide-transfected control groups. (b) The expression levels of STAT-1 mRNA were suppressed modestly but significantly by miR-145 transfection. (c) The STAT-1 protein expression was suppressed significantly by miR-145 transfection after 24 h. (d) A representative example.
miR-224 transfection suppressed API5 expression and promoted activation-induced cell death in Jurkat cells
We transfected miR-224 into Jurkat cells to observe directly the effects on mRNA and protein expression of API5. As shown in Fig 4a, the expression levels of miR-224 increased dramatically after transfection. Unexpectedly, the increased miR-224 expression did not suppress mRNA expression of API5 significantly (Fig. 4b), but suppressed significantly protein expression of API5, shown in Fig. 4c,d, 24 h after transfection. It is possible that miR-224 transfection did not degrade but impaired markedly the protein translation efficiency of API5 mRNA. This impairment may lead to inconsistency between mRNA and protein levels of API5. Because API5 is an anti-apoptotic molecule that prevents cell apoptosis after deprivation of growth factor [26], we hypothesized that the decreased expression of API5 due to enhanced miR-224 expression would affect activated T cell survival. We found that miR-224-transfected Jurkat cells were more susceptible to activation-induced cell death compared with those transfected with the scramble RNA (Fig. 5b). A representative case is shown in Fig. 5a. These results could suggest that increased expression of miR-224 in SLE T cells enhances apoptosis of these cells after stimulation [27].
Fig. 4.

Effects of microR (miR)-224 transfection on apoptosis inhibitory protein 5 (API)5 expression in Jurkat cells by electroporation. The expression of mRNA, miRNAs and protein was analysed 24 h after transfection. (a) The expression level of miR-224 was elevated dramatically in the Jurkat cells after transfection with miR-224 compared to the scramble oligonucleotide-transfected control groups. (b) After transfection for 24 h, the expression levels of API5 mRNA were not suppressed significantly by miR-224 transfection. (c) The expression of API5 protein was suppressed significantly by miR-224 transfection. (d) A representative example.
Fig. 5.
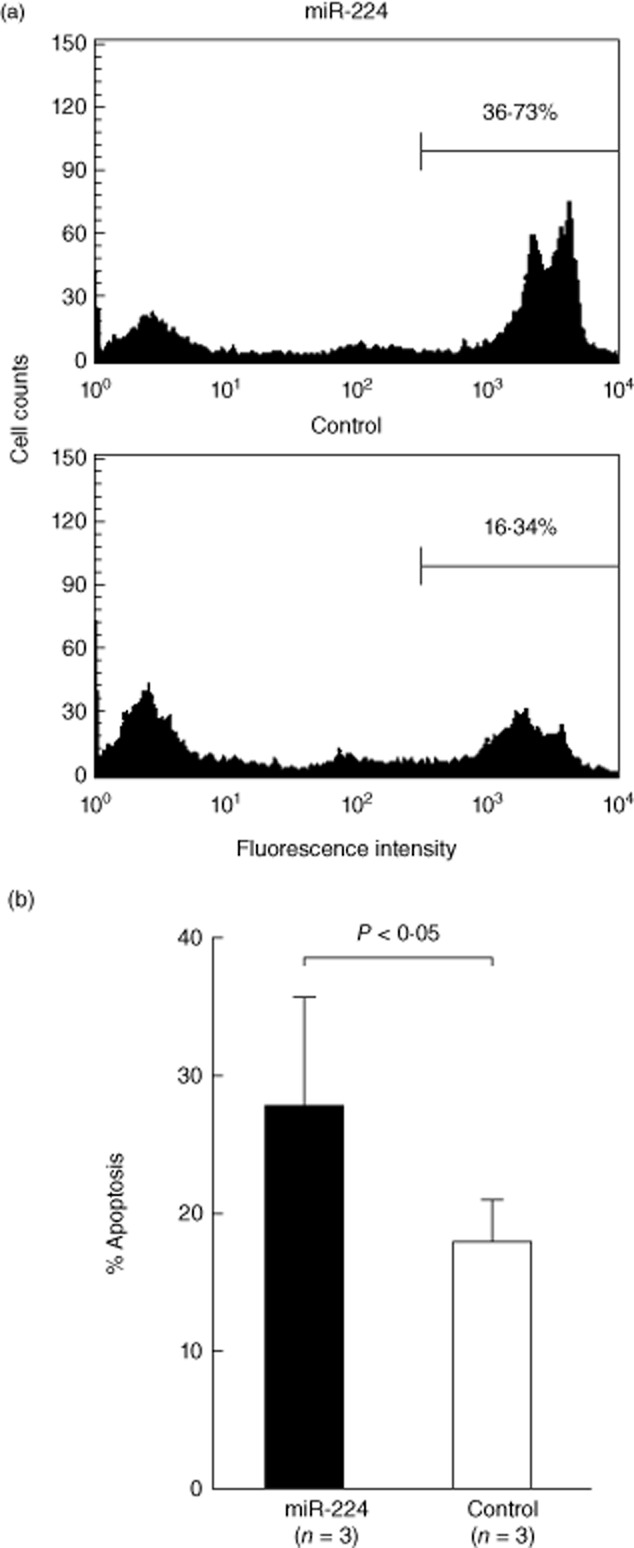
Effects of microR (miR)-224 transfection on activation-induced cell death in Jurkat cells by electroporation. The miR-224 or scramble RNA-transfected (control) Jurkat cells were then stimulated with ionomycin (500 ng/ml) and phorbol myristate acetate (PMA) (10 mg/ml) for 24 h. The treated transfected Jurkat cells were then stained by propidium iodide (PI) staining solution for measurement of % apoptosis by flow cytometry. (a) A representative case; (b) percentage of cell apoptosis.
Expression levels of STAT-1 mRNA were associated significantly with lupus nephritis
Finally, we analysed the correlation between different clinical parameters and expression levels of miR-145, miR-224, STAT-1 and API5. Initial analysis showed that only the expression level of STAT-1 was associated significantly with lupus nephritis. SLE patients with lupus nephritis had a 2·27-fold higher level of STAT-1 transcript expression than patients without lupus nephritis [P = 0·014; 95% confidence interval (CI): 1·20–4·29; Table 2]. After adjusting for age, gender and SLE disease activity index (SLEDAI), a significant association with lupus nephritis remained, with a 2·04-fold increase in STAT-1 transcript expression (P = 0·038; 95% CI: 1·04–3·99).
Table 2.
Unadjusted and adjusted liner regression models for assessing the correlations among different clinical parameters and T cell signal transducer and activator of transcription-1 (STAT)-1 expression levels in 23 patients with systemic lupus erythematosus (SLE)*
| Univariate fold change | P-value | Multivariate† fold change | P-value | |
|---|---|---|---|---|
| Age (per 10 years) | 0·92 (0·66–1·28) | 0·605 | 0·95 (0·69–1·34) | 0·757 |
| Sex (male/female) | 0·60 (0·24–2·49) | 0·253 | 0·66 (0·27–1·59) | 0·330 |
| SLEDAI score (per 1 point) | 1·06 (0·99–1·13) | 0·055 | 1·03 (0·96–1·11) | 0·348 |
| Anti-dsDNA (per 10 IU/ml) | 1·02 (0·97–1·07) | 0·412 | – | – |
| C3 (per 10 mg/dl) | 0·94 (0·83–1·07) | 0·345 | – | – |
| Lupus nephritis (yes/no) | 2·27 (1·20–4·29) | 0·014 | 2·04 (1·04–3·99) | 0·038 |
| Steroid dosage equivalence to methylprednisolone (mg/day) | 1·09 (0·95–1·25) | 0·189 | ||
| Potent immunosuppressants‡ (yes/no) | 1·45 (0·70–3·00) | 0·300 | – | – |
SLE patients from both the screening and validation group were included, but three patients in the screening group were excluded due to lack of enough specimens for analysing the expression levels of mRNA.
After analysis with the multiple linear regression model adjusted for age and gender, only lupus nephritis, but not SLE disease activity index (DAI) score, was correlated significantly with increased expression of STAT-1.
SLE patients received azathioprine, mycophenolic acid or cyclosporin in addition to steroid and hydroxychloroquine.
Discussion
Our results demonstrate decreased expression of miR-145 and increased expression of miR-224 in T cells from SLE patients compared with normal T cells. Several miRNAs, including miR-146a, miR-125a, miR-126, miR-21 or miR-148a, were found recently to be involved in lupus pathogenesis [10–14]. These abnormally expressed miRNAs were also included in the 270 miRNAs screened by us in the present study. However, we failed to find a significant difference in the expression profiles of these five miRNAs in T cells from five SLE patients and five healthy controls. Due to the small sample size, it is possible that false positive and false negative results might exist in the initial screen. Also, differences in many parameters, such as detection methodology, cell subpopulations (PBMCs, CD4+ T cells or total T cells), and different patient populations, including genetic backgrounds and disease activity, diverse abnormal immune function and clinical manifestation in SLE patients in different studies, may potentially affect the expression profiles of the miRNAs. Nevertheless, we confirmed decreased miR-145 and increased miR-224 expression in SLE T cells in further analysis of 21 SLE patients and 22 healthy controls.
In the cell miRNA transfection experiments, over-expression of miR-145 in Jurkat cells suppressed the mRNA and protein expression of STAT-1, an important transcription factor involved in the interferon-mediated signalling pathway that may induce autoimmunity, particularly in SLE [28–31]. Some authors further demonstrated over-expressed STAT-1 in PBMCs and T cells of patients with SLE [32,33]. Our finding of miR-145 under-expression in SLE T cells is consistent with STAT-1 over-expression in these cells, contributing to the immunopathogenesis of SLE. It is equally interesting that STAT-1 over-expression in SLE T cells was associated significantly with lupus nephritis. This original observation was supported further by studies directly showing activation of the STAT-1 pathway in kidney tissues obtained from autoimmune Murphy Roths large lymphoproliferation (MRL/lpr) mice and SLE patients [34,35]. Furthermore, inhibition of STAT-1 activation via targeting Janus kinase ameliorated the severity of lupus nephritis in an animal model and provided a potential therapeutic basis for SLE patients [36]. We note that the expression levels of STAT-1, but not miR-145, in SLE T cells was associated with lupus nephritis. In addition to miR-145, it is conceivable that the expression of STAT-1 is also controlled by other miRNAs, such as miR-146a, which was found to be down-regulated in SLE [13]. Therefore, it is possible that decreased expression of miR-146a also contributed to the high STAT-1 expression that may have confounded our results.
We also showed that over-expression of miR-224 suppressed protein but not mRNA levels of API5 in T cells (Fig. 4b,c). This may be because miR-224 hindered API5 protein translation rather than mRNA degradation. However, the real mechanism needs further investigation. The API5 molecule has been identified as a survival molecule inhibiting cell apoptosis after growth factor withdrawal [26,37]. In the present study, we confirmed further that miR-224-transfected Jurkat cells were more susceptible to activation-induced cell death, one of the immunopathological phenomena in SLE T cells [38,39]. This result suggests that decreased expression of API5 in SLE T cells contributes to lupus pathogenesis by facilitating cell apoptosis. However, further investigation using an animal model is needed to clarify the in-vivo pathological roles of miR-145 and miR-224 in SLE, as shown in the report by Dai et al. [40]. Another unsolved question remains – that one miRNA can potentially repress a number of target gene translations simultaneously [41]. The functional relationships between miR-145 and miR-224 and their target proteins have not been characterized fully in the present study. We deduce that other proteins and pathways regulated by miR-145 and miR-224 are also involved in the pathogenesis of SLE. Clearly, more investigation is required to resolve this.
In conclusion, we demonstrate for the first time that under-expressed miR-145 and over-expressed miR-224 is found in SLE T cells. In miRNA transfection studies, over-expression of miR-145 suppressed the gene expression of STAT-1 which seems to be associated with lupus nephritis. Over-expression of miR-224 suppressed expression of API5, which facilitates the activation-induced cell death of T cells. These observations may contribute to the immunopathogenesis of SLE.
Acknowledgments
This work was supported by a grant from the National Science Council (NCS 101–2314-B-303-028-MY3) and the Buddhist Dalin Tzu Chi General Hospital (DTCRD98-01), Taiwan.
Disclosure
The authors declare no conflicts of interest.
References
- 1.Cook HT, Botto M. Mechanisms of disease: the complement system and the pathogenesis of systemic lupus erythematosus. Nat Clin Pract Rheumatol. 2006;2:330–337. doi: 10.1038/ncprheum0191. [DOI] [PubMed] [Google Scholar]
- 2.Moulton VR, Tsokos GC. Abnormalities of T cell signaling in systemic lupus erythematosus. Arthritis Res Ther. 2011;13:207. doi: 10.1186/ar3251. [DOI] [PMC free article] [PubMed] [Google Scholar]
- 3.Dorner T, Giesecke C, Lipsky PE. Mechanisms of B cell autoimmunity in SLE. Arthritis Res Ther. 2011;13:243. doi: 10.1186/ar3433. [DOI] [PMC free article] [PubMed] [Google Scholar]
- 4.Crispín JC, Kyttaris VC, Terhorst C, Tsokos GC. T cells as therapeutic targets in SLE. Nat Rev Rheumatol. 2010;6:317–325. doi: 10.1038/nrrheum.2010.60. [DOI] [PMC free article] [PubMed] [Google Scholar]
- 5.Pauley KM, Cha S, Chan EK. MicroRNA in autoimmunity and autoimmune diseases. J Autoimmun. 2009;32:189–194. doi: 10.1016/j.jaut.2009.02.012. [DOI] [PMC free article] [PubMed] [Google Scholar]
- 6.Stanczyk J, Pedrioli DM, Brentano F, et al. Altered expression of microRNA in synovial fibroblasts and synovial tissue in rheumatoid arthritis. Arthritis Rheum. 2008;58:1001–1009. doi: 10.1002/art.23386. [DOI] [PubMed] [Google Scholar]
- 7.Kapsogeorgou EK, Gourzi VC, Manoussakis MN, Moutsopoulos HM, Tzioufas AG. Cellular microRNAs (miRNAs) and Sjogren's syndrome: candidate regulators of autoimmune response and autoantigen expression. J Autoimmun. 2011;37:129–135. doi: 10.1016/j.jaut.2011.05.003. [DOI] [PubMed] [Google Scholar]
- 8.Padgett KA, Lan RY, Leung PC, et al. Primary biliary cirrhosis is associated with altered hepatic microRNA expression. J Autoimmun. 2009;32:246–253. doi: 10.1016/j.jaut.2009.02.022. [DOI] [PMC free article] [PubMed] [Google Scholar]
- 9.Pauley KM, Satoh M, Chan AL, Bubb MR, Reeves WH, Chan EK. Upregulated miR-146a expression in peripheral blood mononuclear cells from rheumatoid arthritis patients. Arthritis Res Ther. 2008;10:R101. doi: 10.1186/ar2493. [DOI] [PMC free article] [PubMed] [Google Scholar]
- 10.Stagakis E, Bertsias G, Verginis P, et al. Identification of novel microRNA signatures linked to human lupus disease activity and pathogenesis: miR-21 regulates aberrant T cell responses through regulation of PDCD4 expression. Ann Rheum Dis. 2011;70:1496–1506. doi: 10.1136/ard.2010.139857. [DOI] [PubMed] [Google Scholar]
- 11.Zhao S, Wang Y, Liang Y, et al. MicroRNA-126 regulates DNA methylation in CD4+ T cells and contributes to systemic lupus erythematosus by targeting DNA methyltransferase 1. Arthritis Rheum. 2011;63:1376–1386. doi: 10.1002/art.30196. [DOI] [PubMed] [Google Scholar]
- 12.Zhao X, Tang Y, Qu B, et al. MicroRNA-125a contributes to elevated inflammatory chemokine RANTES levels via targeting KLF13 in systemic lupus erythematosus. Arthritis Rheum. 2010;62:3425–3435. doi: 10.1002/art.27632. [DOI] [PubMed] [Google Scholar]
- 13.Tang Y, Luo X, Cui H, et al. MicroRNA-146A contributes to abnormal activation of the type I interferon pathway in human lupus by targeting the key signaling proteins. Arthritis Rheum. 2009;60:1065–1075. doi: 10.1002/art.24436. [DOI] [PubMed] [Google Scholar]
- 14.Pan W, Zhu S, Yuan M, et al. MicroRNA-21 and microRNA-148a contribute to DNA hypomethylation in lupus CD4+ T cells by directly and indirectly targeting DNA methyltransferase 1. J Immunol. 2010;184:6773–6781. doi: 10.4049/jimmunol.0904060. [DOI] [PubMed] [Google Scholar]
- 15.Dai Y, Huang YS, Tang M, et al. Microarray analysis of microRNA expression in peripheral blood cells of systemic lupus erythematosus patients. Lupus. 2007;16:939–946. doi: 10.1177/0961203307084158. [DOI] [PubMed] [Google Scholar]
- 16.Wang G, Tam LS, Li EK, et al. Serum and urinary cell-free MiR-146a and MiR-155 in patients with systemic lupus erythematosus. J Rheumatol. 2010;37:2516–2522. doi: 10.3899/jrheum.100308. [DOI] [PubMed] [Google Scholar]
- 17.Wang G, Tam LS, Kwan BC, et al. Expression of miR-146a and miR-155 in the urinary sediment of systemic lupus erythematosus. Clin Rheumatol. 2012;31:435–440. doi: 10.1007/s10067-011-1857-4. [DOI] [PubMed] [Google Scholar]
- 18.Te JL, Dozmorov IM, Guthridge JM, et al. Identification of unique microRNA signature associated with lupus nephritis. PLoS ONE. 2010;5:e10344. doi: 10.1371/journal.pone.0010344. [DOI] [PMC free article] [PubMed] [Google Scholar]
- 19.Dai Y, Sui W, Lan H, Yan Q, Huang H, Huang Y. Comprehensive analysis of microRNA expression patterns in renal biopsies of lupus nephritis patients. Rheumatol Int. 2009;29:749–754. doi: 10.1007/s00296-008-0758-6. [DOI] [PubMed] [Google Scholar]
- 20.Tan EM, Cohen AS, Fries JF, et al. The 1982 revised criteria for the classification of systemic lupus erythematosus. Arthritis Rheum. 1982;25:1271–1277. doi: 10.1002/art.1780251101. [DOI] [PubMed] [Google Scholar]
- 21.Chen C, Ridzon DA, Broomer AJ, et al. Real-time quantification of microRNAs by stem-loop RT–PCR. Nucleic Acids Res. 2005;33:e179. doi: 10.1093/nar/gni178. [DOI] [PMC free article] [PubMed] [Google Scholar]
- 22.Chen HC, Chen GH, Chen YH, et al. MicroRNA deregulation and pathway alterations in nasopharyngeal carcinoma. Br J Cancer. 2009;100:1002–1011. doi: 10.1038/sj.bjc.6604948. [DOI] [PMC free article] [PubMed] [Google Scholar]
- 23.Gregersen LH, Jacobsen AB, Frankel LB, Wen J, Krogh A, Lund AH. MicroRNA-145 targets YES and STAT1 in colon cancer cells. PLoS ONE. 2010;5:e8836. doi: 10.1371/journal.pone.0008836. [DOI] [PMC free article] [PubMed] [Google Scholar]
- 24.Wang Y, Lee AT, Ma JZ, et al. Profiling microRNA expression in hepatocellular carcinoma reveals microRNA-224 up-regulation and apoptosis inhibitor-5 as a microRNA-224-specific target. J Biol Chem. 2008;283:13205–13215. doi: 10.1074/jbc.M707629200. [DOI] [PubMed] [Google Scholar]
- 25.Jordan ET, Collins M, Terefe J, Ugozzoli L, Rubio T. Optimizing electroporation conditions in primary and other difficult-to-transfect cells. J Biomol Tech. 2008;19:328–334. [PMC free article] [PubMed] [Google Scholar]
- 26.Tewari M, Yu M, Ross B, Dean C, Giordano A, Rubin R. AAC-11, a novel cDNA that inhibits apoptosis after growth factor withdrawal. Cancer Res. 1997;57:4063–4069. [PubMed] [Google Scholar]
- 27.Dhir V, Singh AP, Aggarwal A, Naik S, Misra R. Increased T-lymphocyte apoptosis in lupus correlates with disease activity and may be responsible for reduced T-cell frequency: a cross-sectional and longitudinal study. Lupus. 2009;18:785–791. doi: 10.1177/0961203309103152. [DOI] [PubMed] [Google Scholar]
- 28.Rönnblom L, Alm GV, Eloranta ML. Type I interferon and lupus. Curr Opin Rheumatol. 2009;21:471–477. doi: 10.1097/BOR.0b013e32832e089e. [DOI] [PubMed] [Google Scholar]
- 29.Bennett L, Palucka AK, Arce E, et al. Interferon and granulopoiesis signatures in systemic lupus erythematosus blood. J Exp Med. 2003;197:711–723. doi: 10.1084/jem.20021553. [DOI] [PMC free article] [PubMed] [Google Scholar]
- 30.Baechler EC, Batliwalla FM, Karypis G, et al. Interferon-inducible gene expression signature in peripheral blood cells of patients with severe lupus. Proc Natl Acad Sci USA. 2003;100:2610–2615. doi: 10.1073/pnas.0337679100. [DOI] [PMC free article] [PubMed] [Google Scholar]
- 31.Bengtsson AA, Sturfelt G, Truedsson L, et al. Activation of type I interferon system in systemic lupus erythematosus correlates with disease activity but not with antiretroviral antibodies. Lupus. 2000;9:664–671. doi: 10.1191/096120300674499064. [DOI] [PubMed] [Google Scholar]
- 32.Karonitsch T, Feierl E, Steiner CW, et al. Activation of the interferon-gamma signaling pathway in systemic lupus erythematosus peripheral blood mononuclear cells. Arthritis Rheum. 2009;60:1463–1471. doi: 10.1002/art.24449. [DOI] [PubMed] [Google Scholar]
- 33.Kawasaki M, Fujishiro M, Yamaguchi A, et al. Possible role of the JAK/STAT pathways in the regulation of T cell-interferon related genes in systemic lupus erythematosus. Lupus. 2011;20:1231–1239. doi: 10.1177/0961203311409963. [DOI] [PubMed] [Google Scholar]
- 34.Dong J, Wang QX, Zhou CY, Ma XF, Zhang YC. Activation of the STAT1 signalling pathway in lupus nephritis in MRL/lpr mice. Lupus. 2007;16:101–109. doi: 10.1177/0961203306075383. [DOI] [PubMed] [Google Scholar]
- 35.Martinez-Lostao L, Ordi-Ros J, Balada E, et al. Activation of the signal transducer and activator of transcription-1 in diffuse proliferative lupus nephritis. Lupus. 2007;16:483–488. doi: 10.1177/0961203307079618. [DOI] [PubMed] [Google Scholar]
- 36.Wang S, Yang N, Zhang L, et al. STAT signaling is involved in the inflammatory infiltration of the kidneys in MRL/lpr mice. Lupus. 2010;19:1171–1180. doi: 10.1177/0961203310367660. [DOI] [PubMed] [Google Scholar]
- 37.Gianfrancesco F, Esposito T, Ciccodicola A, et al. Molecular cloning and fine mapping of API5L1, a novel human gene strongly related to an antiapoptotic gene. Cytogenet Cell Genet. 1999;84:164–166. doi: 10.1159/000015247. [DOI] [PubMed] [Google Scholar]
- 38.Emlen W, Niebur J, Kadera R. Accelerated in vitro apoptosis of lymphocytes from patients with systemic lupus erythematosus. J Immunol. 1994;152:3685–3692. [PubMed] [Google Scholar]
- 39.Bengtsson AA, Sturfelt G, Gullstrand B, Truedsson L. Induction of apoptosis in monocytes and lymphocytes by serum from patients with systemic lupus erythematosus – an additional mechanism to increased autoantigen load? Clin Exp Immunol. 2004;135:535–543. doi: 10.1111/j.1365-2249.2003.02386.x. [DOI] [PMC free article] [PubMed] [Google Scholar]
- 40.Dai R, Zhang Y, Khan D, et al. Identification of a common lupus disease-associated microRNA expression pattern in three different murine models of lupus. PLoS ONE. 2010;5:e14302. doi: 10.1371/journal.pone.0014302. [DOI] [PMC free article] [PubMed] [Google Scholar]
- 41.Selbach M, Schwanhäusser B, Thierfelder N, Fang Z, Khanin R, Rajewsky N. Widespread changes in protein synthesis induced by microRNAs. Nature. 2008;455:58–63. doi: 10.1038/nature07228. [DOI] [PubMed] [Google Scholar]