

Abstract
National Institute of Clinical Excellence (NICE) and European Society for Paediatric Gastroenterology, Hepatology and Nutrition (ESPGHAN) guidance for the diagnosis of coeliac disease has been published. However, there is some controversy regarding the advice on the use of stratifying levels of immunoglobulin (IgA) tissue transglutaminase antibody (TG2) test positivity in the absence of test standardization and the vagueness of the indication to test equivocal samples. Using repeat service audit, we demonstrate that a combination of TG2 followed by IgA endomysial antibodies (EMA) is the best strategy for all degrees of mucosal abnormality using our test combination. Reliance upon immunoassay titre is not as effective, and cannot be applied consistently across populations in the absence of assay standardization. Guidelines advocating the use of tests should involve experts in laboratory diagnostics and external quality assurance to ensure that errors of generalization do not occur and that test performance is achievable in routine diagnostic use.
Keywords: biopsy, coeliac disease, endomysial antibodies (EMA), guidelines, tissue transglutaminase (TG2)
Introduction
National Institute of Clinical Excellence (NICE) guidance CG36 has been produced for the diagnosis of coeliac disease in the United Kingdom [1] and the European Society for Paediatric Gastroenterology, Hepatology and Nutrition (ESPGHAN) have produced guidance for diagnosis in paediatric practice [2]. Both suggest different strategies for coeliac screening. We therefore re-audited the performance of all the gating strategies suggested using data collected over the years 2008–09. We compared this to the results from the same laboratory reported in 2004–06 [3].
This was performed in order to:
determine if our results were reproducible;
determine if the performance of the tests was stable across time and across reagent batches;
test the unverified hypothesis in the NICE and ESPGHAN guidance that ‘equivocal’ immunoglobulin (Ig)A tissue transglutaminase (TG2) results (undefined within NICE and less than 3× upper limit of normal (ULN) in ESPGHAN) could be used as a criterion for determining the need for further IgA endomysial (EMA) testing [1,4]; and
determine the relative performance of each strategy for detecting lesser degrees of mucosal abnormality, where TG2 assays are reputed to have a slight advantage [4–6].
Methods
A retrospective review of the clinical diagnosis, biopsy and test results in patients referred for endoscopic biopsy across the 13-month period April 2008–May 2009 was performed and compared to a published study on the same cohort covering 26 months (January 2004–April 2006) [3]. Biopsy and serology was performed on 1475 adult patients; 473 patients were excluded, as only one of the serological results was available (47 TG2 only; 425 EMA only). Fourteen of these patients with incomplete serology were new cases of coeliac disease that could not be included in our final data set. Thirteen had EMA tested and were all positive; one had TG2 which was > 300 U/ml. A further 187 patients were excluded, as the tests were not performed within 12 weeks of the biopsy and therefore a direct link between concurrent serology and biopsy could not be established. Fifty-nine patients were being monitored for pre-existing coeliac disease and were removed from the audit. All new patients who had been tested for TG2 plus EMA and duodenal biopsy performed were included in the audit (756 patients). The decision to biopsy was made on clinical grounds and the results represent the screening performance of the tests in a hospital endoscopy referral service in the United Kingdom and replicated the cohort reported previously [3]. They do not represent the performance in unselected population screening.
Where samples were not taken on the same day as the biopsy, results were stratified according to the time-periods between biopsy and blood test, as follows: within 2 weeks of the biopsy (before or after), within 6 weeks of the biopsy and within 12 weeks of the biopsy. These were analysed to determine if there was any difference in pickup rates due to fluctuating serological positivity. No difference was seen and the final serological data set was established using any serology performed up to 12 weeks prior to biopsy until 6 weeks after biopsy.
Statistical analysis
Contingency tables were generated for each testing strategy for Marsh grades 1–3, 1–2 and 3. Sensitivity, specificity and positive predictive value (PPV) between testing strategies were compared by χ2 analysis.
Serological assays
All assays were performed as part of routine diagnostic evaluation. TG2 antibodies were analysed using an enzyme-linked immunosorbent assay (ELISA) (Aeskulisa; Aesku Diagnostic, Wendelsheim, Germany). Results were interpreted as: negative < 15 U/ml, equivocal 15–50 U/ml or positive > 50 U/ml. All units are arbitrary and assay-specific; there is no international standard to ensure comparability between assays. Two levels of internal quality control material (IQC) with equivocal and positive results and kit controls are assayed on each run to assess the validity of the results.
IgA EMA was assessed by indirect immunofluorescence on monkey oesophagus tissue (The Binding Site, Birmingham, UK). EMA results were interpreted as negative, weak positive, positive or strong positive. A weak positive and negative EMA internal quality control materials and regular review of consistency of reading thresholds are used to maintain stable reporting practices and assay sensitivity over time.
The laboratory participates in national and regional external audit and quality assurance (EQA) schemes [UK National External Quality Assessment Service (NEQAS), North of England Clinical Immunology Audit Group (NECIAG) and Northern Autoimmunity External Quality Assurance Group (NAEQAG)] for both TG2 and EMA with good performance.
Histology
Histology reports were reported routinely via the diagnostic histopathology service.
Changes indicative of intraepithelial lymphocytes or villous atrophy had been graded according to the Marsh criteria. Marsh grades 1–2 are generally accepted as coeliac disease only in the presence of positive serology, the correct human leucocyte antigen (HLA) type (DQ2 or DQ8) and the subsequent clinical and histological improvement on a gluten-free diet [5–9]. Therefore, the data were split to compare grades 1–2, grades 1–3 and grade 3 results versus serology for comparison. All patients were on a gluten-containing diet at the time of biopsy and sampling.
Results
Positive and negative predictive values, sensitivity and specificity were calculated from the data set. A total of 756 patients fitted into our selection criteria. Of these, 23 had Marsh grade 3 biopsy (3·04% of all samples). This is similar to the prevalence of 3·9% in the Sheffield cohort reported by Hopper et al. [3]. Marsh grades 1–3 lesions were found in 30 of 756 cases (3·97% of all samples). Where the final clinical diagnosis was unclear (e.g. negative serology but positive biopsy, 25 cases) the case-notes were reviewed by colleagues from the Gastroenterology Department (IA/DS) to determine the probable clinical diagnosis.
Upon investigation, we confirmed that three patients were seronegative for both EMA and TG2. IgA deficiency was excluded in all these patients. Two had a Marsh grade 3 biopsy, one was Marsh grade 1. All three had a final diagnosis of coeliac disease. The patient with grade 1 biopsy was diagnosed on the basis of clinical presentation and both clinical and histological improvement on gluten-free diet.
Performance characteristics of different screening strategies
Strategy 1: TG2 testing alone
The results are similar to those produced by the Hopper study (Table 1); 12·96% (98 of 756) were TG2-positive. When an equivocal range (15–50 U/ml, 1–3·3× ULN) was applied, 38 (5·03%) were positive and 60 equivocal (7·93%). The results apply to this assay and are not necessarily representative of the performance of all TG2 assays; there are considerable differences between the calibration curves of different methods.
Table 1.
Summary of the different screening strategies that could be used for coeliac disease diagnosis
| Serological tests used to refer for biopsy | Sensitivity % (95% CI) | Specificity % (95% CI) | PPV % (95% CI) | NPV % (95% CI) | |
|---|---|---|---|---|---|
| Using biopsy as reference (Marsh 1–2 = positive) – Grade 3 omitted; 2008–9 data | TG2 only | 75 (35·6–95·5) | 90·1 (87·6–92·1) | 7·7 (3·2–16·6) | 99·7 (98·8–99·9) |
| EMA only | 42·9 (11·8–79·8) | 99·5 (98·5–99·8) | 42·9 (11·8–79·8) | 99·5 (98·5–99·8) | |
| NICE 2-step strategy | 57·1 (20·2–88·2) | 97·3 (95·7–98·3) | 16·7 (5·5–38·2) | 99·6 (98·7–99·9) | |
| Biopsy if positive for both TG2 and EMA | 42·9 (11·8–79·8) | 99·5 (98·5–99·8) | 42·9 (11·8–79·8) | 99·5 (98·5–99·8) | |
| Using biopsy as reference (any Marsh 1–3 = positive);2008–09 data | TG2 only | 87·1 (69·2–95·8) | 90·1 (97·6–92·1) | 27·3 (19·0–37·3) | 99·4 (98·3–99·8) |
| EMA only | 73·3 (53·8–87·0) | 99·5 (98·5–99·8) | 84·6 (64·3–95·0) | 98·9 (97·8–99·4) | |
| NICE 2-step strategy | 80·0 (60·9–91·6) | 97·3 (95·7–98·3) | 54·6 (39·0–69·3) | 99·2 (98·1–99·7) | |
| Biopsy if positive for both TG2 and EMA | 73·3 (53·8–87·0) | 99·5 (98·5–99·8) | 84·6 (64·3–95·0) | 98·9 (97·8–99·4) | |
| Using biopsy as reference (Marsh 3 only as positive);2008–09 data and 2004–06 data produced by Hopper et al. [11] | TG2 only (2008–09 data) | 87·5 (66·5–96·7) | 89·5 (87·0–91·6) | 21·4 (14·0–31·1) | 99·5 (98·6–99·9) |
| TG2 only (2004–06 data) | 90·9 (82·4–94·5) | 90·9 (89·5–92·1) | 28·6 (23·3–34·5) | 99·6 (99·2–99·8) | |
| EMA only (2008–09 data) | 82·6 (60·4–94·3) | 99·1 (98·0–99·6) | 73·1 (61·9–87·6) | 99·5 (98·5–99·8) | |
| EMA only (2004–06 data) | 87·0 (77·7–92·8) | 98·2 (97·4–98·6) | 66·3 (64·4–73·0) | 99·5 (99·0–99·7) | |
| NICE 2-step strategy (2008–09 data) | 87·0 (65·3–96·6) | 96·9 (95·3–98·0) | 46·5 (31·5–62·2) | 99·6 (98·7–99·9) | |
| NICE 2-step strategy (2004–06 data) | 92·2 (84·0–96·4) | 90·3 (88·9–91·6) | 27·6 (22·5–33·4) | 99·7 (99·3–99·8) | |
| Biopsy if positive for both TG2 and EMA (2008–09 data) | 82·6 (60·4–94·3) | 99·1 (98·0–99·6) | 73·1 (61·9–87·6) | 99·5 (98·5–99·8) | |
| Biopsy if positive for both TG2 and EMA (2004–06 data) | 85·7 (76·2–91·8) | 98·6 (98·0–99·0) | 71·7 (61·8–79·9) | 99·4 (99·4–99·0) | |
Sensitivity, specificity, negative predictive value (NPV) and positive predictive value (PPV) of the different screening strategies using the biopsy result as the gold standard. 95% confidence intervals (CI) shown in parenthesis. Results from this audit compared to data from Hopper et al. [3]. NICE: National Institute of Clinical Excellence; EMA: endomysial antibodies; TG2: transglutaminase 2.
Strategy 2: EMA testing alone
EMA alone remains one of the most effective strategies (Table 1). It showed a positivity rate of 3·44% (26 of 756). The PPV of EMA remains significantly higher than that of the TG2 assay for Marsh grade 3 biopsies (73·1% versus 21·43%; P < 0·0001) (significance is defined as P < 0·05), with sensitivity being not statistically different to that of the TG2 assay in this cohort (P > 0·6). The EMA test remains more specific than the TG2 assay for grade 3 lesions (99·1% versus 89·5%; P < 0·0001). There were five false negative EMA (excluding seronegative patients) (biopsy grades 1–3) assays in this cohort, with three in the equivocal range (1 grade 3; 2 grades 1–2).
Strategy 3: NICE CG86 two-step strategy: EMA if ‘TG2 equivocal’
Data were analysed using the two-step strategy suggested by NICE (Table 1); i.e. biopsy to be performed if TG2 is positive (> 50 U/ml), or if TG2 is ‘equivocal’ (15–50 U/ml) in the presence of a positive EMA. We confirm that this strategy has an improved specificity compared to TG2 testing alone (P < 0·0001). However, the PPV is inferior to EMA testing, 47% versus 73% (P < 0·03), but better than TG2 alone (21%) for grade 3 lesions (P < 0·0025). The PPV for all Marsh grades is worse than EMA alone (PPV 55% versus 85% for EMA, P < 0·01), or TG2 and EMA (strategy 4) (85%, P < 0·01) at all levels of positivity. However, it is an improvement on TG2 alone (27% (P < 0·001)].
Strategy 4: TG2 and EMA: biopsy if positive for both TG2 and EMA irrespective of titre
Hopper et al. [3] demonstrated that biopsy of those patients who were positive for both serological assays was the most cost-effective for the Sheffield cohort. This resolves two issues; (i) the use of an undefined ‘equivocal’ range for TG2 which will vary between laboratories and assays and (ii) a reduction in biopsy of patients with high but false positive TG2 results. Our data show that the PPV of this method is the same as the EMA assay (P = 1) (Table 1), as all EMA and biopsy positives were also TG2-positive in this cohort. The use of this strategy would not detect the five EMA false negative cases. All strategies will miss some cases, with most of these being at the lesser degrees of mucosal damage. It should, however, be noted that there were an additional 13 EMA positive cases which were excluded from the audit because they only had EMA testing, thus the audit probably overestimates the degree of false negativity for EMA. It is also the case that the confidence intervals for the performance of EMA alone and EMA plus TG2 and the NICE strategy are similar and much better than the others across the board.
Relationship between level of TG2 and Marsh grade or EMA result
Figure 1 shows that even at low titre positivity for TG2 the biopsy-positive cases are usually EMA-positive when using our assay combination. It is clearly a better strategy to classify all levels of TG2 greater than the cut-off as positive when considering secondary tests, rather than trying to gate using an ‘equivocal’ range or TG2 titres at arbitrary thresholds of 3× ULN or 10× ULN, as recommended by ESPGHAN [2]. There were very few biopsy-positive cases (five cases) with TG2 between the ranges of 51 and 250 U/ml. As expected with any immunoassay, correlation between TG2, EMA and biopsy appears to improve at the high-level TG2 range, with 70% (14 of 20) of TG2 > 300 U/ml being biopsy-positive patients and all having a positive EMA. The remaining 30% with TG2 > 300 U/ml were false positives, five having both negative EMA and negative biopsy, one having a weak positive EMA and negative biopsy. There were 54 false positive TG2 results in the equivocal range (15–50 U/ml) and 12 in the positive range of 51–300 U/ml, in addition to the five which were > 300 U/ml.
Fig. 1.
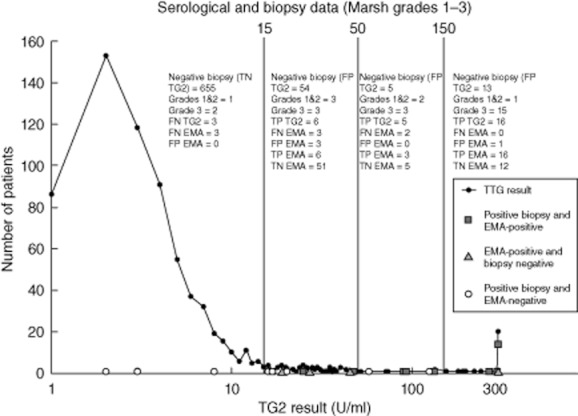
The number of biopsy-positive/endomysial antibodies (EMA)-negative (circles), biopsy-negative/EMA-positive (triangles) and biopsy-positive/EMA-positive (squares) results are plotted against the corresponding TG2 results. It shows that the predictive value of transglutaminase (TG2) increases with titre, as expected, with 61% (14 of 23) of the Marsh grade 3 cases being in the high titre region (>300 U/ml). Many patients with TG2 >300 U/ml are Marsh grade 3 biopsy and EMA-positive, but even at this level 30% are false positive results. The predictive value of TG2 for Marsh grades 1 and 2 lesions does not appear to be as strong as for Marsh grade 3, as more of the low-grade lesions have equivocal TG2 results. We observed false negative EMA results in the equivocal TG2 ranges. Correlation of positive EMA and biopsy was 93% (14 of 15) at TG2 > 300 U/ml. TP: true positive; TN: true negative; FP: false positive; FN: false negative.
For our TG2 assay there was no apparent threshold for employing EMA as a confirmatory test that would improve the performance of the TG2 assay, as there are some false positives even at high titres (Fig. 1). The best strategy for detecting lesser degrees of mucosal abnormality remains endomysial alone or TG2 (any level of positivity) followed by EMA.
Eight patients were biopsy-positive (Fig. 1) but EMA-negative. Three of eight had confirmed TG2 seronegative coeliac disease. Of the other five, three had borderline positive TG2 (2 grades 1–2, 1 grade 3 biopsy) and two were in the range of 3·3–10× ULN (one grade 1, one grade 3 biopsy). HLA-DQ testing would allow us to focus on these cases and avoid biopsy if applied to patients seronegative but yet still thought at risk of coeliac disease. Four patients were biopsy-negative despite double-positive serology in the low to moderate TG2 ranges. Most clinicians would suspect a false negative biopsy in these cases and would keep the patient under review. Thus, conclusions about the relative performance of the assay in the equivocal range should be tempered by this uncertainty.
All strategies involve a balance between false positivity and false negativity, i.e. if as many cases as possible are detected use TG2 plus EMA (increased false positivity), or if one is prepared to forego earliest detection of a few cases with predominantly lesser degrees of mucosal abnormality and wait for symptoms to appear use EMA alone (increased false negativity) (Table 2). If avoiding biopsy is wished, a different strategy is required 10.
Table 2.
Outcomes of each screening strategy
| Screening threshold for biopsy positivity Any grades 1–3 (756 biopsied; 30 cases of coeliac disease) | ‘Unnecessary’ biopsy (false positive) | Missed cases (false negatives) |
|---|---|---|
| TG2 alone (all positivity) | 72 | 3 (confirmed seronegative) |
| TG2 alone (>10 × ULN) | 12 | 3 (confirmed seronegative) |
| TG2 alone (>3·3 × ULN) | 17 | 3 (confirmed seronegative) |
| EMA alone | 4 | 8 (3 confirmed seronegative) |
| NICE (TG2 alone if positive and EMA if TG2 equivocal ≤3·3 × ULN) | 20 | 6 (3 confirmed seronegative) |
| TG2 then EMA for all levels of positive TG2 | 4 | 8 (3 confirmed seronegative) |
| TG2 1·1–10 × ULN biopsied and avoid biopsy if EMA-positive and >10 × ULN TG2 (ESPHGAN scheme for symptomatic patients) | 60 | 3 (3 confirmed seronegative) |
| TG2>3 × ULN biopsied and conduct EMA on those 1·1–3 × ULN (confirm with biopsy if EMA-positive) (ESPHGAN scheme for asymptomatic relatives) | 22 (3 in 1·1–3 × ULN group) | 7 (3 confirmed seronegative) |
The number of cases which underwent an ‘unnecessary’ biopsy and those who were ‘missed’ as a result of false negative serology in our cohort. Transglutaminase 2 (TG2) testing alone (all positivity) gave the highest number of false positive results but also missed the fewest cases (all three confirmed as seronegative). Using a strategy of endomysial antibodies (EMA) alone or TG2 and EMA gave the least number of patients going for unnecessary biopsy, but eight patients appeared as false negatives (three confirmed doubly seronegative); it should, however, be remembered that there were four additional biopsy-negative and serology-positive patients who most clinicians would consider very likely to have coeliac and would repeat or monitor long-term, and that 14 EMA-positive cases were excluded from analysis because they did not have a TG2 result recorded. If following National Institute of Clinical Excellence (NICE) or European Society for Paediatric Gastroenterology, Hepatology and Nutrition (ESPGHAN) guidance, all suspected coeliac cases should be followed-up by biopsy even if serology is negative [including immunoglobulin (IgG) TG2 and IgG EMA] in order to avoid ‘missing’ seronegative patients [1–3]. ULN: upper limit of normal.
Those with negative serology should still need to be recognized on the basis of clinical presentation with or without HLA-DQ typing and referred for biopsy regardless [11]. False negatives remain a problem for all serological screening strategies that wish to avoid biopsying everyone; however, HLA-DQ testing after negative serology with appropriate indicators for further testing offers the tantalizing prospect of minimizing these. Four cases had positive TG2 and EMA but were biopsy-negative (one with TG2 >300U/ml); they may represent false negative biopsy or may be considered at high risk for future disease. They were as common in this cohort as truly seronegative cases. It also shows that the predictive value of high TG2 is not as high as might be hoped in this assay and cohort and that truly seronegative cases for both EMA and TG2 remain a minority problem with both assays.
In this cohort, 11 of 27 (41%) of TG2-positive confirmed coeliac cases had TG2 < 10× ULN. ESPGHAN recommend that all patients with positive TG2 <10× ULN go on to biopsy without EMA or HLA testing, therefore many more unnecessary biopsies would have been performed. It is likely to be more cost-effective and less invasive for the patient to have confirmatory secondary testing at all positive levels prior to biopsy to overcome the problem of false positive TG2 results.
Discussion
We demonstrate the relative performance of various suggested testing strategies on a predominantly adult cohort of greater than 750 patients referred for assessment for coeliac disease. We show that the predictive values of the test strategy remained stable over time [3]. NICE guidance will work for all TG2 assays only if EMA is used routinely as a staged screening test. The definition of equivocality and the problem that different non-standardized TG2 assays will have different dose–response curves has not been addressed. In the absence of standardization, any focus on the level of positivity will work only if laboratories reference their interpretation threshold to locally derived audit data, as shown here.
In our cohort, the EMA assay becomes less sensitive in low-titre TG2 cases, as expected. Thus the EMA needs to be supplemented with biopsy or HLA-DQ2/DQ8 typing if there remains a suspicion of coeliac disease, despite negative serology, to sweep up the seronegative cases and the lesser degrees of mucosal abnormality.
The problem with all screening strategies is false negativity in a small number of patients. The corollary is that TG2 strategies result in false positivity far in excess of the size of the false negative cohort, even when confirmatory testing is applied to the lesser degrees of TG2 titres. False positivity is not only seen in our cohort, but is well documented in the literature [3,6,12–24]. In the absence of standardization between assays there is no possibility of selecting a single threshold recommendation for reflex second-test use, which is applicable to all test variants. All testing strategies assessed using our test combination will have a small number of false negatives and false positives unless everyone is biopsied. Application of HLA testing, as suggested in ESPGHAN guidance, offers the tantalizing prospect of detecting those still at risk [2]. However, it remains to be seen if one can improve upon the performance of the serology alone in avoiding biopsy and if this would be a cost-effective approach.
We have shown that the best strategy for selecting patients to avoid unnecessary biopsy using our assays in our cohort is to use TG2 plus EMA testing on all patients. Maximal sensitivity is always provided by the least specific test, but only at the cost of up to fourfold higher biopsy rates. This study demonstrates that there are considerable efficiency gains in applying EMA testing to all levels of TG2 positivity because false-positivity with strong TG2 titres are more common than is generally realized. In the high-titre TG2 cases in this cohort the EMA is a fully reliable discriminator to avoid biopsy.
There is inappropriate focus in the guidelines on the size of the apparent signal rather than positivity or negativity at a threshold. There is much confusion about the significance of high, moderate and equivocal signals and an assumption that all assays are equivalent [1,4,21,22]. All TG2 assays are not equivalent [12–14,21,23,24]. They have different dose–response curves and different performance in EQA with individual samples [9,21,24–26]. Although attempts to compensate for this have been proposed by adopting cut-offs based on multiples of the upper limit of normal, this is entirely inappropriate without local evaluation of the most appropriate threshold. The measurement of complex mixtures of antibodies introduces biological variability in performance between immunoassays which can only be compensated for by developing local thresholds for the screened population and re-auditing over time.
Our results apply to our assay combination in our cohort. We must be cautious about extrapolating the conclusions to other cohorts and other assays using different TG2 substrates. However, the performance characteristics are similar to most other published studies of TG2 assays.
It is well recognized among laboratory practitioners that there are major differences between assay performance which are not revealed by published paper data and EQA schemes. EQA alone cannot evaluate local diagnostic performance, but can detect method-related changes, quality issues and major differences between methods. Review of the EQA data for EMA and TG2 tests from all manufacturers over the last 2 years demonstrate probable biological variation in responses in different assays for individual patient materials [10,26]. There is, however, no obvious advantage in terms of ease of quality control or quality assurance of one test over another when qualitative responses are compared.
The results validate the use of a two-stage strategy or the use of EMA alone, but do not support the NICE strategy of TG2 positivity as essentially a single screening test without a defined and standardized definition of what constitutes an ‘equivocal’ test requiring EMA, or the ESPGHAN strategy of stratifying the intensity of TG2 signals for biopsy avoidance.
Guidelines should incorporate appropriate input from EQA providers to ensure that recommendations about testing are valid and achievable. NICE guidance should be revisited at the earliest opportunity to modify the suggestion that equivocality in an enzyme immunoassay can be utilized as a surrogate for the decision to use EMA testing. ESPGHAN guidance should be clarified to ensure that inappropriate use of multiple ULN thresholds are not utilized and that local evaluation of performance is mandatory. No UK coeliac screening programme should operate without annual audit and establishment of the most appropriate local threshold. Laboratories should also evaluate the most cost-effective testing strategy in collaboration with their clinical services.
Disclosures
No grants, financial support or research funding have been received for this study.
References
- 1.National Institute of Clinical Excellence (NICE) guideline 86. Coeliac disease: recognition and assessment of coeliac disease. Manchester, UK: NICE; 2009. [PubMed] [Google Scholar]
- 2.Husby S, Koletzko S, Korponay-Szabo IR, et al. European Society for Pediatric Gastroenterology, Hepatology, and Nutrition guidelines for the diagnosis of coeliac disease. J Pediatr Gastroenterol Nutr. 2012;54:136–160. doi: 10.1097/MPG.0b013e31821a23d0. [DOI] [PubMed] [Google Scholar]
- 3.Hopper AD, Hadjivassiliou M, Hurlstone DP, et al. What is the role of serologic testing in celiac disease? A prospective, biopsy-confirmed study with economic analysis. Clin Gastroenterol Hepatol. 2008;6:314–320. doi: 10.1016/j.cgh.2007.12.008. [DOI] [PubMed] [Google Scholar]
- 4.West J, Lloyd CA, Hill PG, et al. IgA-antitissue transglutaminase: validation of a commercial assay for diagnosing coeliac disease. Clin Lab. 2002;48:241–246. [PubMed] [Google Scholar]
- 5.Hopper AD, Cross SS, Hurlstone DP, et al. Pre-endoscopy serological testing for coeliac disease: evaluation of a clinical decision tool. BMJ. 2007;334:729–734. doi: 10.1136/bmj.39133.668681.BE. [DOI] [PMC free article] [PubMed] [Google Scholar]
- 6.Evans KE, Sanders DS. What is the use of biopsy and antibodies in coeliac disease diagnosis? J Intern Med. 2011;269:572–581. doi: 10.1111/j.1365-2796.2011.02380.x. [DOI] [PubMed] [Google Scholar]
- 7.Walker MM, Talley NJ. Clinical value of duodenal biopsies – beyond the diagnosis of coeliac disease. Pathol Res Pract. 2011;207:538–544. doi: 10.1016/j.prp.2011.08.001. [DOI] [PubMed] [Google Scholar]
- 8.Aziz I, Evans KE, Hopper AD, et al. A prospective study into the aetiology of lymphocytic duodenosis. Aliment Pharm Ther. 2010;32:1392–1397. doi: 10.1111/j.1365-2036.2010.04477.x. [DOI] [PubMed] [Google Scholar]
- 9.Walker MM, Murray JA, Ronkainen J, et al. Detection of celiac disease and lymphocytic enteropathy by parallel serology and histopathology in a population-based study. Gastroenterology. 2010;139:112–119. doi: 10.1053/j.gastro.2010.04.007. [DOI] [PMC free article] [PubMed] [Google Scholar]
- 10.Egner W, Shrimpton A, Sargur R, et al. ESPGHAN guidance on coeliac disease 2012: multiples of the upper limit of normal for decision making do not harmonise assay performance across centres. J Pediatr Gastroenterol Nutr. 2003 doi: 10.1097/MPG.0b013e31826531f6. doi: 10.1097/MPG.0b013e31826531f6. [DOI] [PubMed] [Google Scholar]
- 11.Green PH, Jabri B. Coeliac disease. Lancet. 2012;362:383–391. doi: 10.1016/S0140-6736(03)14027-5. [DOI] [PubMed] [Google Scholar]
- 12.Lo Iacono O, Petta S, Venezia G, et al. Anti-tissue transglutaminase antibodies in patients with abnormal liver tests: is it always coeliac disease? Am J Gastroenterol. 2005;100:2472–2477. doi: 10.1111/j.1572-0241.2005.00244.x. [DOI] [PubMed] [Google Scholar]
- 13.Reeves GE, Squance ML, Duggan AE, et al. Diagnostic accuracy of coeliac serological tests: a prospective study. Eur J Gastroenterol Hepatol. 2006;18:493–501. doi: 10.1097/00042737-200605000-00006. [DOI] [PubMed] [Google Scholar]
- 14.Sweis R, Pee L, Smith-Laing G. Discrepancies between histology and serology for the diagnosis of coeliac disease in a district general hospital: is this an unrecognised problem in other hospitals? Clin Med. 2009;9:346–348. doi: 10.7861/clinmedicine.9-4-346. [DOI] [PMC free article] [PubMed] [Google Scholar]
- 15.Hopper AD, Hadjivassiliou M, Butt S, et al. Adult coeliac disease. BMJ. 2007;335:558–562. doi: 10.1136/bmj.39316.442338.AD. [DOI] [PMC free article] [PubMed] [Google Scholar]
- 16.Feighery L, Collins C, Feighery C, et al. Anti-transglutaminase antibodies and the serological diagnosis of coeliac disease. Br J Biomed Sci. 2003;60:14–18. doi: 10.1080/09674845.2003.11783671. [DOI] [PubMed] [Google Scholar]
- 17.Evans KE, Malloy AR, Gorard DA. Changing patterns of coeliac serology requests. Aliment Pharmacol Ther. 2009;29:1137–1142. doi: 10.1111/j.1365-2036.2009.03982.x. [DOI] [PubMed] [Google Scholar]
- 18.Johnston SD, McMillan SA, Collins JS, et al. A comparison of antibodies to tissue transglutaminase with conventional serological tests in the diagnosis of coeliac disease. Eur J Gastroenterol Hepatol. 2003;15:1001–1004. doi: 10.1097/00042737-200309000-00010. [DOI] [PubMed] [Google Scholar]
- 19.Agreus L, Svardsudd K, Tibblin G, et al. Endomysium antibodies are superior to gliadin antibodies in screening for coeliac disease in patients presenting supposed functional gastrointestinal symptoms. Scand J Prim Health Care. 2000;18:105–110. doi: 10.1080/028134300750018990. [DOI] [PubMed] [Google Scholar]
- 20.Lock RJ, Stevens S, Pitcher MC, et al. Is immunoglobulin A anti-tissue transglutaminase antibody a reliable serological marker of coeliac disease? Eur J Gastroenterol Hepatol. 2004;16:467–470. doi: 10.1097/00042737-200405000-00005. [DOI] [PubMed] [Google Scholar]
- 21.Hill PG, Holmes GK. Coeliac disease: a biopsy is not always necessary for diagnosis. Aliment Pharmacol Ther. 2008;27:572–577. doi: 10.1111/j.1365-2036.2008.03609.x. [DOI] [PubMed] [Google Scholar]
- 22.Hill PG, Forsyth JM, Semeraro D, et al. IgA antibodies to human tissue transglutaminase: audit of routine practice confirms high diagnostic accuracy. Scand J Gastroenterol. 2004;39:1078–1082. doi: 10.1080/00365520410008051. [DOI] [PubMed] [Google Scholar]
- 23.Wong RC, Steele RH, Reeves GE, et al. Antibody and genetic testing in coeliac disease. Pathology. 2003;35:285–304. [PubMed] [Google Scholar]
- 24.Van Meensel B, Hiele M, Hoffman I, et al. Diagnostic accuracy of ten second-generation (human) tissue transglutaminase antibody assays in celiac disease. Clin Chem. 2004;50:2125–2135. doi: 10.1373/clinchem.2004.035832. [DOI] [PubMed] [Google Scholar]
- 25.Duncan AH, Peter G. A review of the quality of gastrointestinal investigations performed in UK laboratories. Ann Clin Biochem. 2007;44(Pt 2):145–158. doi: 10.1258/000456307780117911. [DOI] [PubMed] [Google Scholar]
- 26.Li M, Yu L, Tiberti C, et al. A report on the International Transglutaminase Autoantibody Workshop for Coeliac Disease. Am J Gastroenterol. 2009;104:154–163. doi: 10.1038/ajg.2008.8. [DOI] [PMC free article] [PubMed] [Google Scholar]