

Abstract
A conceptually novel mathematical model of neurogenic angiotensin II-salt hypertension is developed and analysed. The model consists of a lumped parameter circulatory model with two parallel vascular beds; two distinct control mechanisms for both natriuresis and arterial resistances can be implemented, resulting in four versions of the model. In contrast with the classical Guyton–Coleman model (GC model) of hypertension, in the standard version of our new model natriuresis is assumed to be independent of arterial pressure and instead driven solely by sodium intake; arterial resistances are driven by increased sympathetic nervous system activity in response to the elevated plasma angiotensin II and increased salt intake (AngII-salt). We compare the standard version of our new model against a simplified Guyton–Coleman model in which natriuresis is a function of arterial pressure via the pressure–natriuresis mechanism, and arterial resistances are controlled via the whole-body autoregulation mechanism. We show that the simplified GC model and the new model correctly predict haemodynamic and renal excretory responses to induced changes in angiotensin II and sodium inputs. Importantly, the new model reproduces the pressure–natriuresis relationship – the correlation between arterial pressure and sodium excretion – despite the assumption of pressure-independent natriuresis. These results show that our model provides a conceptually new alternative to Guyton's theory without contradicting observed haemodynamic changes or pressure–natriuresis relationships. Furthermore, the new model supports the view that hypertension need not necessarily have a renal aetiology and that long-term arterial pressure could be determined by sympathetic nervous system activity without involving the renal sympathetic nerves.
Key points
Causes of chronically-elevated arterial blood pressure (hypertension) are highly debated and difficult to study experimentally. Mathematical models can help elucidate potential causes of hypertension that are experimentally inaccessible.
All current models are based on one key assumption that long-term regulation of blood pressure depends on sodium excretion by the kidney. This assumption leads to the conclusion that hypertension must be caused by kidney dysfunction.
However, some experimental evidence suggests that kidney function can remain normal and that instead elevated neural activity to the vasculature causes hypertension.
We developed a mathematical model where sodium excretion is independent of blood pressure and neural activation to the vasculature triggers hypertension. Our model reproduces the solutions of earlier models, yet still shows the empirically well-established correlation between changes in sodium excretion and blood pressure.
Thus the model provides a novel platform for studying non-kidney based theories of hypertension aetiology.
Introduction
Chronic administration of angiotensin II (AngII) to experimental animals results in a sustained increase in arterial pressure, i.e. hypertension. One explanation for AngII-induced hypertension is that AngII stimulates sodium and water reabsorption by the kidney leading to increased blood volume; and arterial pressure rises as a direct or indirect consequence of the increased volume. This idea is supported by the fact that AngII-induced hypertension is proportional to the sodium chloride (salt) intake of the animal, i.e. AngII-induced hypertension is ‘salt sensitive’. High salt intake would augment AngII-induced hypertension by allowing a greater absolute amount of sodium chloride to be retained in response to AngII, resulting in a larger increase in blood volume and arterial pressure. This explanation obviously assigns a critical role in blood pressure regulation to mechanisms that control renal sodium excretion (natriuresis). The theory is supported by many studies in experimental animals and humans showing a strong association between arterial pressure and sodium excretion, usually described as the ‘pressure–natriuresis relationship’. Additional powerful support for the critical role of renal sodium excretion in determining arterial pressure is the universal finding that in hypertension the pressure–natriuresis relationship is shifted to higher pressure levels (i.e. sodium balance occurs at a higher than normal arterial pressure).
However, the underlying causes of the observed pressure–natriuresis relationship in intact animals or humans are still debated (Liard, 1979; Bie, 2009; Osborn et al. 2009). One proposed explanation is the ‘pressure–natriuresis mechanism’, by which even a small change in perfusion pressure of the kidney elicits a substantial change in renal sodium excretion, acutely and chronically (Guyton, 1980). The powerful impact of this direct effect of arterial pressure on sodium excretion is a core assumption of the well-known mathematical model of the circulation developed by Guyton and Coleman (the GC model) (Guyton et al. 1972; Guyton, 1990). In fact, in the model, hypertension is only possible when the pressure–natriuresis mechanism is shifted to higher pressure levels. Since the pressure–natriuresis mechanism is presumed to be an intrinsic property of the kidney, the model has encouraged the view that all hypertension ultimately has a renal aetiology (the so-called ‘renocentric’ theory). However, while the pressure–natriuresis mechanism is clearly capable of explaining the relationship between salt intake and hypertension, the mere observation of correlation between natriuresis and pressure does not imply a causal relationship.
In recent studies it was shown that when AngII is administered to rats on a high salt diet, the resulting hypertension (AngII–salt hypertension) is caused in part by increased sympathetic nervous system activity (SNA) (King & Fink, 2006; Osborn et al. 2007a, 2011; Osborn & Fink, 2010; Toney et al. 2010). This alone does not contradict the GC model concept since elevated sympathetic activity to the kidney can shift the pressure–natriuresis mechanism to higher pressures (Guyton, 1980). However, using direct continuous measurement of SNA in conscious rats it was found that renal SNA is not increased in AngII–salt hypertension; in fact, it is transiently decreased (Yoshimoto et al. 2010). Furthermore, bilateral renal denervation did not affect the development of AngII–salt hypertension (King et al. 2007), and hypertension was not associated with increased blood volume (King & Fink, 2006). Although it is possible that other unknown factors modify the pressure–natriuresis mechanism in AngII–salt hypertension, these results led us to ask the question: can hypertension be produced without the pressure–natriuresis mechanism?
Conventional experimental approaches provide many insights into the complexity of circulatory control mechanisms in hypertension. But as Guyton and many others have shown, mathematical modelling allows the development of an easily manipulated theoretical construct in which it is possible to study variables that cannot be measured in the intact circulation. Another important contribution of mathematical models is they generate novel hypotheses, which can then be experimentally tested. At the present time the only detailed mathematical model for long-term control of arterial pressure is the GC model. Since our new experimental findings appear to conflict with its requirement that an alteration in the pressure–natriuresis mechanism must initiate hypertension, our objective was to create a new mathematical model that assumes a fundamentally different mechanism for control of renal sodium excretion. This new formulation is based in part on the extensive work of Bie (Bie, 2009) and others (Luetscher et al. 1973; Reinhardt & Seeliger, 2000; Seeliger et al. 2004, 2005) that demonstrates powerful regulation of sodium excretion by factors linked to body sodium content but independent of changes in arterial pressure.
The mathematical description of our model is similar to the early GC model. It uses the same mathematical constructs to describe the circulatory system and bridges unknown or complex mechanistic relationships with functional descriptions based on experimentally observed phenomena. The key difference between the two models is the nature of the primary driver of sodium excretion: in the GC model sodium excretion is controlled exclusively by arterial pressure (all other controllers work by affecting the pressure–natriuresis mechanism), whereas in our model control of sodium excretion is independent of arterial pressure and is driven instead by the lumped function of all other known and hypothetical excretory mechanisms that operate in response to changes in sodium intake. We demonstrate that the association between arterial pressure and sodium excretion observed in AngII–salt hypertension can be reproduced without the assumption of the pressure–natriuresis mechanism.
Acceptance of the GC model as a valid mathematical description of the circulation also is based on the fact that it very accurately predicts haemodynamic responses to numerous physiological perturbations, including changes in salt intake and/or AngII administration (Guyton, 1980). These haemodynamic responses in the GC model are driven mainly by autoregulatory adjustments to vascular tone with relatively little contribution by neural factors. Our studies of AngII–salt hypertension in the rat demonstrated that although renal SNA was transiently decreased, lumbar (mainly muscle) SNA was maintained (Yoshimoto et al. 2010). Furthermore, splanchnic SNA seemed critical to AngII–salt hypertension since denervation of the splanchnic vascular bed attenuated hypertension development (King & Fink, 2006; King et al. 2007). Splanchnic denervation probably affects hypertension development by reducing sympathetically mediated changes in both splanchnic vascular resistance and capacitance (Osborn et al. 2011). Therefore, in our new model sympathetically driven changes in vascular function caused by AngII–salt contribute importantly to the haemodynamic changes predicted by the model.
Early versions of the GC model served only as conceptual support for the GC theory, while later expansions allowed it to be compared to experimental data (Guyton, 1980). Similarly, in this paper we present a simple conceptual model that lacks the fine details required for meaningful quantitative assessments such as comparisons with data, parameter fitting, or sensitivity analysis. Instead, the model is intended to qualitatively demonstrate that increased sympathetic activity could cause haemodynamic and renal excretory changes similar to those observed in AngII–salt hypertension without invoking the renocentric theory. Thus our model provides a platform for future models of non-renocentric theories of hypertension.
In simple terms, the aim of our modelling exercise is to demonstrate that one can reproduce both the hypertensive haemodynamic profile and pressure–natriuresis relationship under diametrically opposed assumptions in regard to the primary mechanism regulating sodium excretion. In one case (a GC model) the assumption is that sodium excretion is determined by the arterial pressure. In the other case (our model), the opposite assumption is used: that sodium output does not depend on the arterial pressure. In both cases, the models produce similar simulation results with respect to the haemodynamic profile and pressure–natriuresis relationship. Thus, we conclude that, from the modelling perspective, contrary to the widely held belief, the pressure–natriuresis mechanism, while sufficient, is not a necessary explanation for the pathogenesis of hypertension.
Methods
In experimental models of salt or volume loading hypertension (where increased blood pressure can be most directly linked to excess body fluid volumes), a specific pattern of changes in body fluid volume, arterial pressure, cardiac output and total peripheral resistance (haemodynamic profile) is usually observed (Fig. 1). There is controversy, however, about the specific mechanisms controlling renal sodium excretion and arterial resistance that can produce this hypertensive haemodynamic profile (Bie, 2009; Osborn et al. 2009). Here we consider two alternatives for each mechanism. Sodium excretion is modelled using either of two opposite assumptions: sodium excretion is exclusively a function of arterial pressure (the pressure–natriuresis mechanism) (SE1); or sodium excretion is independent of arterial pressure and is a function of sodium intake only (SE2). Arterial resistance is modelled using either a long-term ‘whole body autoregulation’ mechanism, as in the GC model (AR1), or a long-term sympathetic neural drive mechanism (AR2).
Figure 1. Experimental haemodynamic profile of AngII–salt hypertension in dogs (redrawn from Krieger et al. (1989)) similar to the volume-loading profile of hypertension.
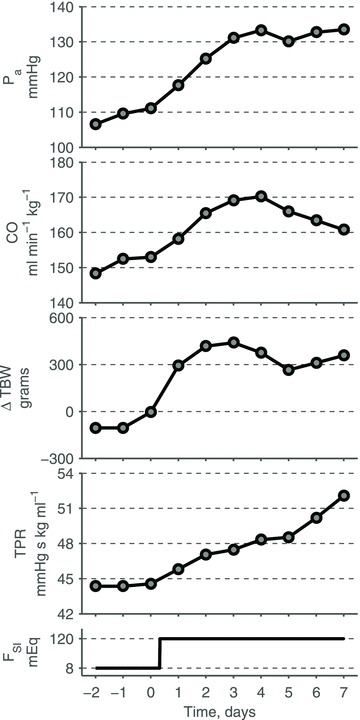
Average 24 h mean arterial pressure (Pa), cardiac output (CO), change in total body weights (TBW), and total peripheral resistance (TPR) in response to an increase in salt intake (FSI) on Day 0, while infusion of AngII is maintained at a subpressor dose (∼2.6 ng kg−1 min−1) throughout the entire experiment. Redrawn from Krieger et al. (1989) with permission from the American Physiological Society.
By combining one of the versions of each mechanism with a standard circulatory model, it is possible to obtain a mathematical representation of long-term control of arterial pressure (Table 1). Note that a combination of the SE1 and AR1 assumptions yields a simplified version of the GC model of long-term blood pressure control (Guyton et al. 1972). Here we show that a combination of the SE2 and AR2 assumptions yields a new mathematical model of long-term blood pressure control that is consistent with the simulations of the GC model and with experimental data.
Table 1.
Summary of models of long-term blood pressure control
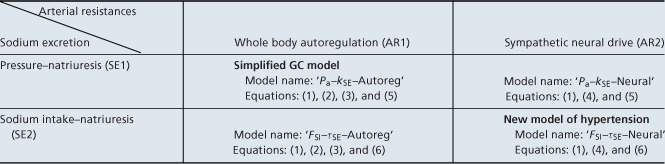 |
Each of the four models is based on the same representation of the circulatory subsystem (1) and combines two regulatory mechanisms: one for arterial resistances (AR1 or AR2) and one for sodium excretion (SE1 or SE2).
Circulatory subsystem
The model of the circulatory subsystem we employed is based on the lumped-parameter windkessel approach widely used in cardiovascular modelling. Such an approach is especially useful for studying the entire circulation as it combines moderate accuracy of system representation with the relatively small set of parameters that can be identified from experimental data. The lumped parameter models are used on both short time scales, such as the response to haemorrhage, baroreceptor stimulation, and postural change (Ursino et al. 1994; Ursino, 1998; Olufsen et al. 2005), and long time scales such as the GC model (Guyton et al. 1972).
In our model of the circulatory system, the total blood volume is distributed among four capacitive vascular compartments: the arteries, the veins of the splanchnic organs, the veins of extra-splanchnic organs, and the large veins (Fig. 2). The two compartments representing the systemic vascular beds are connected in parallel. One of these two compartments is assumed to have a higher compliance than the other. Since splanchnic organs have larger vascular compliance than other regions (Rothe, 1983), we call the former compartment ‘splanchnic’ and the latter ‘extra-splanchnic’. The pulmonary circulation is omitted and the heart is represented by a continuous non-pulsatile pump which moves blood from the venous to the arterial side of the systemic circulation. The flow generated by the pump is impeded by arterial and venous resistances located around each of the two parallel vascular bed compartments.
Figure 2. Representation of the circulatory subsystem.
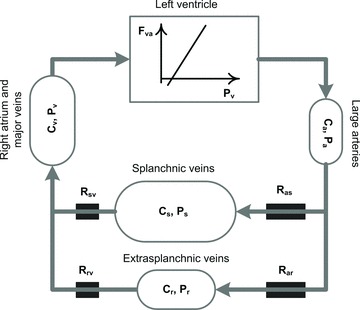
Total blood volume is distributed among four systemic vascular reservoirs: large arteries, splanchnic veins, extrasplachnic veins and right atrium. The pulmonary circulation is omitted. Blood is circulated via a cardiac pump modelled as a linear Frank–Starling relationship between filling pressure and cardiac output. P, pressures; R, hydraulic resistances; C, compliances; Fva, cardiac output; a, arterial; v, venous; s, splanchnic; r, extrasplanchnic.
Vascular compliances of each compartment can be assumed constant within the normal operating ranges of pressures (Shoukas & Sagawa, 1971), that is the pressure-volume curves for each compartment can be considered linear:
where Vj is the total blood volume contained in the jth compartment, Vj,U is the unstressed blood volume of the jth compartment (i.e. the amount of blood stored at zero pressure), Pj is the pressure within the jth compartment, and Cj is the compliance of the jth compartment. Subscripts a, s, r, and v indicate the arterial, splanchnic, extrasplanchnic, and venous compartments, respectively.
The flow (F) from the ith to jth compartment is driven by the difference of their pressures (P) and impeded by the resistance (R) between the compartments:
The only exception to the above is cardiac output, which is the flow from the venous to the arterial compartment (Fva) driven by the heart. According to the Frank–Starling law, cardiac output is a function of the filling pressure (Pv). This dependence can be well-approximated by a linear function within the normal operating range of arterial pressures (Grodins, 1959; Sagawa, 1967):
where RFS and p are parameters (see Table 2) with p < Pv.
Table 2.
Model parameters
| Name | Abbreviation | Value | Units |
|---|---|---|---|
| Arterial compliance | Ca | 3.55 | ml mmHg−1 |
| Extrasplanchnic venous compliance | Cr | 20 | ml mmHg−1 |
| Splanchnic venous compliance | Cs | 30 | ml mmHg−1 |
| Compliance of large veins and right atrium | Cv | 40 | ml mmHg−1 |
| Total unstressed blood volume | VU | 3500 | ml |
| X-intercept of Frank–Starling curve | p | 0 | mmHg |
| Inverse of the slope of Frank–Starling curve | RFS | 439 | ml min−1 mmHg−1 |
| Venous splanchnic resistance | Rsv | 0.002 | mmHg min ml−1 |
| Venous extrasplanchnic resistance | Rrv | 0.002 | mmHg min ml−1 |
| Total blood volume coefficient | kVT | 0.888 | ml mEq−1 |
| Autoregulatory gain | kAR | 5 | — |
| Gain of the neural drive | kN | 50 | ml min−1 |
| Coefficient of renal abnormality | kSE | 6.2 | |
| Time constant for autoregulation | τAR | 20 000 | min |
| Time constant for neural drive | τN | 4320 | min |
| Time constant for the sodium intake–natriuresis mechanism | τSE | 432 | min |
| Time constant for acute renal function slope | τRF | 120 | min |
Finally, changes in total body fluid volume are modelled based on assumptions similar to those used in the GC model (Guyton & Coleman, 1967). First, total blood volume (VT) is proportional to total body water, which is the net sum of total fluid intake and output. Second, due to osmotic effects, body fluid volume changes are proportional to changes in net sodium balance. Thus, changes in total blood volume are proportional to the net sum of sodium intake and excretion rates (Fig. 3):
Figure 3. Regulation of total blood volume (VT) via sodium excretion (FSE).
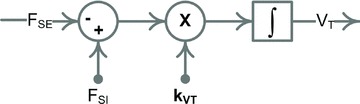
Block diagram representation of the total blood volume regulation (see eqn (1)).
where kVT is the product of the two proportionality coefficients in the assumptions above, FSI is the rate of sodium intake, and FSE is the rate of sodium excretion.
The change of volume in each compartment (dVj/dt) is equal to the difference of its total inflow and outflow. Since the total blood volume is distributed between all of the compartments, it can be written as the sum of their volumes. Thus the following four equations represent the circulatory model in Fig. 2:
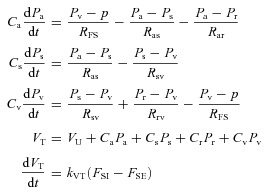 |
(1) |
where VU is the total unstressed volume: VU=Va,U+Vs,U+Vr,U+Vv,U. There are a total of twelve parameters in the circulatory model which determine pressures and volumes within the four compartments, as well as the flows between them. In particular these parameters determine arterial pressure, cardiac output and total peripheral resistance. Nine of these parameters, including all vascular compliances, venous resistances, total unstressed blood volume and cardiac function parameters (Table 2), will be set as constant throughout the paper. The remaining three parameters – sodium excretion (FSE) and two arterial resistances (Ras and Rar) – are assumed to vary via the regulatory mechanisms described below. Thus in the scope of the full model, which includes both the basic circulatory model and associated regulatory mechanisms, these last three parameters will be referred to as variables (see Block 1 in Figs 4 and 5).
Figure 4. Model ‘Pa–kSE–Autoreg’, the representation of a simplified GC model.
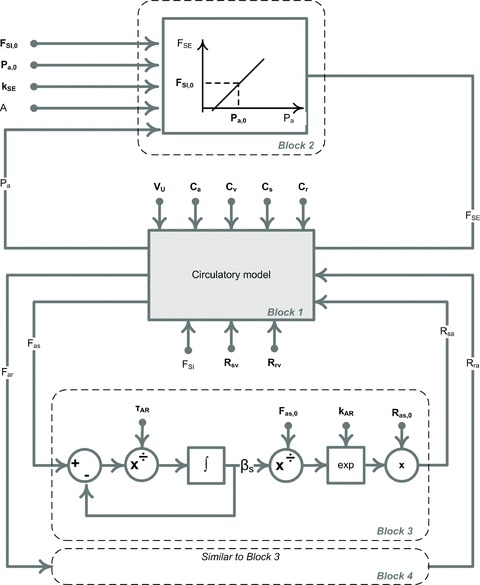
The block diagram representation of the mathematical model ‘Pa–kSE–Autoreg’ given by eqns (1), (2), (3) and (5). The circulatory subsystem (Block 1, see Fig. 2 and 3 for details) is paired with the two regulation mechanisms: sodium excretion is controlled by the arterial pressure via the renal function curve (Block 2) and arterial resistances are controlled via the long-term autoregulation mechanism (Block 3 and Block 4). Block 4 is similar to Block 3 and thus is not shown in detail. Parameters are shown in bold.
Figure 5. Model ‘FSI–τSE–Neural’, a new mathematical model with non-renocentric pathway of hypertension.
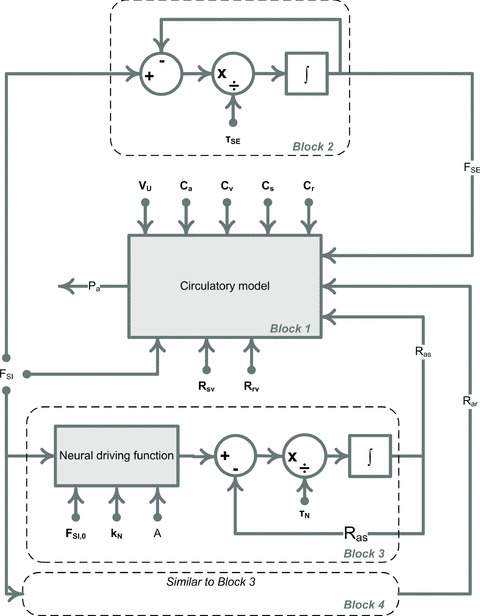
The block diagram representation of the mathematical model ‘FSI–τSE–Neural’ given by equations (1), (4) and (6). The circulatory subsystem (Block 1, see Fig. 2 and Fig. 3 for details) is paired with the two regulation mechanisms: sodium excretion is controlled by the sodium intake (Block 2) and arterial resistances are controlled via the long-term neural drive (Block 3 and Block 4). Block 4 is similar to Block 3 and thus is not shown in detail. The neural driving function is the right hand side of eqn (4), where j = ‘s’ and ‘r’ for Block 3 and 4, respectively. Parameters are shown in bold.
Regulation of arterial resistances
AR1: whole body autoregulation
The theory of long-term whole body autoregulation of blood flow states that overperfusion of tissues can initiate local vasoconstriction aimed at maintaining flow at levels driven by local metabolic demands (Coleman et al. 1971). We use the model proposed in (Guyton, 1980) (see Blocks 3 and 4 in Fig. 4):
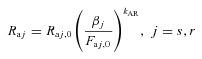 |
(2) |
where βj is the autoregulation multiplier such that
| (3) |
where τAR is the time constant of the autoregulation response, kAR is the autoregulatory gain, and Faj,0 is the level of flow required to address local metabolic demands. Note that subscript 0 refers to the initial (normal) value of a variable throughout the manuscript.
AR2: sympathetic neural drive
Sympathetic nerve activity has a large effect on vascular resistance: direct measurements show that arterial resistance changes in response to a wide range of physiological nerve firing rates (0–20 Hz) (Hottenstein & Kreulen, 1987). We have reported that in rats both AngII and high salt intake are required to induce elevated SNA, while either factor alone does not trigger a sympathetic response (King et al. 2008). Since we are attempting to model AngII–salt hypertension, here we assume that the long-term level of SNA is driven by a combination of increased sodium intake and circulating AngII. Moreover, based on our data from rats, we assume a time delay between the initiation of the AngII–salt stimulus and the SNA response. This phenomenon is readily recognized as a first-order response, which is common in biology and physics. Thus the response of arterial resistances to sodium and AngII can be represented as:
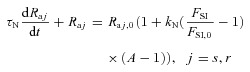 |
(4) |
where τN is the time constant of the neural regulation, Raj,0 is the normal value of the arterial resistance, kN is the gain of the resistance response, FSI,0 is the normal rate of sodium intake, and A is the ratio of the circulating level of AngII to its normal value (see Blocks 3 and 4 in Fig. 5).
Regulation of sodium excretion
SE1: pressure–natriuresis mechanism
The cornerstone of Guyton's mathematical theory of circulatory regulation is the pressure–natriuresis relationship (also described as the chronic ‘renal function curve’), whereby sodium excretion is described as a highly sensitive function of mean arterial pressure. According to this formulation, long-term changes in arterial pressure can occur only when the relationship is either rotated (i.e. change in slope) or shifted so that higher pressure values correspond to any given level of sodium excretion. As noted earlier, a key assumption of the Guyton theory is that the pressure–natriuresis relationship is an expression of the pressure–natriuresis mechanism, i.e. the ability of small changes in perfusion pressure to cause large changes in sodium excretion by the kidney. Guyton proposed that the steep chronic renal function curve is a result of a day-to-day rotation of the acute renal function curve due to progressive salt-loading (Guyton, 1980).
For our SE1 assumption we adopt a simplified representation of the chronic renal function curve that is consistent with the original GC hypothesis, i.e. that the pressure–natriuresis relationship is a consequence of the pressure–natriuresis mechanism. First, we assume that sodium excretion is controlled entirely by arterial pressure via the acute renal function curve. Second, we assume that the acute renal function curve is well-approximated by a linear function in the range of pressures generally used in simulations. Third, consistent with the GC description of the effect of chronic AngII infusion on the chronic renal function curve (Guyton, 1980), we assume that the slope of the acute renal function curve also depends on the circulating level of AngII. Thus the sodium excretion rate can be represented as follows:
| 5 |
where FSE,0 is the normal rate of sodium excretion and α is a coefficient determining the slope of the acute renal function curve. Finally, in order to obtain the chronic renal function curve, we assume that the slope of the acute renal function curve increases in response to salt loading:
where τRF is a time constant, and kSE is a coefficient of intrinsic renal abnormality. Thus equation (5) with variable slope α describes the long-term sodium excretion rate (FSE) (see Fig. 6). Note that the slope of the chronic renal function curve can be diminished by factors such as a relative increase in AngII input (A) or an intrinsic renal abnormality (kSE).
Figure 6. Rotation of pressure–natriuresis curves due to the elevated sodium intake and AngII level.
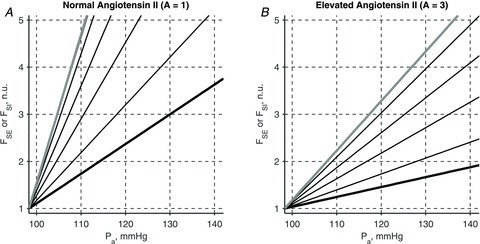
Evolution of an acute renal function curve with kSE = 6.2 (thick black line, A and B) into a chronic renal function curve (thick grey line, A and B) due to a 5-fold increase in sodium intake rate is shown in the presence of normal (A) and elevated (B) levels of circulating AngII. Thin black lines show successive changes in the acute renal curves 1, 6, 12, and 24 h post a step-wise increase in sodium intake. The chronic renal function curve has a nearly vertical slope for normal level of AngII (thick grey line, A). Thus 5-fold increase in sodium intake leads to only about 10 mmHg elevation in mean arterial pressure. If the circulating levels of AngII are elevated 3-fold, the chronic renal function curve has a smaller slope which reflects higher level of renal abnormality (thick grey line, B). A 5-fold increase in sodium intake then leads to over 30 mmHg elevation in mean arterial pressure. Sodium excretion rate is shown as a fraction of the normal sodium intake rate, FSI,0.
SE2: sodium intake–natriuresis mechanism
It is a well-established empirical fact that urinary sodium excretion is tightly regulated to match sodium intake under steady-state conditions, but critical gaps remain in our understanding of the mechanisms responsible (Bie, 2009). Although renal perfusion pressure (which is equivalent to mean arterial pressure in the normal intact circulation) is indisputably one very important factor influencing renal sodium excretion, a necessary link between mean arterial pressure and sodium excretion has been questioned (Seeliger et al. 2004; Bie, 2009). In particular, at steady-state, healthy kidneys are capable of excreting a wide range of sodium intakes with no measureable change in mean arterial pressure. Therefore, changes in arterial pressure do not appear to be required for regulating sodium excretion under normal physiological conditions. Taking these facts into account, under our assumption SE2 there is no causal relationship between sodium excretion and mean arterial pressure, i.e. there is no pressure–natriuresis mechanism. Instead, we model sodium excretion purely as a function of sodium intake (sodium intake–natriuresis mechanism); it is assumed that sodium excretion is mediated by other known (e.g. renal nerves, angiotensin II, aldosterone, atrial natriuretic peptide) and unknown physiological controllers of sodium excretion (Bie, 2009), although these are not included as part of the model. Since sodium excretion typically matches step changes in sodium intake only after a 1–2 day delay (Hollenberg 1982; Kaplan 1990), we model the relationship as a first-order response:
| (6) |
where τSE is the time constant. Figure 7 shows an example of the response of sodium excretion to a 5-fold step change in the sodium intake.
Figure 7. Sodium excretion rate response to a step increase in sodium intake rate.
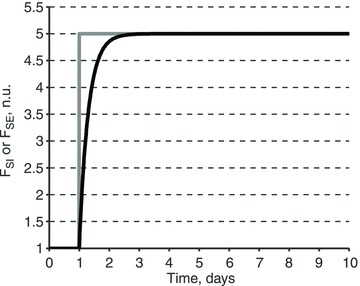
Sodium excretion rate (FSE, black) response to a 5-fold step increase in sodium intake rate (FSI, grey). The response is modelled as a first-order response with the time constant τSE = 0.3 days (see eqn (6)). Sodium rates are shown as a fraction of the normal sodium intake rate, FSI,0.
While there is no direct dependence of sodium excretion on mean arterial pressure in the model under the SE2 assumption, the two variables still belong to the same system; thus their values at each instant in time can be plotted against each other. The resulting plot then represents the typical pressure–natriuresis relationship that is obtained experimentally (Hall et al. 1980).
Models of long-term blood pressure control
A model of long-term blood pressure control can be obtained by pairing the basic circulatory model with different pairs of mechanisms for regulating sodium excretion and arterial resistances: for sodium excretion, either ‘Pa’ or ‘FSI’ for the pressure- or sodium intake–natriuresis mechanism, respectively; and one for arterial resistance ‘Neural’ or ‘Autoreg’ for a neurally mediated or autoregulatory resistance control, respectively. This results in four distinct models of long-term blood pressure control (Table 1): ‘FSI–τSE–Neural’, ‘FSI–τSE–Autoreg’, ‘Pa–kSE–Autoreg’ and ‘Pa–kSE–Neural’, where τSE and kSE are sodium excretion parameters varied in simulations below. Model ‘Pa–kSE–Autoreg’ is a representation of the early GC model (Guyton & Coleman, 1967). The ‘FSI–τSE–Neural’ model is built on quite different assumptions, but is, as we show below, capable of replicating solutions of the GC model and the pressure–natriuresis relationship. The remaining two models allow a comparison of the relative contribution of resistance control mechanisms to long-term blood pressure control.
Parameters and simulations
Values of the model parameters (Table 2) and initial values of the model variables (Table 3) have been taken from the physiological and modelling literature (Caldini et al. 1974; Guyton, 1980; Ursino, 1998; Karaaslan et al. 2005). Given that there is an uncertainty range associated with every value, we have chosen those values which best demonstrate qualitative features of the models. All initial values of the variables are chosen so that the model is in steady-state at time t = 0. The model equations were solved using the ODE15s routine of Matlab 7.12.0 (The Mathworks Inc; Natick, MA, USA). The model code can be found in Supplemental Material.
Table 3.
Model variables and their initial values
| Name | Abbreviation | Initial Value | Units |
|---|---|---|---|
| Arterial pressure | Pa | 98.302 | mmHg |
| Splanchnic pressure | Ps | 16.0314 | mmHg |
| Venous pressure | Pv | 10.1549 | mmHg |
| Arterial splanchnic resistance | Ras | 0.028 | mmHg min ml−1 |
| Arterial extrasplanchnic resistance | Rar | 0.056 | mmHg min ml−1 |
| Total blood volume | VT | 5000 | ml |
| Autoregulatory multiplier for splanchnic arterial resistance | βs | 2938.2 | ml min−1 |
| Autoregulatory multiplier for extrasplanchnic arterial resistance | βr | 1519.8 | ml min−1 |
| Sodium intake rate | FSI | 0.126 | mEq min−1 |
| Sodium excretion rate | FSE | 0.126 | mEq min−1 |
| Acute renal function slope | α | 6.2 | — |
| Angiotensin II input ratio | A | 1 | — |
Results
Inputs
In all simulations it is assumed that on Day 0 sodium intake is at a ‘normal’ level, AngII input is absent, and all system variables are at their steady-state values (Table 3). On Day 1, sodium intake is instantaneously increased 5-fold and/or AngII input is increased 3-fold above the normal endogenous level of AngII. The elevated levels are maintained until the end of the simulation, i.e. Day 10 (Fig. 8).
Figure 8. Inputs to simulations.
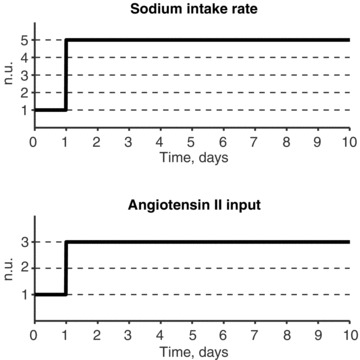
Sodium intake rate is normal on Day 0 and then increased 5-fold on Day 1, AngII input is given on Day 1 at a 3-fold normal endogenous level. Both inputs are maintained at their elevated levels throughout the protocol (Day 1 to Day 10). In some simulations only sodium intake rate is increased.
Representation of the results
Results of each simulation are reported in the following way. The haemodynamic response of the model's variables to given inputs is shown in panel A of Figures 9–11. The haemodynamic response consists of changes in arterial pressure, cardiac output, total blood volume and total peripheral resistance. Individual arterial resistance components also are included in the haemodynamic profile. The inputs to the model (sodium intake and AngII input) are shown at the bottom of panel A.
Figure 9. Effect of different regulation mechanisms on the system's response to the elevated sodium intake and AngII input.
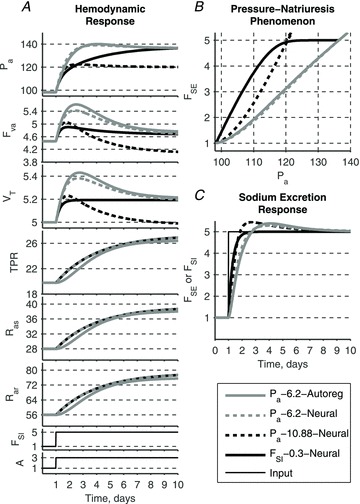
All models produce a similar haemodynamic profile and pressure–natriuresis phenomenon whether renal function and long-term autoregulation mechanisms are included or not. Neurally driven resistance responses in three of the four models (TPR, Ras and Rar; all but continuous grey curves) overlap.
Figure 11. Effect of varying time constant τSE of the sodium intake–natriuresis mechanism on the system's response to the elevated sodium intake and AngII input.
Neurally driven resistance responses are independent of renal control and thus TPR, Ras and Rar remain same for any τSE and contribute equally to the rise in arterial pressure. Larger time constants lead to a delay in sodium excretion response and thus additional accumulation of blood volume. Volume expansion leads to an additional elevation in arterial pressure. The slope of the pressure–natriuresis relationship diminishes with increasing τSE which is consistent with experimental observations of volume-loading hypertension.
Panel B of each figure shows the relationship between arterial pressure and sodium excretion solutions. When the pressure–natriuresis mechanism is included in a model, the plot represents the renal function curve, i.e. the direct dependence of the sodium excretion on the arterial pressure assumed a priori. However, when the sodium intake–natriuresis mechanism is included instead, the plot represents a correlation of the two variables independently controlled within the same system.
Panel C of each figure shows the sodium excretion response to changes in sodium intake. Both sodium excretion and intake rates are shown as a fraction of normal sodium intake, FSI,0.
Simulation 1. Response of the four models to AngII–salt
The haemodynamic profile generated in an animal model of AngII–salt hypertension (Fig. 1) can be reproduced by any of the four models. Our simplified version of the GC model, ‘Pa–kSE–Autoreg’ (where kSE = 6.2), produces results consistent with those reported in the literature for the original GC model (Guyton 1980) (Fig. 9, continuous grey lines). The slope of the renal function curve is decreased due to the increased circulating angiotensin levels: thus, a 5-fold increase in intake of sodium requires an elevation of arterial pressure to a new steady-state level. Accumulation of total blood volume leads to an increase in cardiac output, which is then partially converted to elevated arterial resistances via the long-term autoregulation mechanism.
Substitution of neural control of arterial resistances instead of autoregulatory control, model ‘Pa–kSE–Neural’ (where kSE = 6.2), yields little difference in the transient responses and no difference in the steady state values of arterial pressure (Fig. 9, dashed grey lines). Since the functional representations of the two resistance control mechanisms are not identical, the transient responses between the two models are slightly different. However, as in the original GC model, the steady-state arterial pressure is determined solely by the renal function curve in this version of our model; thus, neural control of resistances can only affect the relative contribution of cardiac output and total peripheral resistance to arterial pressure, but not the steady-state level of arterial pressure itself. If the gains of the neural and autoregulation control mechanisms are similar, then so are the cardiac output and total peripheral resistance solutions of the two models.
The dominance of renal function in determining steady-state arterial pressure values in the above models (that incorporate the pressure–natriuresis mechanism) is further shown by changing the slope of the renal function curve: model ‘Pa–kSE–Neural’ (where kSE = 10.88) (Fig. 9, dashed black lines). A steeper slope produces lower steady state values of arterial pressure during the 5-fold increase in sodium intake, and a faster sodium excretory response, which is able to return total blood volume fully to initial values. Due to a relatively large gain in the neural regulation of resistance, cardiac output is driven to a value lower than in the initial steady-state conditions. Thus, in the presence of the pressure–natriuresis mechanism, neural control of arterial resistances plays only a secondary role in determining haemodynamic responses, and no role in setting the steady-state level of arterial pressure (as in the actual GC model).
In marked contrast, if the sodium intake–natriuresis mechanism is substituted for the pressure–natriuresis mechanism in the model, control of arterial resistance plays a dominant role in haemodynamic regulation. Model ‘FSI–τSE–Neural’ (where τSE = 0.3 days) assumes that sodium excretion is driven by sodium intake only and is not determined by arterial pressure (Fig. 9, continuous black lines). Accumulation of total blood volume in response to the step increase in sodium intake elevates cardiac output, while neural drive elevates arterial resistance of both vascular beds; together these cause a steady-state elevation of arterial pressure. Thus the haemodynamic profile produced by this model is similar to that of the GC model, despite the absence of a pressure–natriuresis mechanism. Furthermore, it is important to note that even though there is no direct dependence of sodium excretion on arterial pressure in this model, a clear relationship exists between the two variables that is identical in form to the pressure–natriuresis relationship observed experimentally.
Even though all haemodynamic profiles in these simulations are similar, they are produced via different sequences of events depending on whether the pressure–natriuresis mechanism is assumed a priori or not. In the model that includes the pressure–natriuresis mechanism (e.g. GC model), arterial resistance and cardiac output are secondary to mean arterial pressure and the autoregulatory mechanism. In the model with sodium-intake natriuresis, arterial resistance and cardiac output drive mean arterial pressure and give rise to the pressure–natriuresis relationship.
The outcome of these simulations is the novel hypothesis that the haemodynamic profile of AngII–salt hypertension would be similar in animals in which the pressure–natriuresis mechanism was present or not. This hypothesis remains to be tested experimentally. One approach would be to induce AngII–salt hypertension in bilaterally nephrectomized animals. One could control (via dialysis) body sodium removal pari passu with changes in sodium intake (as envisioned in one version of our model). According to that version of our model, haemodynamic changes in this situation (pressure–natriuresis absent) should be similar to those observed in animals with intact kidneys (pressure–natriuresis intact).
Simulation 2. Response to sodium intake alone
We’ve shown in the model ‘FSI–τSE–Neural’ that both sodium excretion and resistance control mechanisms can play dominant roles in the long-term control of arterial pressure. In the following simulation we study their relative contributions.
The model's response to elevated sodium intake without a change in AngII input (such as might occur when moving from a high to a very high salt intake) shows the relative effect of total blood volume accumulation on the haemodynamic response (Fig. 10). In the model with the pressure–natriuresis mechanism (‘Pa–kSE–Autoreg’, dashed grey lines), the increase in total blood volume leads to an elevation of arterial resistances and a decrease of cardiac output via the autoregulatory mechanism (Fig. 10A). The long-term, steady-state arterial pressure value is determined exclusively by the renal function curve (Fig. 10B).
Figure 10. Effects of sodium loading alone.
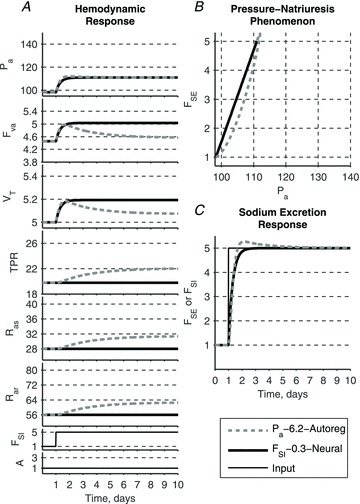
Sodium loading alone leads to a small elevation of arterial pressure in both models. While this elevation is associated with the accumulation of total blood volume, its value is determined differently. In GC model (‘Pa–6.2–Autoreg’) arterial pressure for the new level of sodium intake is determined solely by the renal function curve, while total blood volume expansion is modified via autoregulation mechanism. In the model ‘FSI–0.3–Neural’ elevation of blood pressure is driven by the volume expansion alone.
In the model incorporating the sodium intake–natriuresis mechanism (‘FSI–τSE–Neural’, continuous black lines), the total accumulation of blood volume is larger than in the previous simulation due to the absence of an overshoot in the sodium excretion response (Fig. 10C). Accumulation of total blood volume is solely responsible for the steady-state elevations of cardiac output and arterial pressure. Resistances remain normal since the neural control mechanism requires an elevation in both sodium intake and AngII.
Despite different causes for the elevated long-term arterial pressure, both models again produce similar pressure–natriuresis relationships (Fig. 10B).
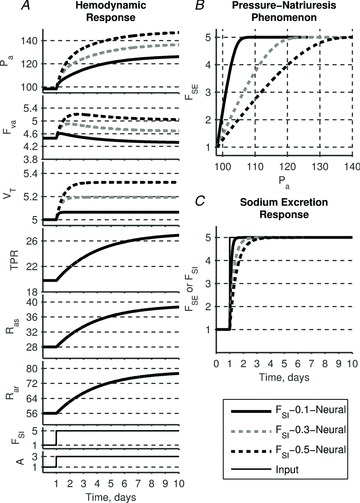
Simulation 3. Effect of the time constant in the sodium intake–natriuresis mechanism
In the following simulation we consider the response of the model ‘FSI–τSE–Neural’ to varying time constants of the sodium intake–natriuresis mechanism, τSE. Larger time constants lead to a slower response of sodium excretion (Fig. 11C) and thus larger blood volume accumulation. Since the resistance response is driven independently of sodium excretion, it remains the same for any time constant τSE and contributes equally to the rise of arterial pressure across all three scenarios (Fig. 11A). Simulation 2 already demonstrated that total blood volume accumulation alone has a moderate effect on steady-state arterial pressure. Thus it is of little surprise that changing the time constant of the sodium intake–pressure natriuresis mechanism affects steady-state arterial pressure by altering the accumulation of total blood volume (Fig. 11A). What is more striking is that the pressure–natriuresis relationships plotted using solutions with different time constants of the sodium intake–natriuresis mechanism (Fig. 11B) are reminiscent of the renal function curves observed in the GC model: the larger the time constant the higher the steady-state level of arterial pressure, and thus the shallower the slope of the renal function curve. Thus the steepness of the pressure–natriuresis relationship observed experimentally need not be ascribed to the existence of direct dependence of sodium excretion on arterial pressure. In other words, the pressure–natriuresis phenomenon (observed values of each variable during changes in salt intake) can be simply viewed as a manifestation of independent mechanisms working within the same system rather than necessarily reflecting a cause-and-effect relationship between the two variables.
Discussion
Role of a shift in the pressure–natriuresis mechanism in determining the steady-state level of arterial pressure during development of hypertension
Using AngII–salt hypertension as our physiological paradigm, we attempted here to develop a relatively simple mathematical description of control of the systemic circulation that could accurately predict haemodynamic and renal excretory responses to induced changes in AngII and sodium (and water) inputs to the circulatory system. One might ask why this is necessary, since the well-known GC model can quite accurately predict both responses and is well accepted. We fully acknowledge the powerful role of pressure–natriuresis in the long-term control of arterial pressure. It importance is supported by decades of research in several laboratories. However, our recent findings strongly suggest that the full expression of AngII–salt hypertension in the rat depends on increased sympathetic input to the cardiovascular system in a manner that is not predicted by the GC model. For example, sympathetic control in the GC model is based primarily on the arterial baroreceptor reflex which was not considered important in long-term control of arterial pressure. More importantly, hypertension development in the GC model requires a shift in the pressure–natriuresis mechanism to a higher pressure and such a shift, in a neurogenic model of hypertension, could only be caused by an increase in sympathetic nerve activity to the kidney. Yet we have shown that renal SNA decreases in AngII–salt hypertension (Yoshimoto et al. 2010), and that intact renal nerves are not necessary for hypertension development (King et al. 2007).
Thus, we decided to explore circulatory control models in which the development of neurogenic hypertension did not require a shift in the pressure–natriuresis mechanism. A key test of any such model is that it accurately predicts both the obligatory shift in the observed pressure–natriuresis relationship found in all forms of hypertension, and the observed haemodynamic responses to AngII–salt administration. An important outcome of our work is the finding that a simple mathematical model of the circulation that does not include the pressure–natriuresis mechanism can do both.
Our results highlight the fact that the pressure–natriuresis relationship (easily measured and observed) is often confused with the pressure–natriuresis mechanism (a physiological response of the kidney to changes in arterial perfusion pressure). While the pressure–natriuresis mechanism is certainly one credible explanation for the existence of the pressure–natriuresis relationship, our model shows that it is not a required element. This finding does not, of course, imply that the pressure–natriuresis mechanism is unimportant in actual physiological regulation of the circulation. There is no doubt that changes in renal arterial perfusion pressure can strongly affect renal salt and water excretion (Guyton, 1980) and that this has major effects on blood pressure and other cardiovascular variables. But, as Bie and others have shown convincingly (Seeliger et al. 2004; Bie, 2009), there also are powerful factors regulating sodium excretion that appear to function independent of any changes in renal arterial perfusion pressure. By demonstrating that a model based exclusively on these latter factors (along with other standard circulatory features) can reproduce the shift in the pressure–natriuresis relationship always observed in hypertensive individuals, we emphasize that such a shift per se cannot be taken as evidence of a functional alteration in the pressure–natriuresis mechanism (i.e. a shift in the renal function curve). It also provides a potential explanation for our observation of a neurogenic contribution to AngII–salt hypertension that does not involve the renal sympathetic nerves.
In order for a model to be of practical use it must generate a biologically testable hypothesis. Based on our model we hypothesize that the haemodynamic profile of AngII–salt hypertension in animals, in which the pressure–natriuresis mechanism is fully operational, will be identical to those in which this mechanism is non-existent. We plan to test this hypothesis by comparing the haemodynamic profile of AngII–salt rats with intact kidneys (pressure–natriuresis intact) to bilaterally nephrectomized rats (pressure–natriuresis absent) in which sodium removal is controlled pari passu with changes in sodium intake as simulated in our model (Fig. 9). The outcome of these experiments will be considered in future versions of our model.
Role of whole body autoregulation versus neural control of the vasculature in establishing the haemodynamic profile of salt-sensitive hypertension
Another key feature of the GC model is the role of ‘whole body autoregulation’ in establishing the temporal profile of cardiac output and total peripheral resistance of salt-sensitive hypertension. Similar to the pressure–natriuresis mechanism, which is an intrinsic property of the kidney that dominates long-term control of sodium excretion, the GC model predicts that the long-term control of vascular resistance is primarily dependent on intrinsic mechanisms of the arterioles designed to match oxygen delivery with oxygen demand of the tissues. The GC model states that whole body autoregulation is responsible for converting the early phase of salt-sensitive hypertension, in which total peripheral resistance is normal and increased blood volume and cardiac output drive the increase in blood pressure, to a steady-state phase characterized by increased total peripheral resistance and near normal cardiac output and blood volume. The delayed increase in resistance is theorized to occur in response to increased cardiac output which increases oxygen delivery to tissues beyond oxygen demand, and the subsequent autoregulatory vasoconstriction. Although this mechanism was originally proposed by Guyton to dominate all other controllers of vascular resistance (Coleman et al. 1971; Guyton, 1989; Guyton, 1991) a similar view has also recently been proposed by others (Dorrington & Pandit, 2009).
The fact that not all of our experimental results are consistent with the whole body autoregulation hypothesis (see below) led us to construct our model such that vascular resistance could be controlled by either autoregulation or sympathetic activity. When whole body autoregulation was the only controller of vascular resistance (as in the GC model), we could reproduce the haemodynamic profile generated by the GC model (Fig. 9, continuous grey lines). However, the same profile could also be generated in the absence of whole body autoregulation and in the presence of sympathetic control of vascular resistance (Fig. 9, dashed), which was modelled based on our studies of ‘whole body’ sympathetic activity in the AngII–salt model (King et al. 2007; King et al. 2008).
Another feature of our model is the ability to predict the haemodynamic responses to changes in sympathetic activity to individual vascular beds. This is important since, in contrast to a unified ‘all or none’ sympathetic response, we have shown that the AngII–salt model is associated with a distinctive ‘sympathetic signature’ characterized by a transient decrease in SNA to the kidney and a likely delayed increase in SNA to the splanchnic vascular bed (Osborn et al. 2011). This experimentally derived sympathetic signature was recreated in one version of our model in which we simulated the haemodynamic profile under conditions in which the slope of the renal function curve was increased, as would occur when SNA to kidney is decreased, and the gain of neural control of vascular resistance was increased, as would occur when SNA to a non-renal vascular bed is increased (Fig. 9, dashed black lines). The model predicted that cardiac output would actually decrease (rather than increase) below baseline and blood volume would return to normal levels. A preliminary study from our laboratory in which we continuously measured arterial pressure and cardiac output in conscious AngII–salt rats is consistent with this simulation in that calculated total peripheral resistance increased and cardiac output decreased below basal levels at steady-state (Osborn et al. 2007b). Interestingly, the increase in resistance and decrease in cardiac output in AngII–salt rats were markedly attenuated by prior denervation of the splanchnic vascular bed (Osborn et al. 2007b) consistent with the idea that these responses were neurally mediated. This simulation is also consistent with our findings that blood volume is normal in AngII–salt rats (King & Fink, 2006).
Further experimental support for the prediction of our model that the haemodynamic profile of salt loading hypertension is not exclusively dependent on whole body autoregulation is provided by studies in which we measured haemodynamic responses to increased dietary salt in rats in which plasma AngII was chronically ‘clamped’ at normal levels (Fine et al. 2003). Our observations were qualitatively and quantitatively consistent with our model simulation (Fig. 10, continuous black lines) in that the increase in arterial pressure under these conditions was associated with a 10–15% increase cardiac output in contrast to total peripheral resistance which remained at control levels during 7 days of increased salt intake (Fine et al. 2003). In other words, despite a chronic salt-induced increased in cardiac output, this overperfusion of tissues did not result in an autoregulatory vasoconstrictor response under conditions of intact neural control of the vasculature.
Strengths and limitations of the model
Currently available models of long-term blood pressure regulation are based on the idea that renal sodium excretion is ultimately arterial pressure dependent; in these models renal dysfunction is a necessary and sufficient cause of hypertension. Furthermore, in current models many other control mechanisms have a powerful effect on blood pressure in the short term, yet no role in long term blood pressure regulation. Therefore these models cannot be used to test any other kind of hypothesis about the aetiology of sustained hypertension. Since some experimental data suggest that hypertension can occur in the absence of renal abnormalities, one strength of our new model is that it shows how an alternative cause of hypertension could be examined. Another strength is that it allows a wide range of mechanisms to participate in generating the haemodynamic patterns known to occur during development of hypertension. Finally, the advance of our model over the GC model is that we incorporate both possibilities (pressure-dependent and pressure-independent control of sodium excretion) and show that the exact same haemodynamic profile of salt-sensitive hypertension can be generated. We predict that this theoretical framework will provide the impetus for further studies into the role of pressure independent control of sodium excretion in the pathogenesis of hypertension. Indeed, we have proposed one novel experiment to directly test the main prediction of our model.
Of course there are limitations of our model at this early stage. Firstly, in its present form it qualitatively demonstrates the viability of the new physiological assumptions we have incorporated into the model, but it lacks the fine detail needed for experimental data fitting. Secondly, the model does not specify in detail what mechanisms of regulation of sodium excretion independent of renal perfusion pressure are responsible, but assumes that such mechanisms exist, based on the strong experimental evidence. We have shown that this assumption is consistent with the haemodynamic profile of hypertension. Thus, a next step would be to address the key question: What are the mechanisms of pressure-independent natriuresis? But that is beyond the scope of this paper. It is important to note that the mechanism of pressure-dependent natriuresis, even over an acute time frame, also remains disputed 40 years after the GC model was first published. However, what was known at the time the GC model was developed was that the relationship existed and therefore it was incorporated into the model. We have taken the same approach here.
Several planned extensions of the current model will address these limitations. The most important enhancement would be a more detailed description of the renal sodium excretion function in such a way that it combines the two competing mechanisms of natriuresis control we describe. One way to do this would be to allow strong dependency of renal sodium excretion on arterial pressure at the extreme ends of the pressure spectrum but weak or no dependency in the mid-range of pressures, as some physiological experiments suggest (Seeliger et al. 2005). Such an extension to the model would provide a mathematical modelling tool for testing both renal and neural hypotheses. Another obvious extension to the model would be to add the many other regulatory mechanisms which have been implicated in hypertension development. These mechanisms include neural control of capacitance vessels and cardiac function, direct impact of circulating AngII on the vasculature, autoregulatory control of resistances, and the baroreflex response.
Acknowledgments
We wish to thank Dr. Stephen Ruble for providing insightful and constructive suggestions during the creation of the manuscript. The work was supported in part by the National Institutes of Health grants GM29123 and HL076312.
Glossary
- AngII
angiotensin II
- CO
cardiac output
- GC
Guyton–Coleman
- SE
sodium excretion
- SNA
sympathetic nervous system activity
- TBW
total body weight
- TPR
total peripheral resistance
Author contributions
V.A. developed the mathematical model and wrote the original draft of the manuscript. H.O. provided direct oversight of the modelling and provided editorial input on the manuscript. G.F. and J.O. suggested the original scientific concept for the model and provided editorial input on the manuscript. H.O. and J.O. acted as co-advisors for V.A.'s doctoral thesis research, which includes the work presented in this manuscript. All authors approved the final version of the manuscript.
Supplementry Material
References
- Bie P. Blood volume, blood pressure and total body sodium: internal signalling and output control. Exp Physiol. 2009;195:187–196. doi: 10.1111/j.1748-1716.2008.01932.x. [DOI] [PubMed] [Google Scholar]
- Caldini P, Permutt S, Waddell JA, Riley RL. Effect of epinephrine on pressure, flow, and volume relationships in the systemic circulation of dogs. Circ Res. 1974;34:606–623. doi: 10.1161/01.res.34.5.606. [DOI] [PubMed] [Google Scholar]
- Coleman TG, Granger HJ, Guyton AC. Whole-body circulatory autoregulation and hypertension. Circ Res. 1971;28(Suppl 2):76–87. doi: 10.1161/01.res.28.5.ii-76. [DOI] [PubMed] [Google Scholar]
- Dorrington KL, Pandit JJ. The obligatory role of the kidney in long-term arterial blood pressure control: extending Guyton's model of the circulation. Anaesthesia. 2009;64:1218–1228. doi: 10.1111/j.1365-2044.2009.06052.x. [DOI] [PubMed] [Google Scholar]
- Fine DM, Ariza-Nieto P, Osborn JW. Does whole body autoregulation mediate the hemodynamic responses to increased dietary salt in rats with clamped angiotensin II. Am J Physiol Heart Circ Physiol. 2003;285:H2670–2678. doi: 10.1152/ajpheart.00395.2003. [DOI] [PubMed] [Google Scholar]
- Grodins FS. Integrative cardiovascular physiology: A mathematical synthesis of cardiac and blood vessel hemodynamics. Q Rev Biol. 1959;34:93–116. doi: 10.1086/402631. [DOI] [PubMed] [Google Scholar]
- Guyton AC. Circulatory Physiology III: Arterial Pressure and Hypertension. Philadelphia: WB Saunders; 1980. [Google Scholar]
- Guyton AC. Dominant role of the kidneys and accessory role of whole-body autoregulation in the pathogenesis of hypertension. Am J Hypertens. 1989;2:575. doi: 10.1093/ajh/2.7.575. [DOI] [PubMed] [Google Scholar]
- Guyton AC. The surprising kidney-fluid mechanism for pressure control – its infinite gain! Hypertension. 1990;16:725–730. doi: 10.1161/01.hyp.16.6.725. [DOI] [PubMed] [Google Scholar]
- Guyton AC. Abnormal renal function and autoregulation in essential hypertension. Hypertension. 1991;18(5 Suppl):III49. doi: 10.1161/01.hyp.18.5_suppl.iii49. [DOI] [PubMed] [Google Scholar]
- Guyton AC, Coleman TG. Long-term regulation of the circulation: interrelationships with body fluid volumes. In: Reeve EB, Guyton AC, editors. Physical Bases of Circulatory Transport: Regulation and Exchange. Philadelphia: WB Saunders; 1967. pp. 179–201. [Google Scholar]
- Guyton AC, Coleman TG, Granger HJ. Circulation: overall regulation. Annu Rev Physiol. 1972;34:13–46. doi: 10.1146/annurev.ph.34.030172.000305. [DOI] [PubMed] [Google Scholar]
- Hall JE, Guyton AC, Smith MJ, Jr, Coleman TG. Blood pressure and renal function during chronic changes in sodium intake: role of angiotensin. Am J Physiol Renal Physiol. 1980;239:F271–280. doi: 10.1152/ajprenal.1980.239.3.F271. [DOI] [PubMed] [Google Scholar]
- Hollenberg NK. Surfeit, deficit, and the set point for sodium homeostasis. Kidney Int. 1982;21:883–884. doi: 10.1038/ki.1982.114. [DOI] [PubMed] [Google Scholar]
- Hottenstein OD, Kreulen DL. Comparison of the frequency dependence of venous and arterial responses to sympathetic nerve stimulation in guinea-pigs. J Physiol. 1987;384:153–167. doi: 10.1113/jphysiol.1987.sp016448. [DOI] [PMC free article] [PubMed] [Google Scholar]
- Kaplan NM. Sodium handling in hypertensive states. In: Seldin DW, Giebisch G, editors. The regulation of Sodium and Chloride Balance. New York: Raven Press; 1990. pp. 457–479. [Google Scholar]
- Karaaslan F, Denizhan Y, Kayserilioglu A, Gulcur HO. Long-term mathematical model involving renal sympathetic nerve activity, arterial pressure, and sodium excretion. Ann Biomed Eng. 2005;33:1607–1630. doi: 10.1007/s10439-005-5976-4. [DOI] [PubMed] [Google Scholar]
- King AJ, Fink GD. Chronic low-dose angiotensin II infusion increases venomotor tone by neurogenic mechanisms. Am Heart Assoc. 2006;48:927–933. doi: 10.1161/01.HYP.0000243799.84573.f8. [DOI] [PubMed] [Google Scholar]
- King AJ, Novotny M, Swain GM, Fink GD. Whole body norepinephrine kinetics in AngII-salt hypertension in the rat. Am J Physiol Regul Integr Comp Physiol. 2008;294:R1262–1267. doi: 10.1152/ajpregu.00819.2007. [DOI] [PubMed] [Google Scholar]
- King AJ, Osborn JW, Fink GD. Splanchnic circulation is a critical neural target in angiotensin II salt hypertension in rats. Hypertension. 2007;50:547–556. doi: 10.1161/HYPERTENSIONAHA.107.090696. [DOI] [PubMed] [Google Scholar]
- Krieger JE, Roman RJ, Cowley AW., Jr Hemodynamics and blood volume in angiotensin II salt-dependent hypertension in dogs. Am J Physiol Heart Circ Physiol. 1989;257:H1402–1412. doi: 10.1152/ajpheart.1989.257.5.H1402. [DOI] [PubMed] [Google Scholar]
- Liard JF. Cardiogenic hypertension. Int Rev Physiol. 1979;18:317–355. [PubMed] [Google Scholar]
- Luetscher JA, Boyers DG, Cuthbertson JG, McMahon DF. A model of the human circulation: Regulation by autonomic nervous system and renin-angiotensin system, and influence of blood volume on cardiac output and blood pressure. Circ Res. 1973;32:84–98. [PubMed] [Google Scholar]
- Olufsen MS, Ottesen JT, Tran HT, Ellwein LM, Lipsitz LA, Novak V. Blood pressure and blood flow variation during postural change from sitting to standing: model development and validation. J Appl Physiol. 2005;99:1523–1537. doi: 10.1152/japplphysiol.00177.2005. [DOI] [PMC free article] [PubMed] [Google Scholar]
- Osborn JW, Averina VA, Fink GD. Current computational models do not reveal the importance of the nervous system in long-term control of arterial pressure. Exp Physiol. 2009;94:389–395. doi: 10.1113/expphysiol.2008.043281. [DOI] [PMC free article] [PubMed] [Google Scholar]
- Osborn JW, Fink GD. Region-specific changes in sympathetic nerve activity in angiotensin II-salt hypertension in the rat. Exp Physiol. 2010;95:61–68. doi: 10.1113/expphysiol.2008.046326. [DOI] [PMC free article] [PubMed] [Google Scholar]
- Osborn JW, Fink GD, Kuroki MT. Neural mechanisms of angiotensin II-salt hypertension: Implications for therapies targeting neural control of the splanchnic circulation. Curr Hypertens Rep. 2011;13:221–228. doi: 10.1007/s11906-011-0188-9. [DOI] [PMC free article] [PubMed] [Google Scholar]
- Osborn JW, Fink GD, Sved AF, Toney GM, Raizada MK. Circulating angiotensin II and dietary salt: converging signals for neurogenic hypertension. Curr Hypertens Rep. 2007a;9:228–235. doi: 10.1007/s11906-007-0041-3. [DOI] [PubMed] [Google Scholar]
- Osborn JW, Guzman PP,AKing&GDFink. Celiac ganglionectomy abolishes the chronic vasoconstrictor responses to angiotensin II in conscious rats consuming a high salt diet. FASEB J. 2007b;21 April 18, 2007:A1219. [Google Scholar]
- Reinhardt HW, Seeliger E. Toward an integrative concept of control of total body sodium. News Physiol Sci. 2000;15:319–325. doi: 10.1152/physiologyonline.2000.15.6.319. [DOI] [PubMed] [Google Scholar]
- Rothe CF. Reflex control of veins and vascular capacitance. Physiol Rev. 1983;63:1281–1342. doi: 10.1152/physrev.1983.63.4.1281. [DOI] [PubMed] [Google Scholar]
- Sagawa K. Analysis of the ventricular pumping capacity as a function of input and output pressure loads. In: Reeve EB, Guyton AC, editors. Physical Bases of Circulatory Transport: Regulation and Exchange. Philadelphia: WB Saunders; 1967. pp. 141–149. [Google Scholar]
- Seeliger E, Andersen JL, Bie P, Reinhardt HW. Elevated renal perfusion pressure does not contribute to natriuresis induced by isotonic saline infusion in freely moving dogs. J Physiol. 2004;559:939–951. doi: 10.1113/jphysiol.2004.066670. [DOI] [PMC free article] [PubMed] [Google Scholar]
- Seeliger E, Wronski T, Ladwig M, Rebeschke T, Persson PB, Reinhardt HW. The ‘body fluid pressure control system’ relies on the renin-angiotensin-aldosterone system: balance studies in freely moving dogs. Clin Exp Pharmacol Physiol. 2005;32:394–399. doi: 10.1111/j.1440-1681.2005.04201.x. [DOI] [PubMed] [Google Scholar]
- Shoukas AA, Sagawa K. Total systemic vascular compliance measured as incremental volume-pressure ratio. Circ Res. 1971;28:277–289. doi: 10.1161/01.res.28.2.277. [DOI] [PubMed] [Google Scholar]
- Toney GM, Pedrino GR, Fink GD, Osborn JW. Does enhanced respiratory-sympathetic coupling contribute to peripheral neural mechanisms of angiotensin II-salt hypertension. Exp Physiol. 2010;95:587–594. doi: 10.1113/expphysiol.2009.047399. [DOI] [PMC free article] [PubMed] [Google Scholar]
- Ursino M. Interaction between carotid baroregulation and the pulsating heart: a mathematical model. Am J Physiol Heart Circ Physiol. 1998;275:1733–1747. doi: 10.1152/ajpheart.1998.275.5.H1733. [DOI] [PubMed] [Google Scholar]
- Ursino M, Antonucci M, Belardinelli E. Role of active changes in venous capacity by the carotid baroreflex: analysis with a mathematical model. Am J Physiol Heart Circ Physiol. 1994;267:2531–2546. doi: 10.1152/ajpheart.1994.267.6.H2531. [DOI] [PubMed] [Google Scholar]
- Yoshimoto M, Miki K, Fink GD, King A, Osborn JW. Chronic angiotensin II infusion causes differential responses in regional sympathetic nerve activity in rats. Hypertension. 2010;55:644–651. doi: 10.1161/HYPERTENSIONAHA.109.145110. [DOI] [PMC free article] [PubMed] [Google Scholar]
Associated Data
This section collects any data citations, data availability statements, or supplementary materials included in this article.