Abstract
Two fluorescent heteroditopic ligands (2a and 2b) for zinc ion were synthesized and studied. The efficiencies of two photophysical processes, intramolecular charge transfer (ICT) and photoinduced electron transfer (PET), determine the magnitudes of emission bathochromic shift and enhancement, respectively, when a heteroditopic ligand forms mono- or dizinc complexes. The electron-rich 2b is characterized by a high degree of ICT in the excited state with little propensity for PET, which is manifested in a large bathochromic shift of emission upon Zn2+ coordination without enhancement in fluorescence quantum yield. The electron-poor 2a displays the opposite photophysical consequence where Zn2+ binding results in greatly enhanced emission without significant spectral shift. The electronic structural effects on the relative efficiencies of ICT and PET in 2a and 2b as well as the impact of Zn2+-coordination are probed using experimental and computational approaches. This study reveals that the delicate balance between various photophysical pathways (e.g. ICT and PET) engineered in a heteroditopic ligand is sensitively dependent on the electronic structure of the ligand, i.e. whether the fluorophore is electron-rich or poor, whether it possesses a donor–acceptor type of structure, and where the metal binding occurs.
Introduction
The operation of a fluorescent indicator is based on sensitive and selective modulation of emission by an analyte species. The successful structural design of a fluorescent indicator relies on a thorough understanding of the analyte-sensitive photophysical processes.1,2 Analyte-modulated photoinduced electron transfer (PET), intramolecular charge transfer (ICT), excited state proton transfer (ESPT), excimer/exciplex formation, fluorescence resonance energy transfer (FRET), and other processes have been employed in engineering fluorescent indicators.3 So much experience has been accumulated in this area that a modular strategy in structural design by coupling a molecular recognition event with the efficiency of a single photophysical process has become routine.4,5
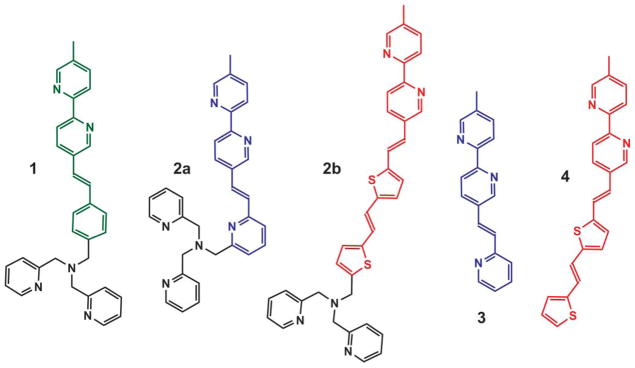
In the course of our development of fluorescent indicators for zinc ion (Zn2+) that are effective over large concentration ranges,6 we have become interested in the fundamental aspects of fluorophores in which more than one photophysical processes are modulatable via molecular recognition.7 One typical structure contains a fluorophore and two different Zn2+ binding sites, whose emission depends on the coordination status of the compound (see cartoon in Fig. 1 and compound 1 in the Structures). Much of our effort since the initial report of our “fluorescent heteroditopic ligands”8 has been devoted to unraveling the finesse of the coordination-mediated photophysical processes in order to develop heteroditopic systems that afford large fluorescence contrast in their three coordination states (Fig. 1).9,10 Three parameters are used for evaluating the ‘fluorescence contrast’: (1) the fluorescence enhancement upon monozinc complex formation (φ1/φ0), (2) emission band shift upon dizinc complex formation (Δλ = λ2 − λ1), and (3) the fluorescence quantum yields of both mono- and dizinc complexes (φ1 and φ2). The fluorescence quantum yield (φ) and emission wavelength (λ) values of compound 1 are listed in Fig. 1. We aim to increase the values for all three sets of parameters via structural modification, the success of which may lead to indicator molecules for Zn2+ with enhanced sensitivity across a large concentration range.
Fig. 1.
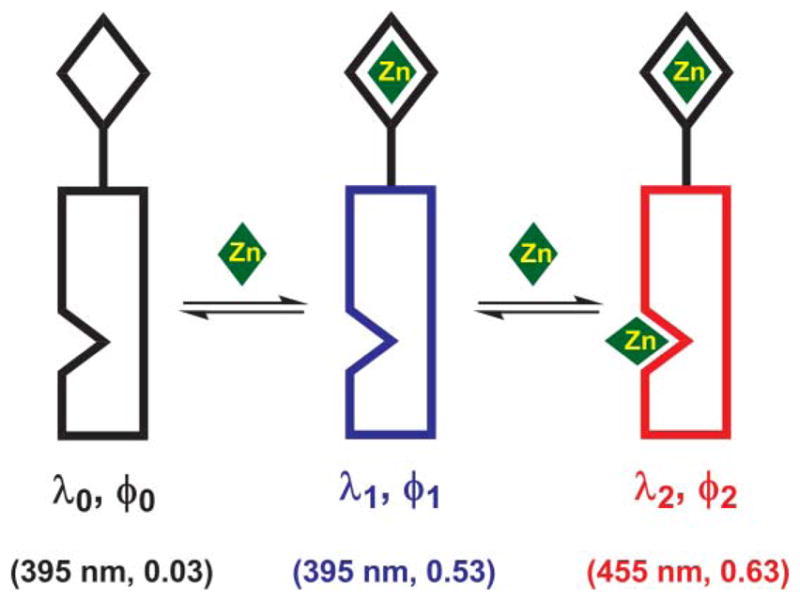
An illustration showing the fluorescent heteroditopic ligand and its three coordination states. Diamond on top: high-affinity Zn2+ binding site, also the electron donor in photoinduced electron transfer (PET). Nicked rectangle: the fluorophore which contains the low-affinity Zn2+ binding site, shown as the nick. λ – emission wavelength; φ – fluorescence quantum yield; subscripts denote the coordination status. The relevant values of compound 1 in CH3 CN are listed in the parentheses.
In our previous study on the monotopic arylvinyl-bipy-based fluorophores, an electron-rich aryl group was found to afford a large emission band shift upon Zn2+ complexation.10 This finding potentially provides a solution to increase the value of the second parameter – i.e., the emission band shift upon dizinc complex formation – in a heteroditopic ligand context. The cyclic voltammetric studies of the monotopic fluoroionophores led to a hypothesis, however, that the oxidation potential would increase when an electron-rich aryl group is incorporated, which is expected to impair the electron-accepting ability of the arylvinyl-bipy fluorophore in the excited state during a possible PET event in the heteroditopic framework (Fig. 1).9 The attenuation of the PET efficiency may decrease the value of the first parameter – the fluorescence enhancement upon monozinc complex formation. In the current study, we have prepared two fluorescent heteroditopic ligands containing an electron-poor (2a) and an electron-rich (2b) aryl group, respectively. Their coordination-mediated photophysical properties were found to be consistent with our hypothesis.
Results and discussion
Structures
The structures of 1, 2a, 2b, 3 and 4 are shown below.
Design
Heteroditopic compounds 2a and 2b were designed to have an electron-poorer and an electron-richer bipy-containing fluorophore, respectively, than that of the parent compound 1. Compounds 3 and 4 are the respective monotopic bipy-containing fluorophores of 2a and 2b, devoid of the higher-affinity dipicolylamino (DPA) Zn2+-binding site.11 The electron-deficient nature of fluorophore 3 is expected to render the intramolecular PET process efficient in the excited state of the heteroditopic 2a. However, the emission band shift of 2a when the bipy site is coordinated is expected to be small because the fluorophore is expected to exhibit little charge transfer character in the excited state. Compound 2b which contains an electron-rich fluorophore would instead have little thermodynamic driving force for intramolecular PET in the absence of Zn2+. When Zn2+ binds at the bipy site, the emission bathochromic shift is expected to be significant due to the highly charge-transfer nature of fluorophore 4.
The hypothesis on 2a and 2b is tested by various experimental and computational means which are described following the synthesis section. The characterization of the electronic structures of 2a and 2b via cyclic voltammetry and DFT calculation will be presented first, followed by the description of their spectroscopic features. The acquired knowledge base will be used to explain the Zn2+-binding-dependent emission of 2a and 2b. Finally, the potential of 2a as an indicator for intracellular Zn2+ will be briefly evaluated.
Synthesis
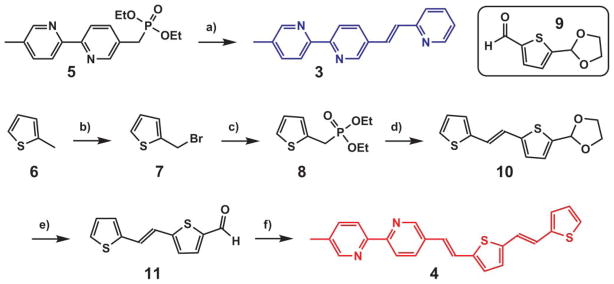
The syntheses of the monotopic bipy-containing fluoroionophores 3 and 4 are presented in Scheme 1. Horner–Wadsworth–Emmons (HWE) reaction between phosphonate 59 and 2-pyridinecarboxaldehyde produced the trans isomer of compound 3. The synthesis of compound 4 was initiated by radical bromination of 2-methylthiophene 6 followed by an Arbuzov phosphonate synthesis to afford 8. The HWE reaction between 8 and 9 resulted in 10 which was deprotected followed by a second HWE reaction with phosphonate 5 to afford compound 4.
Scheme 1.
Syntheses of 3 and 4. a) NaH, dimethoxyethane (DME), 2-pyridinecarboxaldehyde, 75%; b) NBS, benzoyl peroxide, CCl4, 98%; c) (EtO)3 P, 95%; d) 9, NaH, DME, 25%; e) HCl–THF–H2O; f) 5, NaH, DME, 92% for two steps.
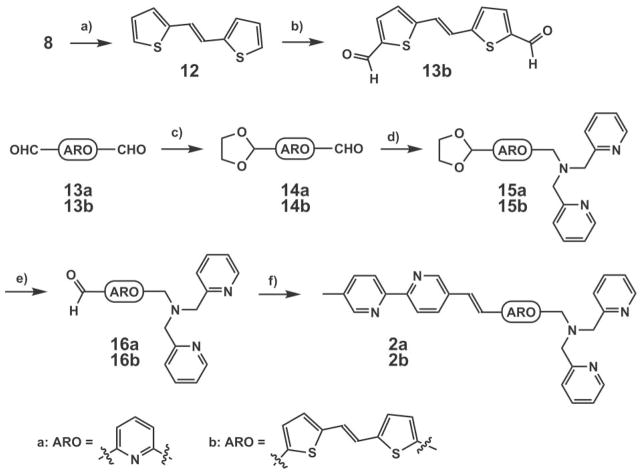
Dicarboxaldehyde 13b was prepared by the Vilsmeier reaction12 from 12 which was obtained by the HWE reaction between 8 and 2-thiophenecarboxaldehyde. The syntheses of 2a and 2b (Scheme 2) followed an established route.13 Briefly, monoprotection of dicarboxaldehydes 13a and 13b afforded 14a and 14b, respectively. The subsequent reductive amination/deprotection sequence gave rise to 16a and 16b, which underwent the HWE reactions with phosphonate 5 to afford 2a and 2b, respectively.
Scheme 2.
Syntheses of 2a and 2b. a) NaH, DME, 2-thiophene-carboxaldehyde, 88%; b) POCl3, DMF, reflux, 98%; c) ethylene glycol, TsOH (catalyst), benzene, Dean–Stark, reflux, 20% for 14a; d) di(2-picolyl)amine, NaBH(OAc)3, rt, 58% for 15a; e) HCl–THF–H2 O, rt; f) NaH, dimethoxyethane, 5, rt, 46% for 2a and 12% for 2b in two steps.
X-Ray crystal structure of 2b
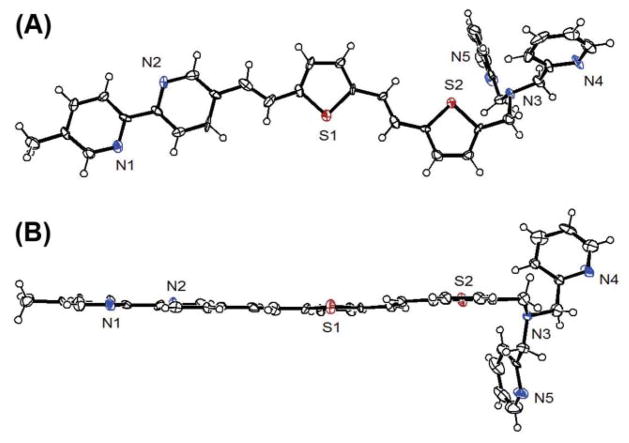
The single crystals of 2b suitable for X-ray diffraction were acquired via slow evaporation of its solution in hexanes and CH2Cl2. Only one conformer with respect to the rotations of the single bonds in the fluorophore portion was observed. The dipoles of the four aromatic rings (two pyridyls and two thienyls) are alternating across the plane, presumably to minimize the overall dipole moment of the fluorophore. It is conceivable that in solution, the rotations of these single bonds may be permitted under ambient conditions to result in various conformers. Bipy units without conjugatable aromatic moieties attached usually display small dihedral angles (6–7° or slightly larger) along the C–C bonds.8,14–16 The direct connection to a vinylaryl group such as in 2b, tends to flatten the bipy unit to result in an extensively conjugated structure as shown in Fig. 2B. A similarly coplanar arylvinyl-substituted bipy was reported earlier.10
Fig. 2.
Two views of the X-ray crystal structure of 2b (50% probability ellipsoids). The heteroatoms are labelled.
Computational studies and cyclic voltammetry
The charge-transfer characters, or the lack thereof, of compounds 3 and 4 are illustrated in their frontier molecular orbital diagrams (at B3LYP/6-31+G(d,p) level, Fig. 3). Little electron density redistribution is shown between the HOMO and LUMO of compound 3. On the other hand, the electron density localizes on the divinylthienyl portion of compound 4 in its HOMO, which shifts to the bipy side in the LUMO. The difference in electron density distributions of the calculated frontier orbitals of 4 is consistent with an occurrence of charge transfer upon photoexcitation.
Fig. 3.
(A) HOMO of 3, (B) LUMO of 3, (C) HOMO of 4, and (D) LUMO of 4 calculated at B3LYP/6-31+G(d,p) level of theory.
The HOMO diagrams (at B3LYP/6-31+G(d,p) level) of heteroditopic 2a and 2b are shown in Fig. 4. Compared to the monotopic precursor 3, the HOMO of 2a (Fig. 4A) localizes primarily on the tertiary amino group, which is part of the high-affinity DPA coordination site, instead of the electron-poor fluorophore on which HOMO-1 resides (Fig. S5). On the contrary, the HOMO of the electron-rich 2b (Fig. 4B) occupies the divinylthienyl component of the fluorophore with a π character, similar to that of 4 (Fig. 3C).
Fig. 4.
Left: HOMO diagrams of 2a (A) and 2b (B). Right: illustrations of frontier molecular orbital arrangements during photoexcitation of 2a (A) and 2b (B). The orbital diagrams of other frontier orbitals are shown in Figures S5–S6†. hν(ex): photons in excitation; hν(em): emitted photon. PET: photoinduced electron transfer. Solid arrows: radiative processes; dashed arrow: nonradiative process.
The relative energies of frontier MOs can be used to gauge the relative efficiencies of PET in 2a and 2b.9 The excitation of 2a results in a 1(π–π*) state where an electron is elevated from the HOMO-1 (which is a π orbital) to the LUMO (The HOMO to LUMO transition is of the forbidden n → π* nature,17,18 evidenced by the low oscillator strength, 0.2, of this transition, see Table 2). As sketched in Fig. 4A, PET from the tertiary amino group-occupied HOMO (orbital diagrams of HOMO-1 and LUMO are shown in Fig. S5†), is thermodynamically favored, which leads to the nonradiative decay to the ground state. On the other hand in the excited 2b, PET from the tertiary amino group, which is HOMO-3 (Fig. S6†), to the singly occupied HOMO is thermodynamically uphill (Fig. 4B). Therefore, fluorescence emission would occur instead accompanying the relaxation back to the ground state.
Table 2.
Positions (λabs ) and molar absorptivities (ε) of the lowest energy absorption bands of both free ligands and their Zn2+ complexes in CH3 CN.a The Zn2+-induced absorption band shifts (Δνabs/cm−1) are shown on the right along with the calculated HOMO–LUMO transition oscillator strengths (f )
| ligand | λabs (L)/nm | ε(L)/cm−1M−1 | λabs (ZnL)/nm | ε(ZnL)/mol−1cm−1 | Δνabs/cm−1 | f (HOMO–LUMO) |
|---|---|---|---|---|---|---|
| 3 | 336 | 45 685 | 348 | 35 655 | 1026 | 1.4 |
| 4 | 412 | 54 545 | 430 | 34 805 | 1016 | 1.8 |
| 2a | 340 | 44 911 | 348 | 30 558 | 676 | 0.2 |
| 2b | 418 | 53 968 | 436 | 35 979 | 988 | 1.4 |
L: free ligand; ZnL: Zn(II) complex.
The energetic arrangement of HOMO and HOMO-1 or HOMO-3, which is critical in understanding the relative efficiencies of PET in heteroditopic ligands of the design shown in Fig. 1, is substantiated by cyclic voltammetric measurements. All ligands undergo irreversible electrochemical oxidation (Figures S1–S4†). The first anodic peak potential (Epa) of 2b (0.34 V in CH3CN vs. Fc/Fc+, Table 1) is attributed to the fluorophore moiety as it is close to the Epa of the reference compound 4 (0.57 V); whereas the first Epa of 2a (0.65 V) is assigned to the tertiary amino group based on comparison with the published data involving dipicolylamino groups.9,19 The Epa of compound 3, which is the fluorophore of 2a, has a much higher value of 1.31 V.
Table 1.
First anodic peak potentials (Epa relative to Fc/Fc+), fluorescence quantum yields (φf ) and lifetime (τ/ns) of 3, 4, 2a, and 2b and their Zn2+ complexes in CH3 CN.a λex (3 and 2a) = 295 nm, λex (4 and 2b) = 370 nm
| ligand | Epa/V | φf | τ/ns | φZn | τ1/ns | τ2/ns |
|---|---|---|---|---|---|---|
| 3 | 1.31 | 0.32 | 0.53 | 0.53 | 1.96 | — |
| 4 | 0.57 | 0.12 | 0.98 | 0.07 | 0.70 (69.4) | 1.34 (30.6) |
| 2a | 0.65 | 0.01 | NDb | 0.46 | 1.08 (76.8) | 1.98 (23.3) |
| 2b | 0.34 | 0.20 | 1.00 | 0.06 | 1.36 (93.6) | 2.67 (6.39) |
The relative abundances of individual exponentials are in the parentheses.
ND: not determined.
Solvent effect on fluorescence
Normalized emission spectra of compounds 3 and 4 in various organic solvents are displayed in Fig. 5. Emission spectra of 3 have little dependence on solvent. On the other hand, compound 4 exhibits a greater positive solvatochromism.20 The emission energy of 4 decreases rapidly as the polarity and/or the hydrogen bond donating ability of the solvent increases, consistent with emission from a highly polar, charge-transfer-type excited state.21 The Stokes shifts of 3 and 4 in various solvents were plotted against the normalized Reichardt’s ET(30) values (ETN) (Fig. 6).22,23 In agreement with the observations by Tor, Castellano, and others,24,25 the linearities of the two correlations, as determined by the correlation coefficients of the least-squares fits, are slightly better than those of the typical Lippert plots (Fig. S7†).1 The slopes of the modified Lippert plots (Fig. 6) are proportional to the changes of molecular dipole upon photoexcitation (Δμge = μe − μg).22 Therefore, a larger slope represents a greater degree of charge transfer in the excited state. Compound 4 which contains an electron-rich divinylthienyl group, undergoes a greater extent of charge transfer than compound 3.
Fig. 5.
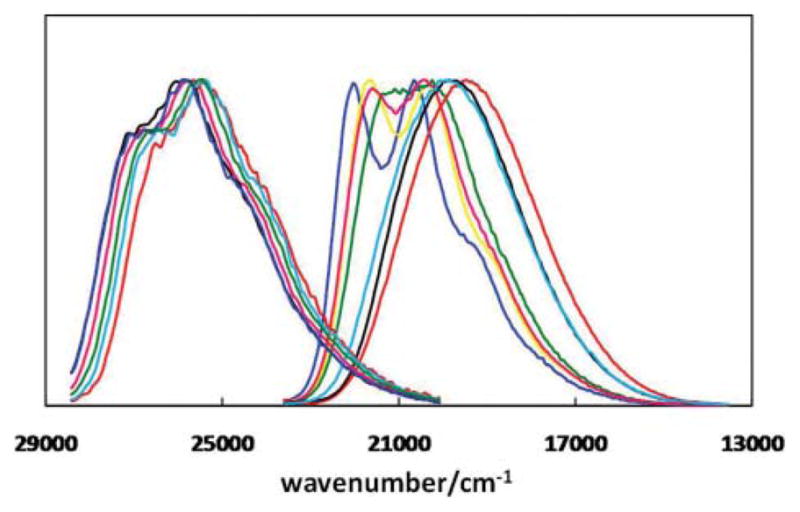
Normalized emission spectra of 3 (clustered on the left) and 4 (right) in various solvents. For the spectra of 4, the colour coding from left to right is the following: blue – cyclohexane (ε = 2.0), yellow – benzene (ε = 2.3), pink – dioxane (ε = 2.2), green – chloroform (ε = 4.8), cyan – DMSO (ε = 46.4), black – acetonitrile (ε = 35.9), and red – methanol (ε = 32.7). ε: relative permittivity.20
Fig. 6.
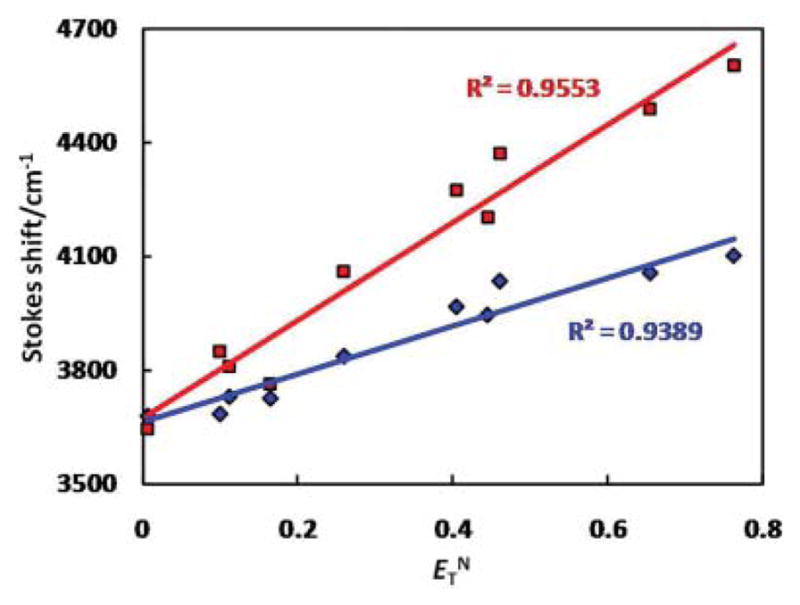
Modified Lippert plots of compounds 3 (blue) and 4 (red). ET N: normalized Reichardt’s ET (30) solvent parameter.
Fluorescence lifetime and quantum yield
A very low fluorescence quantum yield (φf = 0.01) was recorded for ligand 2a in CH3CN. Comparing to that of 3 (0.32) which is the fluorophore of 2a, the incorporation of the DPA group reduces the fluorescence quantum yield by 32-fold, likely via a PET pathway as suggested in the computational analysis. Upon Zn2+ coordination at the saturation level to afford the dizinc complex, the quantum yield of 2a is enhanced by 46-fold to 0.46. The fluorescence quantum yield of 2b (also in CH3CN), where no PET is expected based on the DFT calculations, is 0.20. Upon forming the dizinc complex, the φf, in contrast to 2a, is reduced to 0.06. The model monotopic ligand 4 undergoes a similar reduction of quantum yield from 0.12 to 0.07 upon Zn2+ binding. The Zn2+-coordination-mediated fluorescence quenching of arylvinylbipy fluorophores when the aryl group is highly electron-donating such as in 4 is consistent with our prior observation10 where the reduction of radiative decay constant kr, which is caused by Zn2+-coordination enhanced excited state charge transfer outpaces the reduction of nonradiative decay constant knr when Zn2+ binds.
No lifetime was recorded for 2a due to its very low fluorescence intensity. Coordination to Zn2+ greatly enhances the intensity, and results in a biexponential emission decay trace. The longer component (1.98 ns) is assigned to the emission from the Zn2+-coordinated fluorophore because it is close in value to the lifetime recorded for the Zn2+ complex of the monotopic 3 (1.96 ns). 2b shows monoexponential decay with a lifetime of 1 ns corresponding to emission from the fluorophore as compared to that of ligand 4 (τ = 0.98 ns). A biexponential decay is observed upon formation of the Zn2+-complex of 2b, where τ1 (1.36 ns) is attributed to the Zn2+-bound fluorophore. The longer τ2 is currently unassigned; it may be related to an intramolecular exiplex species resulting from the interaction between the excited fluorophore and the Zn2+-bound DPA group.19
Absorption and emission titration studies
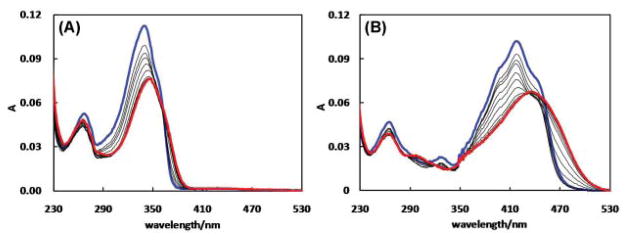
Compound 2a shows a major absorption band at 340 nm (blue in Fig. 7A), which is assigned to the HOMO-1 to LUMO (π–π*) transition. As ZnCl2 is added to the solution, the absorption maximum starts to decrease and transforms into a new band at 348 nm (red, Fig. 7A). On the other hand, 2b shows absorption at a higher wavelength (418 nm, blue in Fig. 7B) which undergoes a larger bathochromic shift to 436 nm (red, Fig. 6B) upon coordination to ZnCl2.
Fig. 7.
Absorption spectra of (A) 2a (2.9 μM) in CH3 CN upon addition of ZnCl2 (0–26 μM) and (B) 2b (1.9 μM) in CH3 CN upon addition of ZnCl2 (0–14 μM). The spectra that were collected at the beginning and the end of a titration experiment are coded blue and red, respectively.
The emission spectra of 2a and 2b are shown in Fig. 8. 2a shows a very weak emission under the irradiation from a handheld UV lamp (λex = 365 nm, see the inset of Fig. 8A). However, as ZnCl2 is added, an enhancement in fluorescence intensity was observed with a bright blue fluorescence being observed under the UV lamp excitation.
Fig. 8.
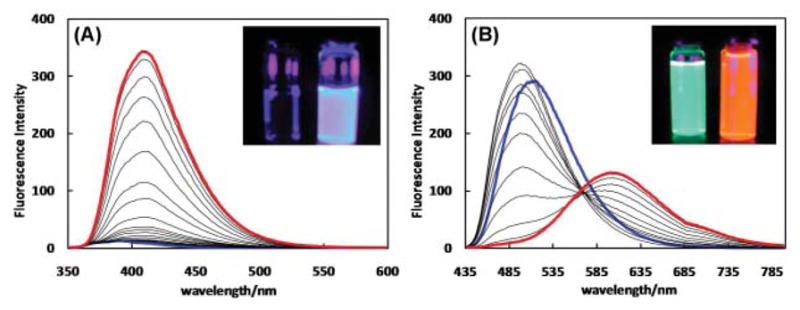
Emission spectra of (A) 2a (2.9 μM) in CH3 CN (λex = 340 nm) upon addition of ZnCl2 (0–33 μM) and (B) 2b (1.9 μM) in CH3 CN (λex = 430 nm) upon addition of ZnCl2 (0–51 μM). The spectra that were collected at the beginning and the end of a titration experiment are coded blue and red, respectively.
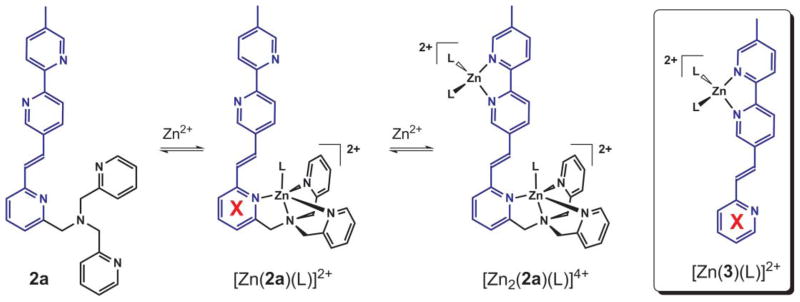
Provided with the knowledge base acquired from the experimental and computational investigations described in the previous sections, the Zn2+-coordination dependent fluorescence of 2a and 2b can be explained. The weak fluorescence of 2a results from an efficient nonradiative PET process from the dipicolylamino (DPA) moiety to the excited fluorophore. The fluorophore has an oxidation potential that is lower than that of the tertiary amino group in DPA, thus providing the thermodynamic driving force for PET. Such an electron transfer occurrence is also supported by computational studies where the HOMO of 2a is mainly localized on the tertiary amino group and HOMO-1 is found as a π orbital extending over the plane of the fluorophore. Upon coordination to Zn2+, the oxidation potential of the DPA group is expected to be lowered, thus reducing the thermodynamic driving force of the fluorescence-quenching PET to result in the enhancement of emission. Along an increasing Zn2+ gradient (Fig. 9), two factors may contribute to the enhancement of fluorescence intensity. One is the blocking of the PET process upon monozinc complex formation. The other is attributed to the coordination of Zn2+ to the bipy-containing fluorophore, which reduces the rotational freedom of the molecule, leading to an additional enhancement in fluorescence quantum yield.
Fig. 9.
Three coordination states of 2a along a Zn2+ gradient. L: coordinating solvent. Note that Zn2+ resides at different ends of the fluorophore in the monozinc complexes of 2a and 3. The red crosses highlight the difference in coordination status of this pyridyl group in the monozinc complexes of ditopic 2a and monotopic 3.
Although a remarkable enhancement in emission is recorded, 2a is not significantly bathochromically shifted upon dizinc complex formation (1000 cm−1, Table 3). The observed behavior can be explained with assistance from the solvatochromic and computational studies of fluorophore 3. Increasing polarity, especially the hydrogen bond donating ability of the solvent, which would specifically interact with the pyridyl nitrogens in 3, does not lead to a significant bathochromic shift in the emission of 3 (Fig. 5). This observation leads to the conclusion that there is only a very modest degree of charge transfer, presumably from the vinylpyridyl to the bipy moiety, upon the excitation of 3. This is supported by little electron density rearrangement between the HOMO and the LUMO of 3 (Fig. 3), when compared to those of fluorophore 4. The placement of the cation Zn2+ at the bipy end of 2a would not significantly affect the stability of a relatively nonpolar excited state structure. Therefore, only a small degree of bathochromic shift was observed when the dizinc complex of 2a was formed.
Table 3.
Positions (λem ) of the lowest energy emission bands and Stokes shifts of both free ligands and their Zn2+ complexes in CH3 CN.a The Zn2+-induced emission band shifts (Δνem/cm−1) are shown in the rightmost column
| ligand | λem (L)/nm | λem (ZnL)/nm | Stokes shift(L)/cm−1 | Stokes shift (ZnL)/cm−1 | Δνem/cm−1 |
|---|---|---|---|---|---|
| 3 | 386 | 420 | 3855 | 4926 | 2097 |
| 4 | 497 | 622 | 4151 | 7179 | 4044 |
| 2a | 392 | 408 | 3902 | 4226 | 1,000 |
| 2b | 510 | 605 | 4,316 | 6407 | 3079 |
L: free ligand; ZnL: Zn(II) complex.
However, monotopic ligand 3 shows a larger emission bathochromic shift upon Zn2+ coordination than that of 2a (Table 3, see also Fig. S12†). The difference can be explained by examining the coordination status of the lone pyridyl group in the fluorophores of 2a and 3 (marked by a red ‘X’ in Fig. 9) over the titration processes. In 2a, the lone pyridyl group is involved in the formation of the monozinc complex, thus leading to the reduction or elimination of the even modest charge-transfer capacity of the pyridylvinyl-bipy excited state. Therefore, the subsequent binding of Zn2+ at the bipy position alters little the energy of the excited state. In the monotopic compound 3, however, the monozinc complex formation occurs at the bipy site with the lone pyridyl group unbound (Fig. 9). Charge transfer, albeit modest, still occurs from the pyridylvinyl group to the bipy site upon excitation which is stabilized by the presence of Zn2+ at the bipy site, leading to the observed bathochromic shift in emission (Fig. S12†).
Ligand 2b, on the other hand, shows an initial minimally blue shifted Zn2+-induced enhancement.8 The emission of 2b is subsequently decreased upon further Zn2+ addition with a significant red shift (3079 cm−1, Table 3) where the emission color changing from green to orange (Fig. 8B, inset). The later rise of emission of 2b centered at 600 nm is due to the coordination of Zn2+ at the bipy site. Opposite to the observations on 2a, the fluorescence quantum yield of 2b suffers reduction when complexed to Zn2+. Such a behavior can be understood from the computational and cyclic voltammetric studies which show that there is no driving force for PET in the free ligand of 2b. The absence of PET is reflected in the recorded monoexponential decay of 2b with lifetime of 1.00 ns, corresponding to emission from the fluorophore. Without the PET pathway in the free ligand of 2b, coordination of Zn2+ at DPA position would not enhance the fluorescence. Rather, there is the possibility of “oxidative photoinduced electron transfer” of the fluorophore, where the Zn2+-bound DPA groups are the electron acceptors from the excited, electron-rich fluorophore.26–28 When the dizinc complex of 2b is formed, Zn2+-coordination at the bipy site significantly enhances the charge-transfer character of the fluorophore, which leads to a lower rate of radiative decay. Both oxidative PET and coordination-enhanced charge-transfer at bipy may contribute to the reduction of the fluorescence quantum yield of 2b when either mono- or dizinc complex is formed.
With the applications of heteroditopic ligands in detecting and quantifying free Zn2+ (unbound with protein molecules or other ligands) in biological systems in mind,30–34 we investigated the Zn2+-dependent fluorescence of 2a under simulated physiological conditions.6,19,35–37 The fluorescence spectra of 2a were collected over an increasing Zn2+ gradient. The free Zn2+ concentrations ([Zn]f) were controlled by a buffering system containing various metal chelators38 and were estimated using “Webmaxc Standard”, a program developed for analyzing buffered metal ion solutions.29 The absorption spectrum of ligand 2a was slightly red shifted (12 nm) at the completion of the titration experiment due to coordination to bipy of the fluorophore (Fig. S10†). Data in Fig. 10 depicts the emission behavior of 2a in an aqueous buffer. A fluorescence quantum yield (φf) of 0.012 was recorded for the free ligand. Addition of Zn2+ results in a dramatic increase in emission. A φf of 0.57 was determined at the saturation level (the red spectrum in Fig. 10), presumably of the dizinc complex. The calibration curve of emission intensity at 400 nm versus [Zn]f shown in the inset reveals that the emission is most sensitive to [Zn]f at log10[Zn]f = −8.7. In a Zn2+ sensing context, 2a may be used for measuring [Zn]f in the nanomolar regime. Encouraged by the large fluorescence enhancement upon Zn2+ coordination, the satisfactory φf of the dizinc complex, and the nanomolar detection range suitable for [Zn]f analysis in mammalian cellular environment,36 2a was evaluated further for its potential in live-cell imaging of Zn2+.
Fig. 10.
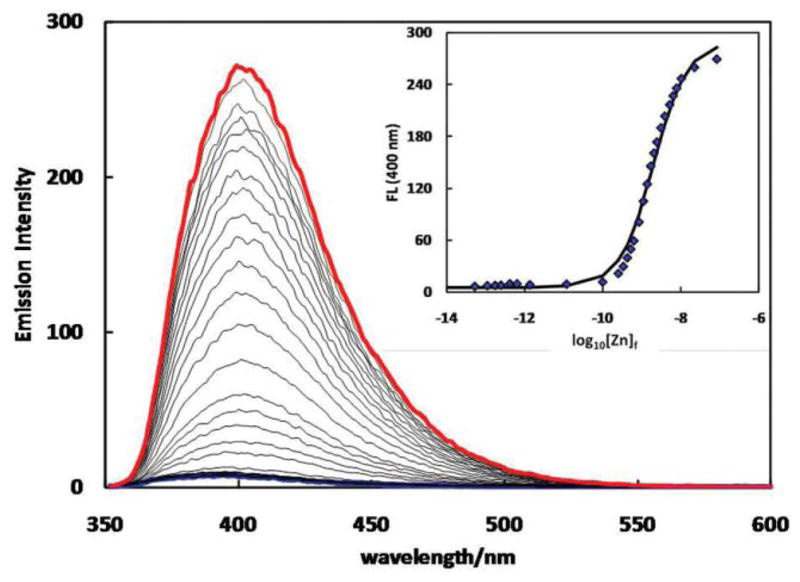
Emission spectra of 2a (6.4 μM, λex = 340 nm) in 10% DMSO-containing aqueous solution (HEPES: 50 mM, pH = 7.4, HEDTA: 2.5 mM, EGTA: 2.5 mM, NTA: 5 mM, KNO3: 100 mM) upon addition of Zn(ClO4 )2 (0–8.8 mM). The spectra that were collected at the beginning and the end of a titration experiment are coded blue and red, respectively. Inset: fluorescence intensity at 400 nm vs. log10 [Zn]f ([Zn]f – free zinc ion concentration, calculated using “Webmaxc Standard”6,29).
Preliminary live cell imaging study
The potential of compound 2a as an indicator to report intracellular free Zn2+ status was investigated in living cells. HeLa cells were incubated in HBSS buffer in the presence of 2a (9.5 μM) for 30 min. After replacement of media to remove the extracellular indicator molecules, the cells were incubated further in HBSS with sodium pyrithione (100 μM), a Zn2+ transporter for facilitating Zn2+ entry through cell membrane,39 in the absence or presence of 100 μM ZnCl2 for 10 min. Over the course of the experiment, no apparent toxicity of 2a was observed based on the lack of cell morphology change.
Fluorescence images of the live cells were acquired using a Q-Max Blue filter set (Omega Filters; excitation 355–405 nm; emission 420–480 nm). When incubated under Zn2+-poor conditions (Fig. 11A–B), the cells displayed weak emission. A control experiment indicates that the emission primarily originates from autofluorescence (Fig. S16†). Under zinc-enriched conditions, the fluorescence was enhanced, albeit moderately. In addition to the increase of overall intensity, cells show heightened nuclear fluorescence signals. The physiological relevance of the zinc status-dependent signal localization is currently under investigation. Because the maximal excitation of 2a occurs in the UV range, the irradiation intensity is severely attenuated by the glass-based optical setup of the fluorescence microscope. As a result, the indicator was inefficiently excited, which led to the observed overall weak fluorescence. Although this work demonstrates the potential utility of our heteroditopic ligand system in fluorescence imaging of intracellular zinc status, it emphasizes the need for indicators that are excited with longer excitation wavelengths, as argued by many investigators for various reasons.33
Fig. 11.
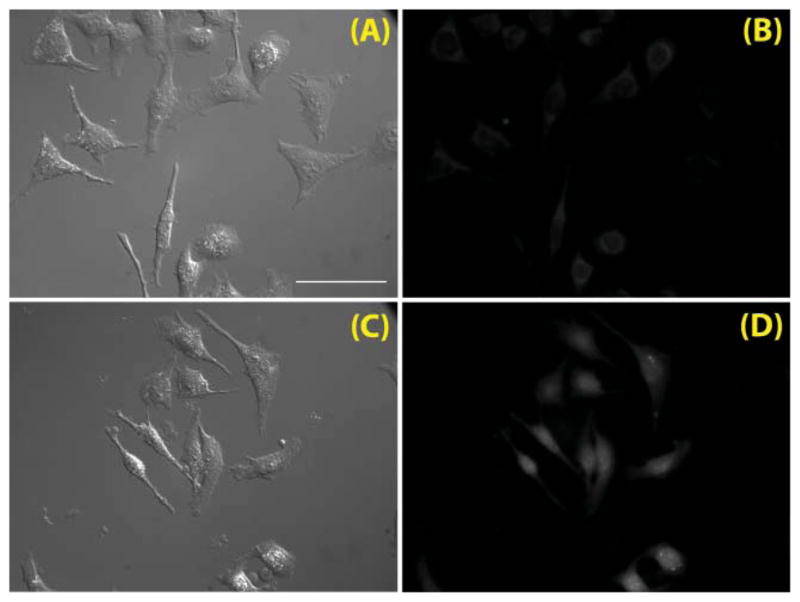
(A) Differential interference contrast (DIC) and (B) fluorescence images (Omega Q-Max Blue filter set; excitation 355–405 nm; emission 420–480 nm) of live HeLa cells loaded with 2a (incubation time 30 min, loading concentration 9.5 μM) in HBSS buffer at 37 °C under 5% CO2. (C) DIC and (D) fluorescence images of live HeLa cells treated under the same conditions in the presence of 100 μM ZnCl2. Scale bar – 50 μm.
Conclusion
A detailed study on fluorescent heteroditopic ligands 2a and 2b is presented. This work was motivated by the challenge to tune structural factors of the heteroditopic ligand framework (Fig. 1) to maximize the fluorescence contrast between non-, mono-, and dizinc coordinated states. We found that the electronic property of the fluorophore in the ditopic ligand exerts opposite effects on the efficiencies of PET and ICT, two photophysical processes that lead to Zn2+-dependent fluorescence modulations. A ditopic ligand containing an electron-poor fluorophore (e.g. 2a) may enjoy a sensitive fluorescence enhancement without much emission band shift upon binding Zn2+. Increasing the electron density of the fluorophore creates a larger Zn2+-induced spectral shift however with the sacrifice of fluorescence enhancement (e.g. in 2b). Therefore, a delicate balance of the electronic structural features of the fluorophore in terms of the charge-transfer character and electron-accepting ability in the excited state is entailed to create a fluorescent heteroditopic system with maximum fluorescence contrast between three coordination states. In order to reduce the dependence of fluorescence contrast of various species on the electronic nature of the fluorophore, new designs of heteroditopic ligand platforms that operate under fundamentally different coordination-mediated photophysical processes are warranted.40
Experimental section
Materials and general methods
Reagents and solvents were purchased from various commercial sources and used without further purification unless otherwise stated. Spectroscopic grade CH3CN was used in titration experiments. All reactions were carried out in oven- or flame-dried glassware in an inert atmosphere of argon. Analytical thin-layer chromatography (TLC) was performed using pre-coated TLC plates with silica gel 60 F254 or with aluminium oxide 60 F254 neutral. Flash column chromatography was performed using 40–63 μm (230–400 mesh) silica gel or alumina (80–200 mesh, pH 9–10) as the stationary phases. 1H and 13C NMR spectra were recorded at 300 MHz and 75 MHz, respectively. All chemical shifts were reported in δ units relative to tetramethylsilane. CDCl3 was treated with alumina gel prior to use.
Synthesis
Syntheses of compounds 5 and 9 were reported previously.8,9
Compound 3
NaH (60% in mineral oil, 4 mmol, 160 mg) was added at 0 °C to a solution of 2-pyridinecarboxaldehyde (234.6 mg, 2.18 mmol) in dry dimethoxyethane (4.0 mL) in a flamed-dried round-bottom flask. The suspension was stirred for 5 min. A solution of 5 (2.18 mmol, 703.9 mg) in dry dimethoxyethane (4.0 mL) was added dropwise to the flask with stirring at 0 °C. The stirring was continued for overnight at rt. The reaction mixture was then cooled to 0 °C before brine (2 mL) was added. The reaction mixture was stirred for another 5 min, and was partitioned between ethyl acetate (EtOAc) and water. The aqueous layer was washed with EtOAc (50 mL × 3) and the organic portions were combined. The organic portions were dried over Na2SO4 followed by solvent removal under vacuum. Compound 3 was isolated using silica chromatography eluted by EtOAc in CH2Cl2 (gradient 0–30%). The isolated yield was 75%. 1H NMR (300 MHz, CDCl3): δ (ppm) 8.82 (s, 1H), 8.64 (d, J = 4.3 Hz, 1H), 8.51 (s, 1H), 8.39 (d, J = 8.3 Hz, 1H), 8.31 (d, J = 8.1 Hz, 1H), 8.04 (dd, J = 8.4, 2.1 Hz, 1H), 7.68 (m, 3H), 7.42 (d, J = 7.8 Hz, 1H), 7.30 (s, 1H), 7.20 (dd, J = 4.4, 2.1 Hz, 1H), 2.41 (s, 3H). 13C NMR (75 MHz, CDCl3): δ (ppm) 154.6, 153.8, 152.1, 148.6, 147.6, 136.4, 135.6, 132.8, 132.4, 130.9, 128.5, 127.7, 121.5, 119.5, 17.3. HRMS (ESI+): calcd. (C18H15N3 +H+) 274.1344, found 274.1338.
Compound 7
2-Methylthiophene (3 mL, 30 mmol) was dissolved in CCl4 (150 mL) and the solution was heated to reflux. Benzoyl peroxide (60 mg, 0.25 mmol) was added to the refluxing mixture. After 5 min another batch of benzoyl peroxide (60 mg, 0.25 mmol) and N-bromosuccinimide (5.34 g, 30 mmol) were added. The solution was refluxed for 1 h. After cooling to rt, the reaction mixture was diluted by hexanes. The precipitate was removed via filtration. Compound 7 was obtained upon solvent removal (5.23 g, 98%). 1H NMR (300 MHz, CDCl3): δ (ppm) 7.33 (d, J = 6.0 Hz, 1H), 7.12 (d, J = 3.0 Hz, 1H), 6.95 (m, 1H), 4.76 (s, 2H).
Compound 8
Compound 7 (5.23 g, 29.5 mmol) was dissolved in triethyl phosphite (10 mL). The mixture was heated at 125 °C for 4 h. The excess of triethyl phosphite was removed under high vacuum in a fume hood. The crude product was isolated by silica chromatography to afford compound 8 (6.60 g, 95%). 1H NMR (300 MHz, CDCl3): δ (ppm) 7.19–7.17 (m, 1H), 6.98–6.95 (m, 2H), 4.08 (m, 4H), 3.37 (d, J = 21 Hz, 2H), 1.31 (m, 6H).
Compound 10
Reaction flask was protected from ambient light using aluminium foil; work-up and purification were carried out under illumination with a red light bulb. NaH (60% in mineral oil, 0.75 mmol, 30 mg) was added at 0 °C to a solution of 9 (58.4 mg, 0.32 mmol) in dry dimethoxyethane (1.0 mL) in a flamed-dried reaction flask. The suspension was stirred for 5 min. A solution of 8 (173.1 mg, 0.73 mmol) in dry dimethoxyethane (1.0 mL) was added dropwise to the reaction flask with stirring at 0 °C. The stirring was continued overnight at rt. The reaction mixture was then cooled to 0 °C before brine (1 mL) was added. The reaction mixture was stirred for another 5 min, and was partitioned between CH2Cl2 and basic brine. The aqueous layer was washed with CH2Cl2 (50 mL × 3) and the organic portions were combined. The organic portions were dried over Na2SO4 followed by solvent removal under vacuum. The residue was purified by silica column to afford compound 10 (21.0 mg, 25%). 1H NMR (300 MHz, CDCl3): δ (ppm) 7.19 (d, J = 4.8 Hz, 1H), 7.05–7.68 (m, 5H), 6.92 (d, J = 3.3 Hz, 1H), 6.08 (s, 1H), 4.18–4.01 (m, 4H); 13C NMR (75 MHz, CDCl3): δ (ppm) 143.5, 142.4, 140.6, 127.8, 126.9, 126.4, 125.7, 124.7, 122.1, 121.6, 100.5, 65.4; HRMS (EI+): calcd. (C13H12O2S2 + H+) 264.0279, found 264.0281.
Compound 11
Reaction flask was protected from ambient light using aluminium foil; work-up and purification were carried out under illumination with a red light bulb. Compound 10 (21 mg, 0.08 mmol) was dissolved in a mixed solvent (5 mL) of 37% HCl–H2O–THF (1 : 6 : 7). The solution was stirred overnight before being partitioned between basified brine (pH > 11) and CH2Cl2 (3 × 50 mL). The organic portions were dried over Na2SO4 before concentration under vacuum. The purity of the product judging by TLC and NMR (1H and 13C) spectra is sufficient for the next step. The yield was quantitative. 1H NMR (300 MHz, CDCl3): δ (ppm) 9.86 (s, 1H), 7.66 (d, J = 4.2 Hz, 1H), 7.31–7.26 (m, 2H), 7.16 (d, J = 3.6 Hz, 1H), 7.12 (d, J = 4.2 Hz, 1H), 7.05 (t, J = 1.8 Hz, 1H), 7.01 (d, J = 9.6 Hz, 1H); 13C NMR (75 MHz, CDCl3): δ (ppm) 182.6, 152.2, 141.6, 141.5, 137.4, 128.3, 128.2, 126.6, 126.4, 126.0, 120.4; HRMS (ESI+): calcd. (C11H8OS2 + Na+) 242.9914, found 242.9913.
Compound 4
Reaction flask was protected from ambient light using aluminium foil; work-up and purification were carried out under illumination with a red light bulb. NaH (60% in mineral oil, 0.4 mmol, 16 mg) was added at 0 °C to a solution of 11 (21.3 mg, 0.09 mmol) in dry dimethoxyethane (0.5 mL) in a flamed-dried reaction flask. The suspension was stirred for 5 min. A solution of 5 (32 mg, 0.10 mmol) in dry dimethoxyethane (0.5 mL) was added dropwise to the reaction flask with stirring at 0 °C. The stirring was continued overnight at rt. The reaction mixture was then cooled to 0 °C before brine (1 mL) was added. The reaction mixture was stirred for another 5 min, and was partitioned between CH2Cl2 and basified brine (pH > 11). The aqueous layer was washed with CH2Cl2 (20 mL × 3) and the organic portions were combined. The organic portions were dried over Na2SO4 followed by solvent removal under vacuum. The residue was purified using silica chromatography eluted by EtOAc in CH2Cl2 (gradient 0–15%). The isolated product (34.3 mg, 92%) was further purified by precipitation from a CH2Cl2 solution by addition of hexanes to afford pure compound 4 (18.9 mg, 51%). 1H NMR (300 MHz, CDCl3): δ (ppm) 8.62 (s, 1H), 8.43 (s, 1H), 8.27 (d, J = 8.3 Hz, 1H), 8.22 (d, J = 8.1 Hz, 1H), 7.82 (dd, J = 2.1, 8.4 Hz, 1H), 7.54 (d, J = 8.3 Hz, 1H), 7.23–7.12 (m, 3H), 6.91 (m, 6H), 2.32 (s, 3H). 13C NMR (75 MHz, CDCl3): δ (ppm) 149.9, 148.1, 142.5, 142.4, 141.4, 137.6, 133.6, 133.3, 132.6, 128.3, 127.9, 127.3, 126.6, 124.9, 124.7, 123.9, 122.3, 121.5, 120.9, 120.8, 18.6. HRMS (ESI+): calcd. (C23H18N2S2+H+) 387.0990, found 387.0995.
Compound 12
Reaction flask was protected from ambient light using aluminium foil; work-up and purification were carried out under illumination with a red light bulb. NaH (60% in mineral oil, 15 mmol, 600 mg) was added at 0 °C to a solution of 2-thiophenecarboxaldehyde (4.3 mmol, 400 μL) in dry dimethoxyethane (5 mL) in a flamed-dried reaction flask. The suspension was stirred for 10 min. A solution of 8 (2 g, 4.23 mmol) in dry dimethoxyethane (5 mL) was added dropwise to the reaction flask with stirring at 0 °C. The stirring was continued overnight at rt. The reaction mixture was then cooled to 0 °C before brine (10 mL) was added. The reaction mixture was stirred for another 5 min, and was partitioned between CH2Cl2 and water. The aqueous layer was washed with CH2Cl2 (50 mL × 3) and the organic portions were combined. The organic portions were dried over Na2SO4 followed by solvent removal under vacuum. The residue was purified by silica column to afford pure 12 (722 mg, 88%). 1H NMR (300 MHz, CDCl3): δ (ppm) 7.16 (d, J = 8.0 Hz, 2H), 7.48 (m, 4H), 7.0 (m, 2H); 13C NMR (75 MHz, CDCl3): δ (ppm) 142.6, 127.9, 126.2, 124.5, 121.7.
Compound 13b
POCl3 (1.5 mL) was added dropwise into a solution of compound 12 (300 mg, 1.56 mmol) in DMF (1.5 mL) in a flamed-dried reaction flask at 0 °C. During the addition, the temperature was kept below 10 °C, after which the mixture was stirred for 30 min at rt before being heated at 90–95 °C for 45 min. After cooling down, the mixture was poured into crushed ice (50 mL), and made weakly alkaline with a NaOH solution (1 M). After partitioned between CH2Cl2 and water, the organic layer was dried over Na2SO4. The solvent was removed under vacuum and the residue was chromatographed (silica, hexanes–CH2Cl2 from 2 : 1 to 1 : 2) to afford compound 13b (381 mg, 98%). 1H NMR (300 MHz, CDCl3): δ (ppm) 9.89 (s, 2H), 7.69 (d, J = 4.0 Hz, 2H), 7.24 (m, 4H); 13C NMR (75 MHz, CDCl3): δ (ppm) 182.8, 150.4, 143.0, 137.2, 128.4, 124.7.
Compound 14b
A round-bottom flask charged with 13b (154 mg, 0.62 mmol) and ethylene glycol (35 μL, 0.62 mmol) in benzene (12 mL) was equipped with a Dean–Stark tube (5 mL). Catalytic amount of TsOH was added and the reaction mixture was stirred for 5 h under reflux. After the reaction mixture was cooled to rt, solvent was removed and the residue was partitioned between CH2Cl2 and a NaHCO3 solution (0.1 M). The organic portion was separated and dried over Na2SO4 before solvent was removed under vacuum. The crude product was chromatographed (silica, hexanes–CH2Cl2 from 1 : 1 to 1 : 9) to afford a mixture of compound 14b and starting material, which was used directly to the next step.
Compound 15b
Reaction flask was protected from ambient light using aluminium foil; work-up and purification were carried out under illumination with a red light bulb. Di-(2-picolyl)amine (51 μL) was added dropwise into a 1,2-dichloroethane (2.3 mL) solution of 14b from the previous step (80 mg). The reaction mixture was stirred overnight before the addition of sodium triacetoxyborohydride (183 mg, 0.86 mmol). The mixture was stirred for another 2 h before the solvent was removed under vacuum. The residue was washed with basified brine (pH = 11) and extracted with CH2Cl2 (3 × 25 mL). The organic portions were dried over K2CO3 before being concentrated under vacuum. Compound 15b (38 mg) was isolated by alumina chromatography (CH2Cl2–EtOAc from 10 : 1 to 1 : 1). 1H NMR (300 MHz, CDCl3) δ (ppm) 8.52 (d, J = 3.0 Hz, 2H), 7.72–7.65 (m, 4H), 7.19–7.15 (m, 2H), 7.03 (d, J = 3.0 Hz, 1H), 6.96 (s, 2H), 6.90 (d, J = 3.0 Hz, 1H), 6.87–6.84 (m, 2H), 6.05 (s, 1H), 4.15 (m, 2H), 4.05 (m, 2H), 3.85 (s, 6H); 13C NMR (75 MHz, CDCl3): δ (ppm) 159.6, 149.1, 144.5, 140.8, 136.8, 126.2, 125.6, 122.9, 122.3, 100.7, 65.4, 59.9, 53.5; HRMS (ESI+): calcd. (C26H25N3O2S2 + Na+) 498.1286, found 498.1272.
Compound 16b
Reaction flask was protected from ambient light using aluminium foil; work-up and purification were carried out under illumination with a red light bulb. Compound 15b (38 mg, 0.08 mmol) was dissolved in a mixed solvent (10 mL) of 37% HCl–H2O–THF (1 : 6 : 7). The solution was stirred overnight before partitioned using basified brine (pH = 11) and CH2Cl2 (3 × 25 mL). The organic portions were dried over K2CO3 before being concentrated under vacuum. The crude compound 16b (34 mg, 100%) was pure enough to use in the next step. 1H NMR (300 MHz, CDCl3): δ (ppm) 9.85 (s, 1H), 8.53 (d, J = 4.8 Hz, 2H), 7.67–7.65 (m, 4H), 7.25–7.16 (m, 4H), 7.11 (d, J = 3.6 Hz, 1H), 7.00 (d, J = 4.2 Hz, 1H), 6.96 (d, J = 7.8 Hz, 1H), 6.88 (d, J = 3.0 Hz, 1H), 3.87 (s, 4H), 3.85 (s, 2H). 13C NMR (75 MHz, CDCl3): δ (ppm) 182.6, 159.5, 149.3, 144.8, 141.6, 140.9, 137.4, 136.8, 128.3, 127.1, 126.4, 126.3, 123.0, 122.4, 119.9, 59.9, 53.5; HRMS (ESI+): calcd. (C24H21N3OS2 + Na+) 454.1024, found 454.1016.
Compound 2b
Reaction flask was protected from ambient light using aluminium foil; work-up and purification were carried out under illumination with a red light bulb. NaH (60% in mineral oil, 14 mg, 0.35 mmol) was added to a solution of 16b (37.4 mg, 0.09 mmol) in anhydrous dimethoxyethane (0.5 mL) in the reaction flask. The suspension was stirred for 8 min. The flask was cooled in an ice bath (0 °C) and a solution of 5 (28 mg, 0.09 mmol) in anhydrous dimethoxyethane (0.5 mL) was added dropwise. The reaction was stirred overnight before icy brine was added to quench the reaction. The reaction mixture was partitioned between CH2Cl2 and basified brine (pH = 11). The organic layer was dried over Na2SO4, followed by solvent removal under vacuum. The residue was chromatographed on alumina gel by using 10% EtOAc in CH2Cl2. The isolated product (41.1 mg, 76%) was precipitated from a CH2Cl2 solution by addition of hexanes to afford pure trans-2b (6.4 mg, 12%). 1H NMR (300 MHz, CDCl3): δ (ppm) 8.69 (s, 1H), 8.54–8.50 (m, 3H), 8.34 (d, J = 8.1 Hz, 1H), 8.29 (d, J = 8.0 Hz, 1H), 7.91 (d, J = 8.3 Hz, 1H), 7.74–7.61 (m, 5H), 7.29 (2H), 7.17 (t, J = 5.3 Hz, 2H), 7.01–3.86 (m, 7H), 3.86 (s, 6H), 2.40 (s, 2H). 13C NMR (75 MHz, CDCl3): δ (ppm) 159.6, 155.2, 149.9, 149.2, 148.1, 141.9, 137.7, 136.8, 133.3, 128.4, 127.1, 126.9, 124.5, 123.9, 122.9, 122.7, 122.3, 121.0, 120.9, 120.8, 59.9, 53.6, 18.6. HRMS (ESI+): calcd. (C36H31N5S2 + H+) 598.2099, found 598.2086.
Compound 14a
A round-bottom flask charged with 2,6-pyridinedicarboxaldehyde (590.4 mg, 4.37 mmol) and ethylene glycol (243 μL, 4.35 mmol) in benzene (22 mL) was equipped with a Dean–Stark tube (5 mL). Catalytic amount of TsOH was added and the reaction mixture was stirred for 5 h under reflux. After the reaction mixture was cooled to rt, solvent was removed and the residue was partitioned between CH2Cl2 and NaHCO3 (0.1 M). The organic portion was separated and dried over Na2SO4 before solvent was removed under vacuum. The crude product was chromatographed (silica, CH2Cl2) to afford 14a (152.6 mg, 20%). 1H NMR (300 MHz, CDCl3): δ (ppm) 10.12 (s, 1H), 7.98 (d, J = 5.4 Hz, 1H), 7.95 (d, J = 5.4 Hz, 1H), 7.79 (dd, J = 1.8, 7.2 Hz, 1H), 5.95 (s, 1H), 4.25–4.11 (m, 4H); 13C NMR (75 MHz, CDCl3): δ (ppm) 193.4, 158.1, 152.5, 138.1, 125.1, 121.8, 103.3, 65.9.
Compound 15a
Di-(2-picolyl)amine (76 μL, 0.42 mmol) was added dropwise into a 1,2-dichloroethane (3 mL) solution of 14a (55 mg, 0.30 mmol). The reaction mixture was stirred overnight before the addition of sodium triacetoxyborohydride (260 mg, 1.23 mmol). The reaction mixture was stirred for another 6 h. Brine (1 mL) was added to quench the reaction. The reaction mixture was diluted with water and carefully basified to pH 11. The basified aqueous portion was extracted with CH2Cl2 (50 mL × 3). The organic portions were combined and dried over K2CO3. The solvent was removed and the residue was chromatographed on alumina gel by using 10% EtOAc in CH2Cl2 to afford 15a (63.1 mg, 58%). 1H NMR (300 MHz, CDCl3): δ (ppm) 8.53 (d, J = 4.8 Hz, 2H), 7.21–7.57 (m, 6H), 7.41 (d, J = 7.8 Hz, 1H), 7.16–7.13 (m, 2H), 5.83 (s, 1H), 4.20–4.06 (m, 4H), 3.92 (s, 2H), 3.89 (s, 4H); 13C NMR (75 MHz, CDCl3): δ (ppm) 159.5, 159.4, 156.5, 149.2, 137.3, 136.5, 123.1, 123.1, 122.1, 118.8, 103.9, 65.6, 60.3, 60.2; HRMS (ESI+): calcd. (C21H22N4O2 + Na+) 385.1640, found 385.1627.
Compound 16a
Compound 15a (63 mg, 0.17 mmol) was dissolved in a mixed solvent (5 mL) of 37% HCl–H2O–THF (1 : 6 : 7). The solution was stirred for 3 days before partitioned using basified brine (pH = 11) and CH2Cl2 (3 × 25 mL). The organic portions were dried over K2CO3 before concentrated under vacuum. The residue was chromatographed (alumina, CH2Cl2–EtOAc from 10 : 1 to 1 : 1) to afford 16a (21.6 mg, 40%). 1H NMR (300 MHz, CDCl3): δ (ppm) 10.04 (s, 1H), 8.54 (d, J = 4.2 Hz, 2H), 7.82 (s, 2H), 7.69–7.54 (m, 5H), 7.18–7.13 (m, 2H), 4.00 (s, 2H), 3.93 (s, 4H).
Compound 2a
Reaction flask was protected from ambient light using aluminium foil; work-up and purification were carried out under illumination with a red light bulb. NaH (60% in mineral oil, 11 mg, 0.28 mmol) was added to a solution of 16a (21.6 mg, 0.067 mmol) in anhydrous dimethoxyethane (0.5 mL) in the reaction flask. The suspension was stirred for 8 min. The flask was cooled in an ice bath (0 °C) and a solution of 3 (30.3 mg, 0.09 mmol) in anhydrous dimethoxyethane (0.5 mL) was added dropwise. The reaction was stirred overnight before icy brine was added to quench the reaction. The reaction mixture was partitioned between CH2Cl2 and basified brine (pH = 11). The organic layer was dried over Na2SO4, followed by solvent removal under vacuum. The residue was chromatographed on alumina gel by using 10% EtOAc in CH2Cl2. The isolated product was precipitated from a CH2Cl2 solution by addition of hexanes to afford pure trans-2a (14.9 mg, 46%). 1H NMR (300 MHz, CDCl3): δ (ppm) 8.81 (d, J = 1.8 Hz, 1H), 8.55 (d, J = 4.8 Hz, 1H), 8.52 (s, 1H), 8.38 (d, J = 8.4 Hz, 1H), 8.31 (d, J = 8.4 Hz, 1H), 8.02 (dd, J = 1.8, 8.4 Hz, 1H), 7.71–7.63 (m, 7H), 7.50 (d, J = 7.8 Hz, 1H), 7.29–7.18 (m, 3H), 7.18–7.14 (m, 2H), 3.95 (s, 6H), 2.41 (s, 3H); 13C NMR (75 MHz, CDCl3): δ (ppm) 159.8, 155.9, 154.6, 153.6, 145.0, 149.4, 148.8, 137.6, 137.2, 136.6, 134.2, 133.7, 132.4, 130.3, 129.0, 123.2, 122.2, 121.9, 120.9, 120.9, 120.8, 60.5, 60.5, 18.6; HRMS (ESI+): calcd. (C31H28N6 + Na+) 507.2273, found 507.2255.
X-Ray crystallography
A very irregular crystal of 2b was mounted on a nylon loop with the use of heavy oil. The sample was held at −120 °C for data collection. Full data were taken on a Bruker SMART APEX diffractometer using a detector distance of 5 cm. The number of frames taken was 2400 using 0.3 degree omega scans with 20 s of frame collection time with a final 50 frames taken to check for decomposition. Only crystals that exhibited non-mereohedral twinning were found. The data were indexed using CELL_NOW and integrated using the program SAINT which is part of the Bruker suite of programs. Absorption corrections and the preparation of HKL4 and HKL5 files were done using TWINABS. XPREP was used to obtain an indication of the space group and the structure was solved by direct methods and refined by SHELXTL. The non hydrogen atoms were refined anisotropically and the hydrogens were assigned as a riding model. Owing to the small size of the best crystal that could be found, reflections were not found at as high an angle as we would have liked.‡
Supplementary Material
Acknowledgments
This work was supported, in part, by a New Investigator Research grant from the James and Esther King Biomedical Research Program administered by the Florida Department of Health (08KN-16), National Science Foundation (CHE-0809201), and National Institute of General Medical Sciences (R01GM-081382). The authors also thank Chris Murphy at NHMFL for assistance in live cell fluorescence imaging experiments.
Footnotes
Electronic supplementary information (ESI) available: Additional experimental procedures; cyclic voltammograms; Frontier molecular orbital diagrams, additional spectra and lifetime traces. CCDC reference number 786092. For ESI and crystallographic data in CIF or other electronic format see DOI: 10.1039/c0ob00482k
Crystallographic data of 2b: C36 H31 N5 S2, MW = 597.78, Triclinic, P1̄ ( Z = 2), a = 6.2947(10) Å, b = 9.8820(12) Å, c = 25.1671(19) Å, α = 86.318(5)°, β = 83.519(6)°, γ = 81.658(7)°, V = 1537.2(3) Å3, T = 153 K, 2148 unique reflections, Observed data with I > 2σ(I) = 2091, R1 =0.0378, wR2 = 0.0996.
Contributor Information
Lu Zhang, Email: lzhu@chem.fsu.edu.
Michael W. Davidson, Email: davidson@magnet.fsu.edu.
Notes and references
- 1.Lakowicz JR. Principles of Fluorescence Spectroscopy. Vol. 19. Springer; 2006. Fluorescence Sensing. [Google Scholar]
- 2.Valeur B. Molecular Fluorescence. Principles and Applications. Vol. 10. Wiley-VCH; 2002. Fluorescent Molecular Sensors of Ions and Molecules. [Google Scholar]
- 3.de Silva AP, Gunaratne HQN, Gunnlaugsson T, Huxley AJM, McCoy CP, Rademacher JT, Rice TE. Chem Rev. 1997;97:1515–1566. doi: 10.1021/cr960386p. [DOI] [PubMed] [Google Scholar]
- 4.Anslyn EV. Tetrahedron. 2004;60:11055–11056. [Google Scholar]
- 5.de Silva AP, Tecilla P. J Mater Chem. 2005;15:2637–2639. [Google Scholar]
- 6.Zhang L, Murphy CS, Kuang G-C, Hazelwood KL, Constantino MH, Davidson MW, Zhu L. Chem Commun. 2009:7408–7410. doi: 10.1039/b918729d. [DOI] [PubMed] [Google Scholar]
- 7.Zhu L, Zhang L, Younes AH. Supramol Chem. 2009;21:268–283. [Google Scholar]
- 8.Zhang L, Clark RJ, Zhu L. Chem–Eur J. 2008;14:2894–2903. doi: 10.1002/chem.200701419. [DOI] [PubMed] [Google Scholar]
- 9.Zhang L, Zhu L. J Org Chem. 2008;73:8321–8330. doi: 10.1021/jo8015083. [DOI] [PubMed] [Google Scholar]
- 10.Younes AH, Zhang L, Clark RJ, Zhu L. J Org Chem. 2009;74:8761–8772. doi: 10.1021/jo901889y. [DOI] [PubMed] [Google Scholar]
- 11.de Silva AP, Moody TS, Wright GD. Analyst. 2009;134:2385–2393. doi: 10.1039/b912527m. [DOI] [PubMed] [Google Scholar]
- 12.Mallegol T, Gmouh S, Meziane MAM, Blanchard-Desce M, Mongin O. Synthesis. 2005;11:1771–1774. [Google Scholar]
- 13.Zhang L, Whitfield WA, Zhu L. Chem Commun. 2008:1880–1882. doi: 10.1039/b719644j. [DOI] [PubMed] [Google Scholar]
- 14.Newkome GR, Nayak A, Fronczek F, Kawato T, Taylor HCR, Meade L, Mattice W. J Am Chem Soc. 1979;101:4472–4477. [Google Scholar]
- 15.Hanan GS, Lehn J-M, Kyritsakas N, Fischer J. J Chem Soc, Chem Commun. 1995:765–766. [Google Scholar]
- 16.Jouvenot D, Glazer EC, Tor Y. Org Lett. 2006;8:1987–1990. doi: 10.1021/ol060253i. [DOI] [PMC free article] [PubMed] [Google Scholar]
- 17.Parson WW. Modern Optical Spectroscopy: With Examples from Biophysics and Biochemistry. Springer-Verlag; Berlin Heidelberg: 2007. [Google Scholar]
- 18.Valeur B. Molecular Fluorescence Principles and Applications. Wiley-VCH; 2002. [Google Scholar]
- 19.Michaels HA, Murphy CS, Clark RJ, Davidson MW, Zhu L. Inorg Chem. 2010;49:4278–4287. doi: 10.1021/ic100145e. [DOI] [PubMed] [Google Scholar]
- 20.Reichardt C. Solvents and Solvent Effects in Organic Chemistry. VCH; Weinheim: 1988. [Google Scholar]
- 21.Suppan P, Ghoneim N. Solvatochromism. The Royal Society of Chemistry; 1997. [Google Scholar]
- 22.Ravi M, Samanta A, Radhakrishnan TP. J Phys Chem. 1994;98:9133–9136. [Google Scholar]
- 23.Ravi M, Samanta A, Radhakrishnan TP. J Chem Soc, Faraday Trans. 1995;91:2739–2742. [Google Scholar]
- 24.Sinkeldam RW, Tor Y. Org Biomol Chem. 2007;5:2523–2528. doi: 10.1039/b707719j. [DOI] [PubMed] [Google Scholar]
- 25.Butler RS, Cohn P, Tenzel P, Abboud KA, Castellano RK. J Am Chem Soc. 2009;131:623–633. doi: 10.1021/ja806348z. [DOI] [PubMed] [Google Scholar]
- 26.de Silva AP, de Silva SA, Dissanayake AS, Sandanayake KRAS. J Chem Soc, Chem Commun. 1989:1054–1056. [Google Scholar]
- 27.de Silva AP, Gunaratne HQN, Lynch PLM. J Chem, Soc, Perkin Trans. 1995;2:685–690. [Google Scholar]
- 28.Ueno T, Urano Y, Setsukinai K-i, Takakusa H, Kojima H, Kikuchi K, Ohkubo K, Fukuzumi S, Nagano T. J Am Chem Soc. 2004;126:14079–14085. doi: 10.1021/ja048241k. [DOI] [PubMed] [Google Scholar]
- 29.Patton C, Thompson S, Epel D. Cell Calcium. 2004;35:427–431. doi: 10.1016/j.ceca.2003.10.006. [DOI] [PubMed] [Google Scholar]
- 30.Jiang P, Guo Z. Coord Chem Rev. 2004;248:205–229. [Google Scholar]
- 31.Kikuchi K, Komatsu H, Nagano T. Curr Opin Chem Biol. 2004;8:182–191. doi: 10.1016/j.cbpa.2004.02.007. [DOI] [PubMed] [Google Scholar]
- 32.Dai Z, Canary JW. New J Chem. 2007;31:1708–1718. [Google Scholar]
- 33.Que EL, Domaille DW, Chang CJ. Chem Rev. 2008;108:1517–1549. doi: 10.1021/cr078203u. [DOI] [PubMed] [Google Scholar]
- 34.Nolan EM, Lippard SJ. Acc Chem Res. 2009;42:193–203. doi: 10.1021/ar8001409. [DOI] [PMC free article] [PubMed] [Google Scholar]
- 35.Huang S, Clark RJ, Zhu L. Org Lett. 2007;9:4999–5002. doi: 10.1021/ol702208y. [DOI] [PubMed] [Google Scholar]
- 36.Krę,żel A, Maret W. JBIC, J Biol Inorg Chem. 2006;11:1049–1062. doi: 10.1007/s00775-006-0150-5. [DOI] [PubMed] [Google Scholar]
- 37.Bozym RA, Thompson RB, Stoddard AK, Fierke CA. ACS Chem Biol. 2006;1:103–111. doi: 10.1021/cb500043a. [DOI] [PubMed] [Google Scholar]
- 38.Fahrni CJ, O’Halloran TV. J Am Chem Soc. 1999;121:11448–11458. [Google Scholar]
- 39.Forbes IJ, Zalewski PD, Hurst NP, Giannakis C, Whitehouse MW. FEBS Lett. 1989;247:445–447. doi: 10.1016/0014-5793(89)81388-2. [DOI] [PubMed] [Google Scholar]
- 40.See a preliminary study on a new heteroditopic design: Wandell RJ, Younes AH, Zhu L. New J Chem. 2010 doi: 10.1039/c0nj00241k.
Associated Data
This section collects any data citations, data availability statements, or supplementary materials included in this article.


