Abstract
Background:
Age- and gender-specific percentiles of body mass index in children and adolescents are a cornerstone categorizing overweight and obesity in youths worldwide. Since corresponding worldwide growth curves of percent body fat (% BF) are missing, the purpose was to contribute smoothed percentiles of percentage body fat from a large urban sample of German youths and to include them in actual national and international percentile curves.
Methods:
We estimated % BF in 22 113 German youths aged 3 to 18 years participating in yearly cross-sectional surveys of the PEP Family Heart Study Nuremberg between 1993 and 2007. Percentage body fat was calculated from skinfold thickness using Slaughter equations. Ten smoothed percentile curves were constructed for % BF using the LMS method significant.
Results:
The age- and gender-specific reference curves demonstrate a continuous age-dependent increase of percentage body fat from age 3 to 18 years in girls; whereas in boys, the percentile curves steeply increase from 5 to 11 years and thereafter slightly decrease. The shape of the percentile curves, the maxima among boys at puberty and the median % BF at age 18 years are consistent with most of the current growth curves. % BF in urban studies seems to be lower than in national surveys .
Conclusions:
More than these nine studies should contribute to worldwide-standardized growth charts for % BF to better define overweight and obesity in youth.
Keywords: Youths, Germany, international comparison, percentage body fat, reference curves
INTRODUCTION
Body mass index (BMI) has become a cornerstone for categorization of overweight and obesity in youths after the global introduction of age- and gender-specific growth curves.[1,2] However, BMI does not distinguish between fat and lean body mass, which might provide misleading data on body fat content during growth and development, after physical training, and among different ethnicities.[3,4] Skinfold thickness (SFT) measurement is considered a better predictor of body fat (BF) than BMI and can improve screening for adiposity in childhood by increasing the low sensitivity of BMI.[5–7] Age- and gender-specific percentile curves for body fat in children and adolescents from as many countries and ethnicities are the first step for global categorization of elevated body fat as demonstrated for elevated BMI in terms of overweight and obesity.[1] At present, percentiles of body fat in children and adolescents are published using different methods for assessment of body fat.[8–15]
The purpose of this study was to present age- and gender-specific percentiles of percentage body fat (% BF) in 22 113 German children and adolescents and to compare them with eight national and international studies from five countries.
METHODS
Study population
Every school year from 1993/1994 to 2007/2008, we collected cross-sectional data of 22 113 children and adolescents (11,357 males and 10 756 females) aged 3 to 18 years who participated in the Prevention Education Program (PEP) Family Heart Study.[16–18] At the beginning of each school year, we used the parent evenings in the 53 elementary schools of Nuremberg (Germany) for a short information of parents/guardians and first graders about this long-term cross-sectional study. The families deciding to participate free of charge in the PEP Family Heart Study contacted later on the PEP office in the Sanitary Board of the City of Nuremberg for detailed information and written informed consent. Ninety-four percent of all elementary schools participated in this community-wide project on detection and improvement of cardiovascular risk factors by family-based lifestyle-modification. Therefore, self-reported cardiovascular, metabolic, endocrine, and malignant disorders and medication were exclusion criteria. To avoid ethnic bias, we analyzed in this study only data from children and adolescents with German mothers and fathers, thus excluding 2.6% of the participants from 17 other self-identified pure or mixed ethnic groups. The ethical committee of the medical faculty of the Ludwig Maximilians University of Munich (Germany), the Bavarian Ministry of Science and Education, and the local school authorities approved PEP, which fulfilled the criteria of the Declaration of Helsinki.
Anthropometry
At each survey, trained qualified examiners from the PEP staff performed all structured interviews and measurements in the households using standardized equipment as described previously.[16–18] The same individuals made all anthropometric measurements to obviate inter-observer variation during one survey. We measured height and weight using a portable stadiometer (Fa. Holtain Ltd, UK) and a digital electronic scale (SECA, Hamburg, Germany), and triceps and sub-scapular SFT using a Holtain skinfold caliper (GPM-caliper, Zurich, Switzerland) on the left body side in triplicate to the nearest 0.1 mm). The coefficients of variation ranged between 2.0% and 5.4% for triceps SFT and between 3.3% and 5.4% for sub-scapular SFT. Concerning SFT, 14 boys (9 for sub-scapular and 5 triceps SFT) and six girls (sub-scapular SFT) and concerning percentage body fat 24 boys and 28 girls were excluded as outliers with values beyond approximately ± 5 SD using box-plots.
Statistical analysis
We estimated percentage body fat from the sum of sub-scapular (subsc) and triceps (tric) SFT (mm) according to the Slaughter equations[19] using the following syntax:
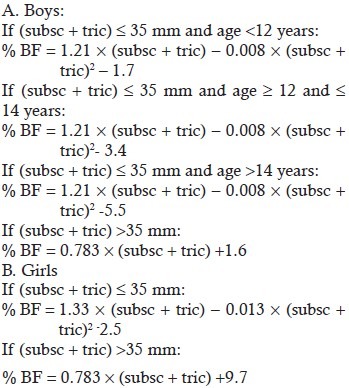
Because assessment of biological maturity status was not accepted by parents/caregivers in the written informed consent of the study protocol, we applied the estimates from NHANES III for boys aged <12.0 years as prepubescent, 12.0-13.99 years as pubescent, and aged >14.0 years as postpubescents.[20] BMI-for-age was categorized normal (<85th percentile), overweight (85th to <95th percentile), and obese (≥95th percentile).[21]
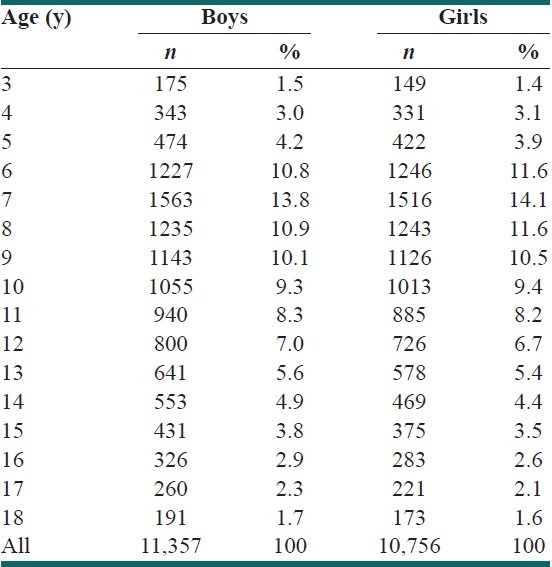
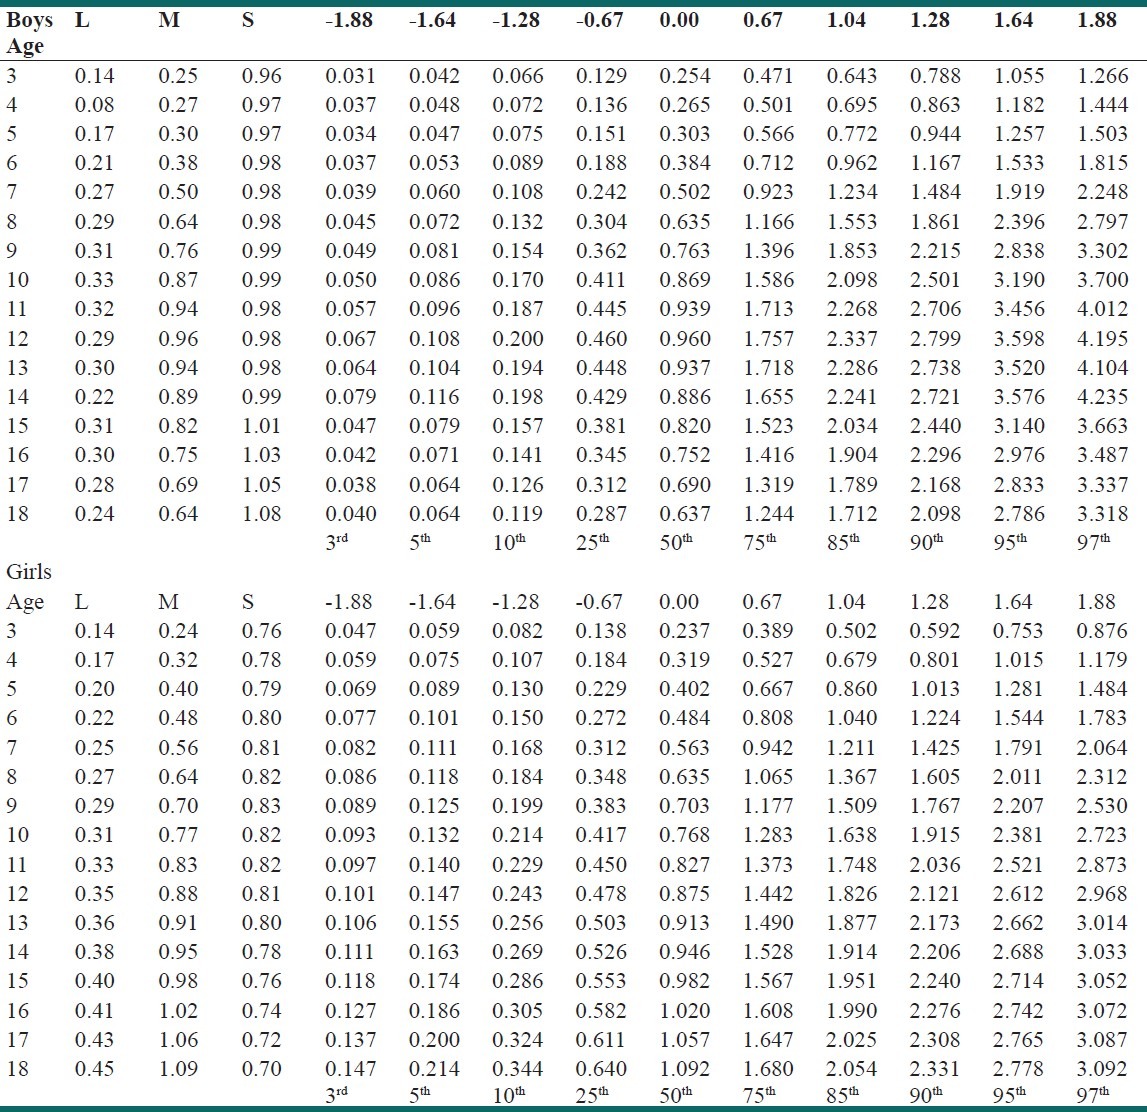
We developed age- and gender-specific reference curves for 22 113 youths using the LMS method (LMS Chartmaker Pro, version 2.3) estimating the skewness parameter L, the median M, and a measure of variation S and excluding outlaying values <3rd and <97th percentiles by winsorization.[22,23] Table 1 displays the number and age distribution of the 3-18-year-old boys and girls. For statistical analysis, we used SPSS 17.0 version for windows (SPSS Inc, Chicago, IL), P values of <0.05 were considered significant.
Table 1.
Number and age-distribution of 11,357 boys and 10,756 girls
RESULTS
Age- and gender-specific % BF percentiles and the corresponding growth curves among 11,357 boys and 10,756 girls aged 3 to 18 years demonstrate that the median percentage body fat is considerably higher in females than in males [Table 2 and Figure 1]. In boys, especially the upper percentile curves steeply increase between age 5 and 11 years and decrease after the peak throughout adolescence from median 14.3% to 11.7% at age 18 years. In girls, % BF increases continuously from median 13.3% at age 3 years through childhood and adolescence to median 23.1 % BF at age 18 years. Table 3 displays the smoothed z-scores corresponding to the percentile rankings of % BF as calculated by the LMS method. The z-scores express % BF in terms of SD units from the median for that specific age and gender allowing better comparison with individual values.
Table 2.
LMS Percentiles for body fat% in 11,357 boys and 10,756 girls aged 3-18 years
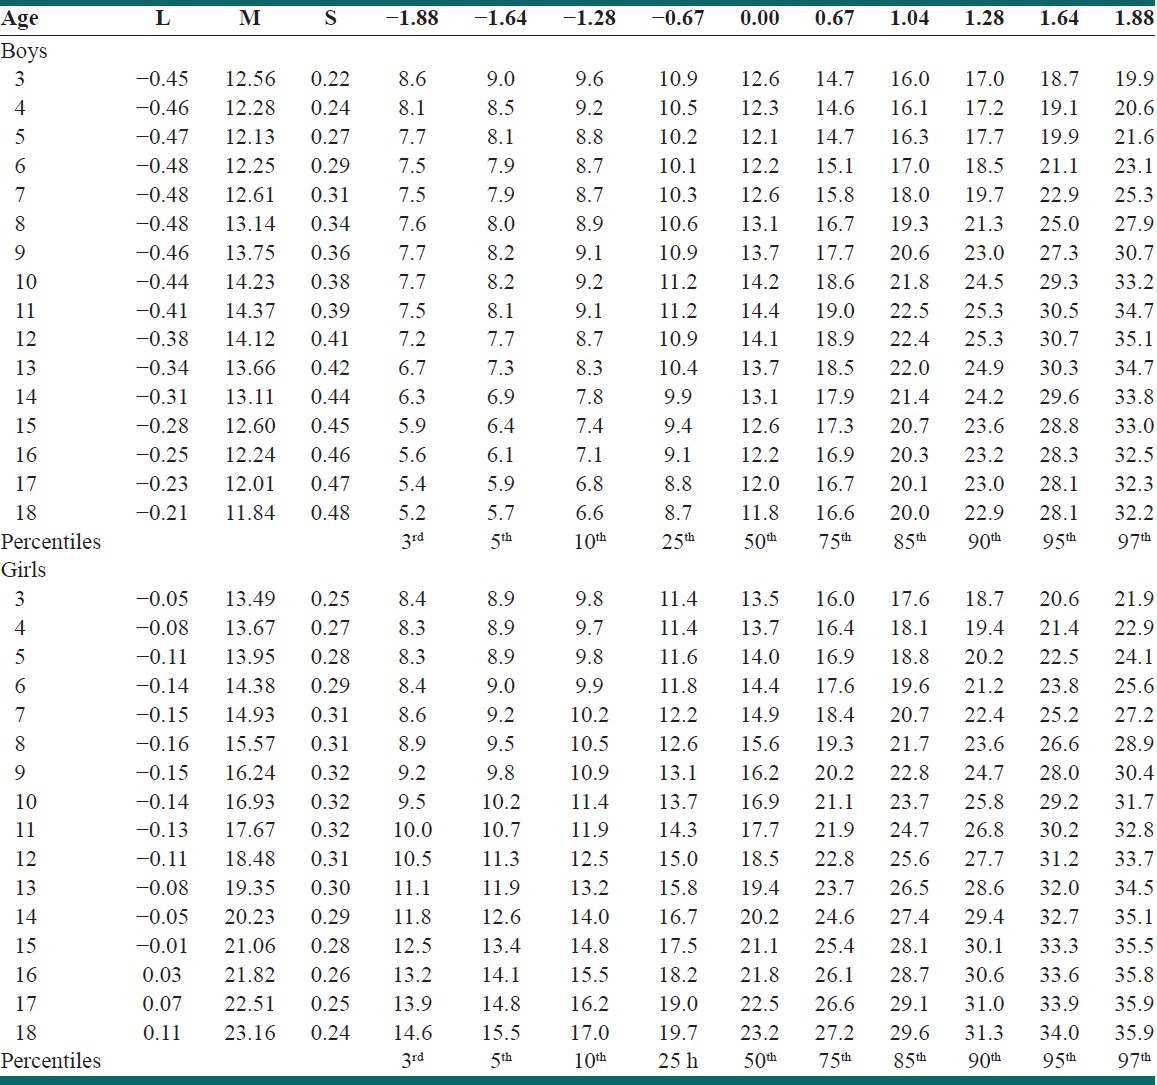
Figure 1.
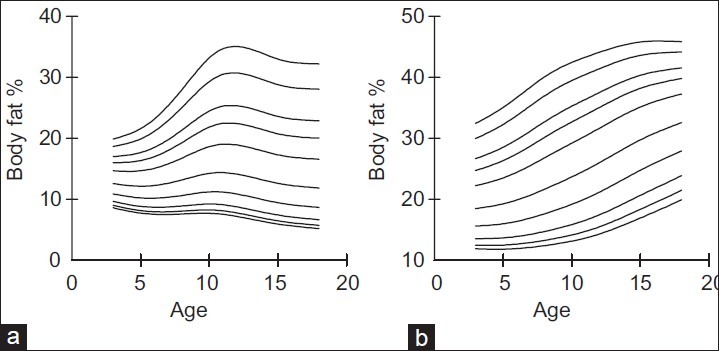
Smoothed LMS curves for the 3rd, 5th, 10th, 25th, 50th, 75th, 85th, 90th, 95th, and 97th percentiles of percentage body fat in 11 357 males and 10 756 females aged 3 to 18 years (a) Boys, (b) Girls.
Table 3.
Z-Scores for %Body fat in 11,357 boys and 10,756 girls 3 -18 y
DISCUSSION
This study presents age- and gender-specific percentiles of percentage body fat derived from SFT measurements in 22,113 urban German 3 to 18-year-old youths and data from eight national and international studies. Five studies including the present one used the same procedure in terms of SFT caliper measurements, three studies assessed Slaughter equations, and LMS-method,[8,11,13,14] two studies assessed percentage body fat using bio-impedance (BIA) measurement[9,10,12] and one used dual-energy x-ray absorptiometry (DXA).[15]
The comparison of the five cross-sectional studies using SFT measurement of % BF demonstrates different shapes of the growth curves between genders. In girls, the curves increase continuously reaching at age 18 years maximal % BF (mean, 25.5%) at the 50th percentile, whereas in boys the percentile curves steeply increase until age 11 years (mean, 17%) and then decrease until age 18 years (mean, 15.2%). Table 4 demonstrates that at the 50th percentile, mean urban values are considerably lower than mean rural plus urban nationwide values of 18-year-old youths in boys (15.2% vs 16.7%) and in girls (23.0% vs 28.2%) as well as in boys at 11 years (15% vs 18.9%). The very similar mean %BF values between the 5 SFT studies and the Spanish study based on five cities (17.3% vs17.0% in 11-year-old boys and 15.6% vs 25.4% in 18-year-old girls) might suggest that sampling and measurement is less homogeneous in multicenter studies.
Table 4.
Comparison of median body fat percentages (%BF) in children and adolescents from 9 different studies in 5 countries using three different methods of measurement
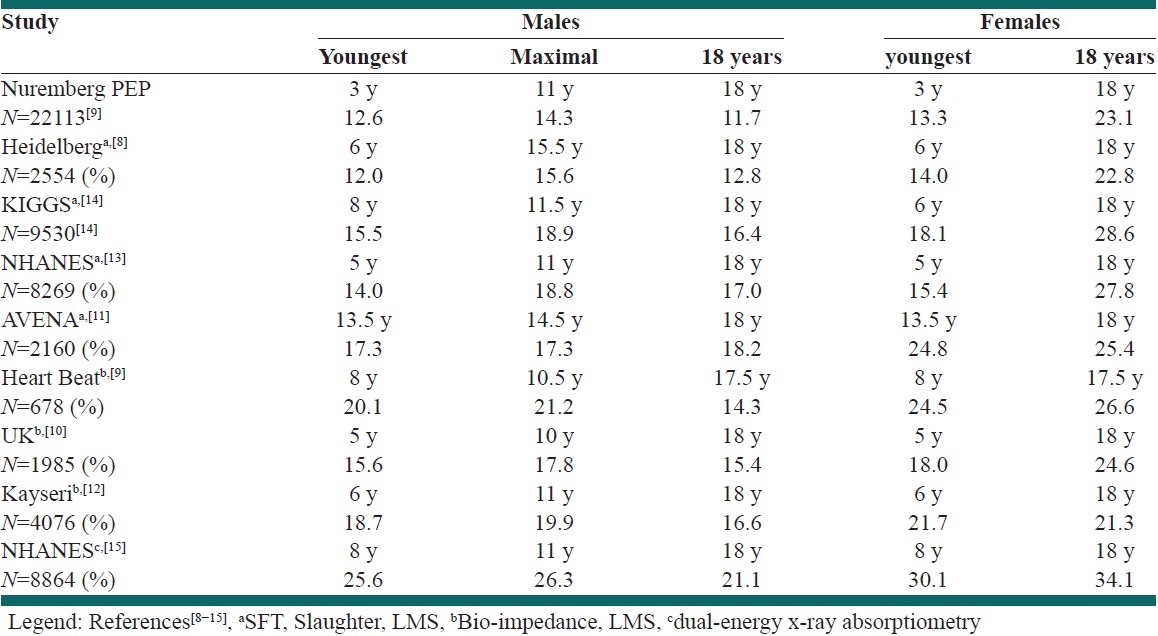
Three studies measured body fat percentage using bioelectrical impedance analysis (BIA) with prediction equations derived from calibration studies against whole-body DXA. The shapes of the growth curves are similar to the SFT-derived curves showing the typical marked increase in positive skewness followed by slight decreases among boys as well as the characteristic continuous increase of the curves with age in girls.[10,12] Mean peak % BF values at puberty at the 50th percentile are higher (19.6%) in the 3 BIA studies compared with mean values of the 5 SFT studies (17%) but similar in boys (14.4% vs 15.2%) and girls (24.2% vs 25.5%) at age 18 years. The consistency of these assessments is remarkably considering different periods of data collection, methods of measurement, and ethnicities. For example, 35% of the participants in NHANES 1999-2004 were black non-Hispanics[13] who had a higher prevalence of overweight (18.5%) compared with white non-Hispanics (10.1) youths among the sample NHANES 1999-2000.[24]
One study used DXA presenting similar percentile curves but considerably higher % BF values compared with the current PEP study and the other 7 studies.[8–14] The median peak value in boys was 26.3% at age 11 years, and 18-year-old boys had 21.1% % BF and girls had 34.1% % BF at the 50th percentile.[15] Since the algorithm underestimated fat mass and overestimated lean mass, data on lean soft tissue mass were decreased by 5% and an equivalent weight (in kilograms) was added to the total fat mass, thereby increasing the median level of % BF by approximately 3 percentage points.[15] Analyzing the same multiethnic NHANES 1999-2004 samples allows some comparison between SFT and DXA measurements of percentage body fat.[13,15] Median % BF was considerably lower using SFT measurement at age 18 years for boys (17% vs 21%) and girls (27.8% vs 34.1%) and peak values in boys (18.8% vs 26.3%). Adjustment of DXA values could explain these differences SFT measurements, which is consistent with literature describing a systematic tendency for DXA values to be higher than SFT values.[25]
CONCLUSION
Currently, nine studies from five countries have presented age- and gender-specific percentiles of % BF from large samples of children and adolescents aged 3 to 18 years. Five studies using SFT measurement and three studies using BIA describe gender-specific characteristic growth curves, which are very similar for males and for females. In both genders, urban percentage body fat values seem to be lower than national values irrespective of the country. However, DXA delivers higher values, the body fat percentages based on SFT or BIA are similar.
ACKNOWLEDGEMENTS
We thank the families participating in this project for their outstanding cooperation and dedication. For their excellent work and engagement, we thank the study staff and the many physicians and nurses for blood collection. The PEP Family Heart Study was supported by the Foundation for the Prevention of Atherosclerosis, Nuremberg, Germany; the Ludwig Maximilians University, Munich, Germany; the Bavarian Ministry of Health, Munich; City of Nuremberg. This work is supported by: Isfahan University of medical sciences deputy of heath and national death registration office as a Msc student theses with Reserch project number 390394
Footnotes
Source of Support: Foundation for the Prevention of Atherosclerosis, Nuremberg, Germany; the Ludwig Maximilians University, Munich, Germany; the Bavarian Ministry of Health, Munich; City of Nuremberg.
Conflict of Interest: None of the authors had a conflict of interest.
REFERENCES
- 1.Cole TJ, Bellizzi MC, Flegal KM, Dietz WH. Establishing a standard definition for childoverweight and obesity worldwide: International survey. BMJ. 2000;320:1240–3. doi: 10.1136/bmj.320.7244.1240. [DOI] [PMC free article] [PubMed] [Google Scholar]
- 2.National Center for Health Statistics. Pediatric Growth Charts. [Last cited in 2000]. Available from: www.cdc.gov/growthcharts .
- 3.Prentice AM, Jebb SA. Beyond body mass index. ObesRev. 2001;2:141–7. doi: 10.1046/j.1467-789x.2001.00031.x. [DOI] [PubMed] [Google Scholar]
- 4.Garn SM, Leonard WR, Hawthorne VM. Three limitations of body mass index. Am J Clin Nutr. 1986;44:996–7. doi: 10.1093/ajcn/44.6.996. [DOI] [PubMed] [Google Scholar]
- 5.Sarria A, Garcia Llop LA, Moreno LA, Fleta J, Morellón MP, Bueno M. Skin fold thickness measurements are better predictors of body fat percentage than body mass index in male Spanish children and adolescents. Eur J Clin Nutr. 1998;52:573–6. doi: 10.1038/sj.ejcn.1600606. [DOI] [PubMed] [Google Scholar]
- 6.Freedman DS, Wang J, Ogden CL, Thornton JC, Mei Z, Pierson RN, et al. The prediction of body fatness by BMI and skinfold thickness among children and adolescents. Ann Hum Biol. 2007;34:183–94. doi: 10.1080/03014460601116860. [DOI] [PubMed] [Google Scholar]
- 7.Bedogni G, Iughetti L, Ferrari M, Malavolti M, Poli M, Bernasconi S, et al. Sensitivity and specificity of body mass index and skin fold thickness in detecting excess adiposity in children aged 8-12 years. Ann Hum Biol. 2003;30:132–9. doi: 10.1080/0301446021000033409. [DOI] [PubMed] [Google Scholar]
- 8.Schaefer F, Geordi M, Wühl E, Schärer K. Body mass index and percentage fat mass in healthy German school children and adolescents. Int J Obes. 1998;22:461–9. doi: 10.1038/sj.ijo.0800608. [DOI] [PubMed] [Google Scholar]
- 9.Mueller WH, Harrist RB, Doyle SR, Labarthe DR. Percentiles of body composition from bioelectical impedance and body measurements in US adolescents 8-17 years old: Project Heart Beat. Am J Human Biol. 2004;16:135–50. doi: 10.1002/ajhb.20002. [DOI] [PubMed] [Google Scholar]
- 10.McCarthy HD, Cole TJ, Fry T, Jebb SA, Prentice AM. Body fat reference curves for children. Int J Obes (Lond) 2006;30:598–602. doi: 10.1038/sj.ijo.0803232. [DOI] [PubMed] [Google Scholar]
- 11.Moreno LA, Mesana MI, González-Gross M, Gil CM, Ortega CM, Fleta J, et al. Body fat distribution reference standards in Spanish adolescents: The AVENA Study. Int J Obes. 2007;31:1798–805. doi: 10.1038/sj.ijo.0803670. [DOI] [PubMed] [Google Scholar]
- 12.Kurtoglu S, Mazicioglu MM, Oztturk A, Hatipoglu N, Cicek B, Ustunbas HB. Body fat reference curves for healthy Turkish children and adolescents. Eur J Pediatr. 2010;169:1329–35. doi: 10.1007/s00431-010-1225-4. [DOI] [PubMed] [Google Scholar]
- 13.Laurson KR, Eisenmann JC, Welk GJ. Body fat percentile curves for US children and adolescents. Am J Prev Med. 2011;41:S87–92. doi: 10.1016/j.amepre.2011.06.044. [DOI] [PubMed] [Google Scholar]
- 14.Neuhauser HK, Schienkiewitz A, Schaffrath-Rosario A, Dortschy R, Kurth BM. Beiträge zur Gesundheitsberichterstattung des Bundes. Berlin: Robert-Koch-Institute; 2011. Referenzperzentile fur anthropometrische Masszahlen und Blutdruck aus der Studie zur Gesundheit von Kindern und Jugendlichen in Deutschland KIGGS) 2003-2006. [Google Scholar]
- 15.Ogden CL, Li Y, Freedman DS, Borrud LG, Flegal KM. National health statistic reports; no 43. Hyattsville, MD: National Center for Health Statistics; 2011. Smoothed percentage body fat percentiles for U.S. children and adolescents, 1999-2004. [PubMed] [Google Scholar]
- 16.Schwandt P, Geiss HC, Ritter MM, Üblacker C, Parhofer KG, Otto C, et al. The Prevention Education Program (PEP).A prospective study of the efficacy of family-oriented life style modification in the reduction of cardiovascular risk and disease: Design and Baseline Data. J Clin Epidemiol. 1999;52:791–800. doi: 10.1016/s0895-4356(99)00068-2. [DOI] [PubMed] [Google Scholar]
- 17.Geiss HC, Parhofer KG, Schwandt P. Parameters of childhood obesity and their relationship to cardiovascular risk factors in healthy prepubescent children. Int J Obes Relat Metab Disord. 2001;25:830–7. doi: 10.1038/sj.ijo.0801594. [DOI] [PubMed] [Google Scholar]
- 18.Schwandt P, Bertsch T, Haas GM. Anthropometric screening for silent cardiovascular risk factors in adolescents: The PEP Family Heart Study. Atherosclerosis. 2010;211:667–71. doi: 10.1016/j.atherosclerosis.2010.03.032. [DOI] [PubMed] [Google Scholar]
- 19.Slaughter MH, Lohman TG, Boileau RA, Horswill CA, Stillman RJ, van Loan MD, et al. Skin fold equations for estimation of body fatness in children and youth. Hum Biol. 1988;60:709–23. [PubMed] [Google Scholar]
- 20.Sun SS, Schubert CM, Chumlea WC, Roche AF, Kulin HE, Lee PA, et al. National estimates of the timing of sexual maturation and racial differences among US children. Pediatrics. 2002;110:911–9. doi: 10.1542/peds.110.5.911. [DOI] [PubMed] [Google Scholar]
- 21.Ogden CL, Felgal KM. National health statistics reports; no 25. Hyattsville, MD: National Center for Health Statistics; 2010. Changes in Terminology for childhood overweight and obesity. [PubMed] [Google Scholar]
- 22.Cole TJ. The LMS method for constructing normalized growth standards. Eur J Clin Nutr. 1990;44:45–60. [PubMed] [Google Scholar]
- 23.Cole TJ, Green PJ. Smoothing reference centile curves: The LMS method and penalised likelihood. Stat Med. 1992;11:1305–19. doi: 10.1002/sim.4780111005. [DOI] [PubMed] [Google Scholar]
- 24.Ogden CL, Flegal KM, Carroll MD, Johnson CL. Prevalence and trends in overweight Among US children and adolescents, 1999-2000. JAMA. 2002;288:1728–32. doi: 10.1001/jama.288.14.1728. [DOI] [PubMed] [Google Scholar]
- 25.Gutin B, Litaker M, Islam S, Manos T, Smith C, Treiber F. Body-compositionmeasurement in 9-11-y-old children by dual-energy x-ray absorptiometry, skinfold thickness measurements, and bioimpedance analysis. Am J Clin Nutr. 1996;63:287–92. doi: 10.1093/ajcn/63.3.287. [DOI] [PubMed] [Google Scholar]


