Abstract
Consider a study in which the effect of a binary exposure on an outcome operates partly through a binary mediator but measurement of the mediator is nondifferentially misclassified. Suppose that an investigator wishes to estimate the direct and indirect effects of the exposure on the outcome. In this paper, the authors describe a mathematical correspondence between the empirical expressions for the natural direct effect and the effect of exposure among the unexposed standardized by a binary confounder. They then exploit this correspondence to prove that the direction of the bias due to nondifferential measurement error in estimating the natural direct and indirect effects is to overestimate the natural direct effect and underestimate the natural indirect effect.
Keywords: bias (epidemiology), confounding factors (epidemiology), epidemiologic methods, measurement error, mediating factors
Measurement error is a pervasive—indeed, some would say ubiquitous—problem in the estimation of causal effects, yet little has been written about the effect of mediator measurement error on estimation of direct and indirect effects. To our knowledge, no analytic results exist to identify the direction or magnitude of bias due to the mismeasurement of a mediator. In this paper, we note that the mathematical expression for the natural direct effect (NDE) is analogous to that for the average effect of exposure among the unexposed standardized by a single confounder. We then harness recent results on the bias of the effect of exposure among the unexposed under nondifferential misclassification of a confounder to show that the bias due to nondifferential measurement error of a binary mediator will overestimate the NDE and underestimate the natural indirect effect (NIE).
BACKGROUND AND NOTATION
Let A be a binary exposure; let Y be an outcome which may be binary, polytomous, or continuous; and let M be a binary intermediate variable on the causal pathway between A and Y. We assume that M is not observed and that M′, an imperfect measure of M, is observed instead. We further assume that the measurement error of M is nondifferential with respect to A and Y, that is, P[M′ = m′|M = m, A = a, Y = y] = P[M′ = m′|M = m] for all a and y. A diagram depicting the relations among the variables is given in Figure 1. This figure encodes certain assumptions about confounding which will be detailed below.
Figure 1.
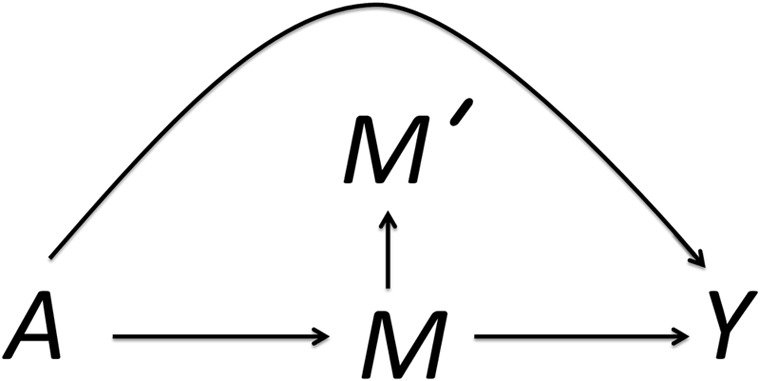
Relations among a binary exposure A, an outcome Y, and a binary mediator M. M′ is a nondifferentially misclassified measure of M.
We call effect measures that are calculated using M′ “measurement-error-biased” (ME-biased) measures and those that are calculated using M “true” measures. Let Yam be the counterfactual outcome under exposure value a and mediator value m—that is, the outcome we would have observed if, possibly contrary to fact, a subject had A = a and M = m. Let Ya and Ma be the counterfactual outcome and mediator under exposure A = a, respectively—that is, the values of Y and M we would have observed if, possibly contrary to fact, a subject had exposure A = a. Then  is the counterfactual outcome if we set the exposure to a and the mediator to its counterfactual value under exposure a*.
We make the consistency assumptions that Yam = Y when A = a and M = m and that Ya = Y and Ma = M when A = a. We also assume that  . The total effect (TE) of A on Y on the risk difference scale is defined as TE = E[Y1] − E[Y0], and under the assumption of no confounding of the relation of A to Y, it is identified by E[Y|A = 1] − E[Y|A = 0]. We discuss extensions that control for confounding variables below. Because it does not depend on M, the TE measure is the same regardless of whether the true mediator or the mismeasured mediator is observed. The true NDE on the risk difference scale is defined as
  , and the true NIE is defined as
  (1, 2). The NDE measures the expected change in outcome due to a change in exposure, holding the mediator fixed at the value it would have taken under no exposure. The NIE measures the expected change in outcome when the exposure is held fixed but the mediator changes from the value it would have taken under no exposure to the value it would have taken under exposure. Note that
 |
where the second equality follows from our assumption that  (2).
(2).
In general, in order to identify these effects, we require the following 4 assumptions of no unmeasured confounding (these assumptions are discussed in references 2–4):
Yam is independent of A conditional on measured covariates (there are no unmeasured confounders of the relation between A and Y).
Yam is independent of M conditional on A and measured covariates (there are no unmeasured confounders of the relation between M and Y).
Ma is independent of A conditional on measured covariates (there are no unmeasured confounders of the relation between A and M).
Yam is independent of
 conditional on measured covariates (there are no confounders of the effect of M on Y that are caused by A).
For simplicity of presentation and as encoded in Figure 1, we will assume that there are no confounders, either measured or unmeasured, of the effects of A on Y, A on M, or M on Y; we discuss relaxing this assumption further below. Under this simplifying assumption,  , and the true natural direct and indirect effects are identified by
 |
(1) |
and
 |
(2) |
(cf. reference 2). The expression for the NIE is the difference between the expected value of Y given A = 1 standardized by the distribution of M among the exposed and the expected value of Y given A = 1 standardized by the distribution of M among the unexposed. The expression for the NDE is the difference between the expected values of Y given A = 1 and given A = 0, each standardized by the distribution of M among the unexposed.
The ME-biased measures of the natural direct and indirect effects are given by the analogs of equations 1 and 2, with M replaced by M′:
 |
(3) |
and
 |
(4) |
In the presence of measurement error, these expressions will be biased for the true natural direct and indirect effects.
RELATION BETWEEN THE NDE AND THE EFFECT OF EXPOSURE AMONG THE UNEXPOSED
Here we describe a relation that holds between the expressions for the NDE and the effect of exposure among the unexposed when these effects are identified. Instead of the scenario depicted in Figure 1, suppose that we were interested in estimating the TE of A on Y but that the effect of A on Y was confounded by a single, nondifferentially misclassified, binary confounder C (see Figure 2). Let C′ denote the mismeasured confounder. For the true confounder, the effect of exposure among the unexposed is given by
 |
(5) |
which is the difference between the expected outcomes among the exposed and the unexposed standardized by the distribution of C among the unexposed. Although the data structures are different in this scenario and the scenario depicted in Figure 1, if we compare equations 2 and 5 we see that the mathematical formulas for the NDE and the effect of exposure among the unexposed are identical if we simply replace M in equation 2 with C. Similarly, if we replaced M′ with C′ in the expression for the ME-biased NDE, we would obtain the expression for the ME-biased measure of the effect of exposure among the unexposed. Next we will exploit this analytic relation to derive a new result on the consequences of nondifferential misclassification of a binary mediator.
Figure 2.
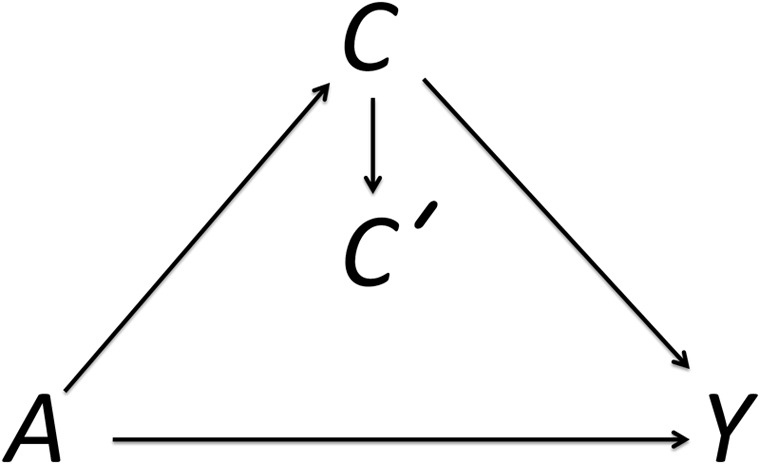
The effect of a binary exposure A on an outcome Y, confounded by C. C′ is a nondifferentially misclassified measure of C.
RESULTS ON MISCLASSIFICATION OF A BINARY MEDIATOR
Recent work by Ogburn and VanderWeele (5) demonstrated that the bias of the effect of exposure among the unexposed due to nondifferential misclassification of C must be less in magnitude than, and in the same direction as, the bias of the crude effect measure. Specifically, they proved that the ME-biased measure of the effect of exposure among the unexposed lies between the true and crude measures of the effect of exposure among the unexposed. This is similar to what was suggested for overall effects by Greenland (6). Ogburn and VanderWeele proved that this result will usually (though not always) hold for the overall effect of exposure, and that it will always hold for the effect of exposure among the exposed and the effect of exposure among the unexposed (5). Because of the correspondence noted above between the expressions for the NDE and the effect of exposure among the unexposed, we can use the result for the effect of misclassification on the bias of the effect of exposure among the unexposed to derive the following result for natural direct and indirect effect measures (for the proof, see the Appendix):
Result 1. Let A be binary and let M be binary and nondifferentially misclassified. Then the ME-biased NDE measure lies between the true NDE and the TE and the ME-biased NIE measure lies between 0 and the true NIE.
The effect of nondifferential misclassification of a binary mediator is thus to overestimate the magnitude of the NDE and to underestimate the magnitude of the NIE.
This result holds for Y regardless of whether it is binary, ordinal, or continuous (see the Appendix for details). Natural direct and indirect effects can also be defined on the risk ratio and odds ratio scales (3); an analog to result 1 holds for these effect measures. For definitions and details, see the Appendix.
EXAMPLES
We illustrate the usefulness of result 1 with the following example. Emsley et al. (7) considered the effect of randomization to one of 2 treatment arms (a new intervention vs. treatment as usual) on depression, mediated by adherence to the use of antidepressant medication, using data from PROSPECT (Prevention of Suicide in Primary Care Elderly: Collaborative Trial). Let A be an indicator of randomization to the new intervention, M be an indicator of adherence to antidepressant use, and Y be a continuous measure of depression 4 months after randomization (the Hamilton Depression Scale (8) was used). The authors assumed no interaction between the effects of A and M on Y and, implicitly, that adherence can be adequately measured by a binary indicator. Under the assumption of no interaction, E[Y1m] − E[Y0m] is the same for m = 0 and m = 1 and is, under assumptions 1–4, equal to the NDE. The authors estimated the TE to be −3.15 (standard error, 0.82), indicating a beneficial effect of randomization to the new intervention. Using the procedure given by Baron and Kenny (9), they estimated the NDE of the intervention to be −2.66 (standard error, 0.93), which implies an estimate of −0.49 (i.e., –3.15 + 2.66 = − 0.49) for the NIE. It is likely that the adherence indicator was misclassified, because adherence was evaluated by self-report (10), and possible that the misclassification was nondifferential with respect to treatment assignment and to the outcome. In this case, we can employ result 1 to deduce that the true NDE would likely be smaller in magnitude (negative but closer to 0) than the estimated −2.66, while the true NIE would likely be larger in magnitude (negative but farther from 0) than the estimated −0.49: In the presence of nondifferential misclassification of the mediator, the analysis of Emsley et al. (7) would have overestimated the magnitude of the direct effect and underestimated the magnitude of the indirect effect.
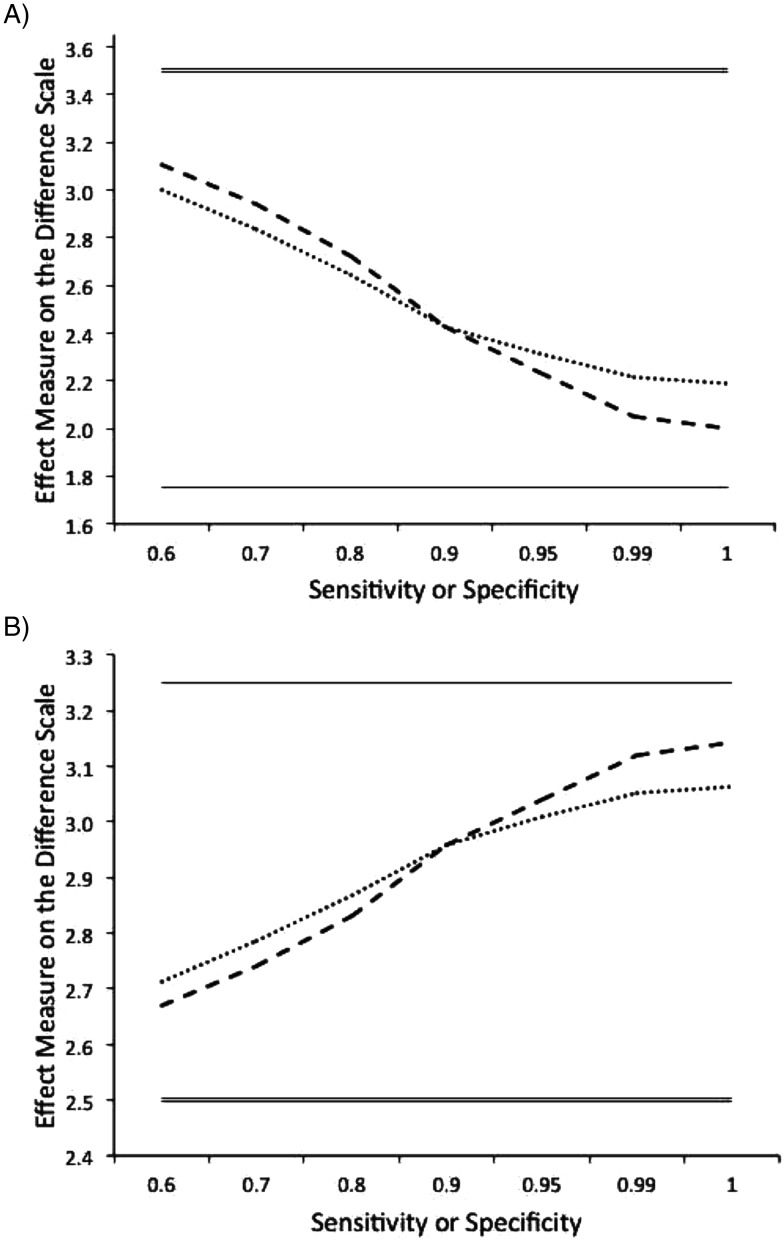
In general, the bias of the observed adjusted natural direct and indirect effects decreases with increasing sensitivity and specificity, but sensitivity and specificity must both equal 1 in order for the measures to be unbiased. In Figure 3, we plot the observed adjusted NDE as a function of sensitivity and specificity for two different hypothetical scenarios. The first scenario, depicted in the top graph, has true natural direct and indirect effects of 1.75 and a TE of 3.5. (Specifically, E[Y|A = 1, M = 1] = 4, E[Y|A = 1, M = 0] = 25, E[Y|A = 0, M = 1] = 10, and E[Y|A = 0, M = 0] = 0; P(A = 1, M = 1) = 0.4, P(A = 1, M = 0) = 0.2, P(A = 0, M = 1) = 0.3, and P(A = 0, M = 0) = 0.1). When sensitivity is fixed at 0.9, the observed adjusted NDE increases as specificity decreases, moving further from the true value and closer to the TE. Because the observed adjusted NIE is simply the difference between the TE and the observed adjusted NDE, it would decrease with decreasing specificity, moving further from the true value and closer to 0. Similarly, when specificity is fixed at 0.9, the observed adjusted NDE increases as sensitivity decreases. The second scenario, depicted in the bottom graph, has a true NDE of 3.25, a true NIE of −0.75, and a TE of 2.5. (These effects were generated by setting E[Y|A = 1, M = 1] = 10, E[Y|A = 1, M = 0] = 1, E[Y|A = 0, M = 1] = 4, and E[Y|A = 0, M = 0] = 6; P(A = 1, M = 1) = 0.4, P(A = 1, M = 0) = 0.2, P(A = 0, M = 1) = 0.3, and P(A = 0, M = 0) = 0.1.) When sensitivity is fixed at 0.9, the observed adjusted NDE increases with increasing specificity, moving further from the true value and closer to the TE. Similarly, when specificity is fixed at 0.9, the observed adjusted NDE increases with sensitivity.
Figure 3.
Bias of the observed adjusted natural direct effect (NDE) as a function of sensitivity and specificity for two different hypothetical scenarios. The first scenario (top) has a true NDE of 1.75, a true natural indirect effect (NIE) of 1.75, and a total effect (TE) of 3.5. The second scenario (bottom) has a true NDE of 3.25, a true NIE of −0.75, and a TE of 2.5. The single solid line represents the true NDE and the double solid line the TE. The dashed line represents the observed adjusted NDE as a function of sensitivity when specificity is fixed at 0.9. The dotted line represents the observed adjusted NDE as a function of specificity when sensitivity is fixed at 0.9.
EXTENSIONS
Result 1 may be extended to effects conditional on additional covariates or confounders X, provided that assumptions 1–4 hold conditional on X and that the misclassification of M is nondifferential with respect to A and Y conditional on X. If, in addition, the ordering of the conditional TE and the conditional NDE are the same with respect to each other and with respect to 0 for each value of X, then the result will hold marginalized over X. To see this, note that the marginalized effects are simply weighted averages of the conditional effects, with the same weight given to the same level of X for each effect. If the conditional TE has the same sign for each level of X, and if the conditional NDE is either less than the conditional TE or greater than the conditional TE for each level of X, then the same ordering that holds for the NDEtrue, NDEme, and TE within each level of X must hold for the weighted averages.
The result does not hold in general for polytomous or continuous mediators. We give an example of its failure in Table 1. In this example, the exposure and outcome are both binary, while the mediator has 3 levels. The full data are represented by a “true” 2 × 3 × 2 table, and an “observed” 2 × 3 × 2 table was generated from the true data by applying the following misclassification probabilities (which are nondifferential because they do not depend on the value of A or Y): P(M′ = 1|M = 1) = 0.7, P(M′ = 2|M = 1) = 0.3, P(M′ = 1|M = 2) = 0.4, P(M′ = 2|M = 2) = 0.6, P(M′ = 3|M = 3) = 1, and all of the other misclassification probabilities are 0. Instead of biasing the NDE toward the TE and the NIE toward 0, the result of misclassification in this example is to bias the NDE toward 0 and the NIE toward the TE. In this example, the true NIE is 0.124 but the ME-biased NIE is 0.160; the true NDE is 0.277, while the ME-biased NDE is 0.241.
Table 1.
Counterexample to Result 1 for a Polytomous Mediator
| True Data | |||||||
|---|---|---|---|---|---|---|---|
| A = 0 | M = 1 | M = 2 | M = 3 | A = 1 | M = 1 | M = 2 | M = 3 |
| Y = 0 | 20 | 20 | 1 | Y = 0 | 200 | 2 | 2 |
| Y = 1 | 20 | 10 | 5 | Y = 1 | 700 | 11 | 11 |
| TE | 0.401 | ||||||
| NDEtrue | 0.277 | ||||||
| NIEtrue | 0.124 | ||||||
|
Observed Data | |||||||
| A = 0 | M′ = 1 | M′ = 2 | M′ = 3 | A = 1 | M′ = 1 | M′ = 2 | M′ = 3 |
| Y = 0 | 14.4 | 6.6 | 20 | Y = 0 | 140.8 | 61.2 | 2 |
| Y = 1 | 16 | 9 | 10 | Y = 1 | 494.4 | 216.6 | 11 |
| TE | 0.401 | ||||||
| NDEtrue | 0.241 | ||||||
| NIEtrue | 0.160 | ||||||
Abbreviations: NDE, natural direct effect; NIE, natural indirect effect; TE, total effect.
Monotonicity assumptions are often useful for deriving analytic bounds for causal effects (5, 11, 12), but the counterexample given in Table 1 demonstrates that the natural monotonicity assumptions in this context do not suffice for our result to hold: In this example, E[Y|A, M] is monotonic (nondecreasing) in A and M and E[M|A] is monotonic (nonincreasing) in A. Similar examples can be constructed with E[Y|A, M] and E[M|A] either both nonincreasing or both nondecreasing. In the Appendix, we give another counterexample with polytomous M in which the true and ME-biased NIEs are of opposite signs. Intuition about nondifferential misclassification of a mediator is not a reliable guide when the mediator is polytomous.
Result 1 depends only on the analytic expressions given in equations 1–4, not on the definitions of the associated effects. It therefore holds no matter what interpretation is given to the analytic expressions. For example, Didelez et al. (13) defined natural direct and indirect effects without reference to counterfactuals; these effects are identified by the same expressions which we have used and therefore are subject to all of our results. Similar results would likewise hold with direct and indirect effects defined using stochastic counterfactuals.
DISCUSSION
We have shown that the bias in estimating the natural direct and indirect effects of an exposure on an outcome when considering a nondifferentially misclassified binary mediator will always overestimate the magnitude of the NDE and underestimate the magnitude of the NIE. This result is important because the use of misclassified mediators is common in practice and because misclassification is often impossible to rule out. It is therefore useful to be able to describe and bound the bias arising from such misclassification. We have also pointed out the correspondence between the analytic expressions for the NDE and the effect of exposure among the unexposed. We used the relation to derive a new result concerning the misclassification of a mediator; the relation might enable one to adapt other results and methods for the effect of exposure among the unexposed (or exposed) to the context of mediation and natural direct and indirect effects.
Further work is needed to search for more intuitive conditions under which the mediated effects can be bounded for polytomous, misclassified mediators and to extend these results to settings in which the exposure and outcome, in addition to the mediator, may be measured with error. In the absence of such results, we recommend that researchers use and further develop sensitivity analyses to explore the nature and direction of the bias due to mediator misclassification.
ACKNOWLEDGMENTS
Author affiliations: Program on Causal Inference, Department of Epidemiology, Harvard School of Public Health, Boston, Massachusetts (Elizabeth L. Ogburn, Tyler J. VanderWeele); and Department of Biostatistics, Harvard School of Public Health, Boston, Massachusetts (Tyler J. VanderWeele).
The research was supported by National Institutes of Health grants ES017876 and HD060696.
Conflict of interest: none declared.
APPENDIX
Mediated effects on the risk ratio and odds ratio scales
We define the natural direct effect (NDE), the natural indirect effect (NIE), and the total effect (TE) on the risk ratio (RR) and odds ratio (OR) scales (3):
 |
for the risk ratio scale and
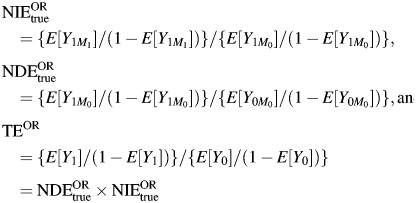 |
for the odds ratio scale. The corresponding measurement-error-biased (ME-biased) natural direct and indirect effect measures are calculated by replacing  with
with 

 in the expressions above. Then the following result holds:
Result 2. Let A be binary and let M be binary and nondifferentially misclassified. Then the ME-biased NDE measure lies between the true NDE and the TE and the ME-biased NIE measure lies between 1 and the true NIE on the risk ratio and odds ratio scales.
Proof of results 1 and 2
Ogburn and VanderWeele (5) proved the following result for the bias due to the nondifferential misclassification of a binary confounder:
Lemma 1. Let A be a binary exposure; let Y be an outcome which may be binary, polytomous, or continuous; and let C be a binary and nondifferentially misclassified confounder of the relation between A and Y. Then the ME-biased measure of the effect of exposure among the unexposed is between the crude and true measures of the effect of exposure among the unexposed, on the risk difference, risk ratio, and odds ratio scales.
We will prove our result for the mediated effects on the risk difference scale; the proof of result 2 follows by a similar argument. Lemma 1 says that one of the following two orderings must be true:
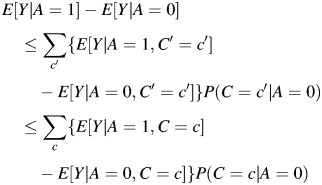 |
or
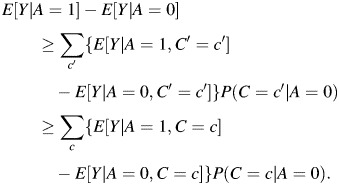 |
These orderings hold because the misclassification of C is nondifferential with respect to A and Y; they require no appeal to the fact that C is a confounder of the relation between A and Y or of causal or temporal ordering of the 3 random variables. Therefore, if we assume that M is nondifferentially misclassified with respect to A and Y in the mediator setting, the same mathematical result holds: either
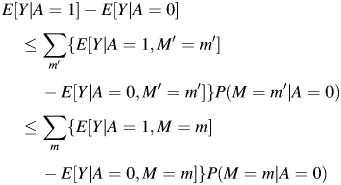 |
or
 |
 |
In the mediator setting, under assumptions 1–4, the quantity on the left-hand side of the inequalities represents the TE, the quantity in the middle is the ME-biased NDE, and the quantity on the right is the true NDE of A on Y. This gives us the result that the nondifferential misclassification of M biases the NDE towards the TE. If we subtract the TE from all sides of the inequalities above and then multiply each inequality by −1, we obtain the result that the ME-biased NIE is between 0 and the true NIE.
Counterexample for polytomous mediators
Although result 1 does not generally hold for polytomous mediators, in the confounding setting monotonicity assumptions proved useful for deriving bounds for causal effects (5). Based on the direction of temporal and causal effects in the mediator setting, it is natural to consider monotonicity of E[Y|A, M] and E[M|A], but we showed via counterexample in Table 1 that these do not suffice to derive the result for a nondifferentially misclassified polytomous mediator. It may also be natural to consider monotonicity of P[M = m|A] in m, but in Table 2 we give a counterexample showing that this still does not suffice for the result to hold.
Table 2.
Example Demonstrating That Monotonicity in M Does Not Suffice for Result 1 to Hold for a Polytomous Mediator
| True Data | |||||||
|---|---|---|---|---|---|---|---|
| A = 0 | M = 1 | M = 2 | M = 3 | A = 1 | M = 1 | M = 2 | M = 3 |
| Y = 0 | 20 | 20 | 1 | Y = 0 | 200 | 2 | 11 |
| Y = 1 | 10 | 10 | 5 | Y = 1 | 700 | 2 | 11 |
| TE | 0.401 | ||||||
| NDEtrue | 0.439 | ||||||
| NIEtrue | −0.038 | ||||||
|
Observed Data | |||||||
| A = 0 | M′ = 1 | M′ = 2 | M′ = 3 | A = 1 | M′ = 1 | M′ = 2 | M′ = 3 |
| Y = 0 | 11.4 | 21.6 | 8 | Y = 0 | 110.8 | 21.96 | 71.24 |
| Y = 1 | 7.5 | 10.8 | 6.7 | Y = 1 | 389.4 | 80.78 | 251.82 |
| TE | 0.401 | ||||||
| NDEME | 0.369 | ||||||
| NIEME | 0.032 | ||||||
Abbreviations: ME, measurement error; NDE, natural direct effect; NIE, natural indirect effect; TE, total effect.
The full data are represented by a “true” 2 × 3 × 2 table, and an “observed” 2 × 3 × 2 table was generated from the true data by applying the following nondifferential misclassification probabilities: P(M′ = 1|M = 1) = 0.55, P(M′ = 2|M = 1) = 0.1, P(M′ = 3|M = 1) = 0.35, P(M′ = 1|M = 2) = 0, P(M′ = 2|M = 2) =0.98, P(M′ = 3|M = 2) = 0.02, P(M′ = 1|M = 3) = 0.4, P(M′ = 2|M = 3) = 0, and P(M′ = 3|M = 3) = 0.6. In this example, E[Y|A, M] is monotonic in M because E[Y|A = 1, M = m] and E[Y|A= 0, M = m] are both nondecreasing in m: E[Y|A = 1, M = m] = 0.78 and E[Y|A = 1, M = 2] = E[Y|A = 1, M = 3] = 0.85, while E[Y|A = 0, M = 1] = E[Y|A = 0, M = 2] = 0.33 and E[Y|A = 0, M = 3] = 0.83. Furthermore, it is monotonic in A: E[Y|A = 1, M = m] is greater than E[Y|A = 0, M = m] for m = 1, 2, 3. We also have that E[A|M] is monotonic (nonincreasing) in M: E[A|M = 1] = 0.97, E[A|M = 2] = 0.68, and E[A|M = 3] =0.30. Finally, E[M|A] is monotonic in A (this must be the case whenever A is binary) and P[M = m|A = a] is monotonic in m for a = 1, 0: P[M = m|A = 1] is nonincreasing in m (P[M = 1|A = 1] = 0.97 and P[M = 2|A = 1] = P[M = 3|A = 1] = 0.01) and therefore P[M = m|A = 0] is nondecreasing in m. Despite all of the monotonicity assumptions that do hold in this example, E[A|M] is not monotonic in M. Instead of biasing the NDE toward the TE, the result of misclassification in this example is to bias the NDE toward 0. The ME-biased NIE, rather than being biased toward 0, is of the opposite sign from the true NIE.
REFERENCES
- 1.Robins JM, Greenland S. Identifiability and exchangeability for direct and indirect effects. Epidemiology. 1992;3(2):143–155. doi: 10.1097/00001648-199203000-00013. [DOI] [PubMed] [Google Scholar]
- 2.Pearl J. Proceedings of the Seventeenth Conference on Uncertainty in Artificial Intelligence. San Francisco, CA: Morgan Kaufmann Publishers, Inc; 2001. Direct and indirect effects; pp. 411–420. [Google Scholar]
- 3.VanderWeele TJ, Vansteelandt S. Odds ratios for mediation analysis for a dichotomous outcome. Am J Epidemiol. 2010;172(12):1339–1348. doi: 10.1093/aje/kwq332. [DOI] [PMC free article] [PubMed] [Google Scholar]
- 4.VanderWeele TJ. Marginal structural models for the estimation of direct and indirect effects. Epidemiology. 2009;20(1):18–26. doi: 10.1097/EDE.0b013e31818f69ce. [DOI] [PubMed] [Google Scholar]
- 5.Ogburn EL, VanderWeele TJ. On the nondifferential misclassification of a binary confounder. Epidemiology. 2012;23(3):433–439. doi: 10.1097/EDE.0b013e31824d1f63. [DOI] [PMC free article] [PubMed] [Google Scholar]
- 6.Greenland S. The effect of misclassification in the presence of covariates. Am J Epidemiol. 1980;112(4):564–569. doi: 10.1093/oxfordjournals.aje.a113025. [DOI] [PubMed] [Google Scholar]
- 7.Emsley R, Dunn G, White IR. Mediation and moderation of treatment effects in randomised controlled trials of complex interventions. Stat Methods Med Res. 2010;19(3):237–270. doi: 10.1177/0962280209105014. [DOI] [PubMed] [Google Scholar]
- 8.Hamilton M. A rating scale for depression. J Neurol Neurosurg Psychiatry. 1960;23(1):56–62. doi: 10.1136/jnnp.23.1.56. [DOI] [PMC free article] [PubMed] [Google Scholar]
- 9.Baron RM, Kenny DA. The moderator-mediator variable distinction in social psychological research: conceptual, strategic, and statistical considerations. J Pers Soc Psychol. 1986;51(6):1173–1182. doi: 10.1037//0022-3514.51.6.1173. [DOI] [PubMed] [Google Scholar]
- 10.Bruce ML, Ten Have TR, Reynolds CF, III, et al. Reducing suicidal ideation and depressive symptoms in depressed older primary care patients: a randomized controlled trial. JAMA. 2004;291(9):1081–1091. doi: 10.1001/jama.291.9.1081. [DOI] [PubMed] [Google Scholar]
- 11.VanderWeele TJ, Hernán MA, Robins JM. Causal directed acyclic graphs the direction of unmeasured confounding bias. Epidemiology. 2008;19(5):720–728. doi: 10.1097/EDE.0b013e3181810e29. [DOI] [PMC free article] [PubMed] [Google Scholar]
- 12.VanderWeele TJ. The sign of the bias of unmeasured confounding. Biometrics. 2008;64(3):702–706. doi: 10.1111/j.1541-0420.2007.00957.x. [DOI] [PubMed] [Google Scholar]
- 13.Didelez V, Dawid A, Geneletti S. Proceedings of the 22nd Annual Conference on Uncertainty in Artificial Intelligence. Arlington, VA: AUAI Press; 2006. Direct and indirect effects of sequential treatments; pp. 138–146. [Google Scholar]


