Abstract

The first protocell membranes may have assembled from fatty acids and related single-chain lipids available in the prebiotic environment. Prior to the evolution of complex cellular machinery, spontaneous protocell membrane growth and division had to result from the intrinsic physicochemical properties of these molecules, in the context of specific environmental conditions. Depending on the nature of the chemical and physical environment, fatty acids can partition between several different phases, including soluble monomers, micelles, and lamellar vesicles. Here we address the concentration dependence of fatty acid aggregation, which is dominated by entropic considerations. We quantitatively distinguish between fatty acid phases using a combination of physical and spectroscopic techniques, including the use of the fluorescent fatty acid analogue Laurdan, whose emission spectrum is sensitive to structural differences between micellar and lamellar aggregates. We find that the monomer–aggregate transition largely follows a characteristic pseudophase model of molecular aggregation but that the composition of the aggregate phase is also concentration dependent. At low amphiphile concentrations above the critical aggregate concentration, vesicles coexist with a significant proportion of micelles, while more concentrated solutions favor the lamellar vesicle phase. We subsequently show that the micelle–vesicle equilibrium can be used to drive the growth of pre-existing vesicles upon an increase in amphiphile concentration either through solvent evaporation or following the addition of excess lipids. We propose a simple model for a primitive environmentally driven cell cycle, in which protocell membrane growth results from evaporative concentration, followed by shear force or photochemically induced division.
Introduction
Early cell membranes are thought to have been composed of fatty acids and related single-chain amphiphiles, in contrast to the phospholipid-based membranes of all modern cells. Initial support for this hypothesis arose from the facile prebiotic synthesis of these molecules and the ability of fatty acids to spontaneously assemble into bilayer vesicles.1,2 Fatty acids and other oxygenated alkanes can be synthesized via Fischer–Tropsch-type chemistry,3,4 and membrane-forming samples of these molecules have been discovered in abiotic environments such as meteorites.5,6 More recently, the functional properties of fatty acid membranes have been studied7−10 and are consistent with the necessity for early cell membranes, prior to the evolution of transport machinery, to be permeable to polar nutrients. In addition, fatty acid vesicles have a striking ability to undergo intervesicle competition through exchange of monomers.11,12 These dynamic processes depend upon the rapid exchange of single-chain amphiphiles between membranes and the surrounding solution. The importance of these exchange processes motivated us to investigate the structural composition of fatty acid vesicle solutions.
Fatty acid membranes are only stable within a narrow pH range, from neutral to moderately alkaline (pH ∼ 7–9, depending on chain length), near the apparent pKa of the fatty acid within the bilayer. This condition allows approximately equal proportions of protonated and ionized carboxylates to coexist, forming a bilayer-stabilizing hydrogen bonding network.13,14 Under more alkaline conditions, fatty acids are fully ionized and aggregate into small soap micelles, as a result of the charge repulsion of the anionic head groups. Under acidic conditions, fatty acids become fully protonated, lose their amphiphilicity, and condense into oil droplets. This pH dependence of fatty acid phase behavior has been extensively characterized by NMR, X-ray diffraction, and electron spin resonance (ESR).13,15,16 Subsequent work has utilized the pH dependence of fatty acid aggregation to drive the de novo assembly of vesicles from micelles7,17 or the growth of pre-existing vesicles by introducing alkaline micelles into buffered suspensions of vesicles.7,18
Supra-molecular self-assembly is intrinsically concentration dependent because of the entropic cost of aggregation. Detergent solutions, for example, feature a critical micelle concentration (cmc), below which only monomers are found and above which aggregation occurs. Such self-assembly processes can be described as pseudophase equilibria, with critical concentrations being analogous to solubilities. Critical aggregation concentrations (cac) have been observed for fatty acid vesicles,2,19 suggesting that monomers coexist with vesicles above the cac. In addition, asymmetries in ESR data have provided evidence for micelle–vesicle coexistence in two fatty acid systems.15,16 Because of their large size (n > 105), membrane vesicles have a higher entropic cost of formation than smaller (n ∼ 50) micellar aggregates. We therefore asked if monomers, micelles, and vesicles could all coexist under certain conditions and whether the composition of the aggregate phase could be concentration dependent, with lower concentration solutions favoring micelles and higher concentrations favoring vesicles. These questions are of particular interest with regard to prebiotic scenarios, where membrane assembly may have frequently occurred in relatively dilute solutions of fatty acids, near the cac.20
To explore multiphase coexistence, we sought methods to quantitatively characterize the equilibrium between fatty acid monomers, micelles, and vesicles at low concentrations. We focused on a set of monounsaturated fatty acids, which serve as convenient laboratory models for the short-chain, saturated lipids expected to result from prebiotic synthesis. Because of the techniques used, previous studies could only examine fatty acid aggregation behavior at concentrations an order of magnitude or more above the apparent cac. We distinguished between different aggregate phases using the fluorescent fatty acid analogue Laurdan (6-dodecanoyl-2-dimethylaminonaphthalene), which undergoes an emission red shift with increasing solvent polarity.21 Laurdan has been used extensively to study structural features of membranes, e.g., lipid packing,22 membrane bending,23 and phase segregation.24 Since micelles feature greater headgroup solvation than more tightly packed bilayers, we predicted that Laurdan would be a sensitive means of distinguishing these two aggregate states. We used this assay alongside surface tension measurements, which can quantify monomer concentrations, to characterize the equilibrium between these states. Our data support a micelle–vesicle equilibrium above the cac in which dilute solutions are relatively enriched in micelles. We then used this multiphase coexistence to drive the growth of fatty acid vesicles by evaporative concentration, a process with potential prebiotic relevance to the growth of early cell membranes.
Results and Discussion
We first characterized the fatty acid monomer to micelle phase transition by measuring solution surface tension at pH 10.5, in which fatty acids aggregate into soap micelles. Increasing concentrations of surfactant (e.g., fatty acid) monomer reduce the effective surface tension of an interface (e.g., air–water), but aggregates (e.g., micelles) do not. We measured surface tensions of serial dilutions for a series of unsaturated fatty acids ranging from 14 to 18 carbons. From these surface tension plots (Figure S1, Supporting Information), we calculated solution monomer concentrations by fitting to the Szyszkowski equation, which relates surface tension to bulk concentration (Materials and Methods for details). Pseudophase equilibria feature abrupt transition points at the critical concentration, above which the monomer concentration stays constant and all additional lipids are incorporated into aggregates.25 As expected, this was the case for a series of unsaturated fatty acids at high pH, where micelles are the only aggregates that can form (Figure 1A). The critical micelle concentrations (cmc’s) of these fatty acids scaled exponentially with chain length, a result of the linear dependence of the free energy of solvation on chain length via the hydrophobic effect.26
Figure 1.
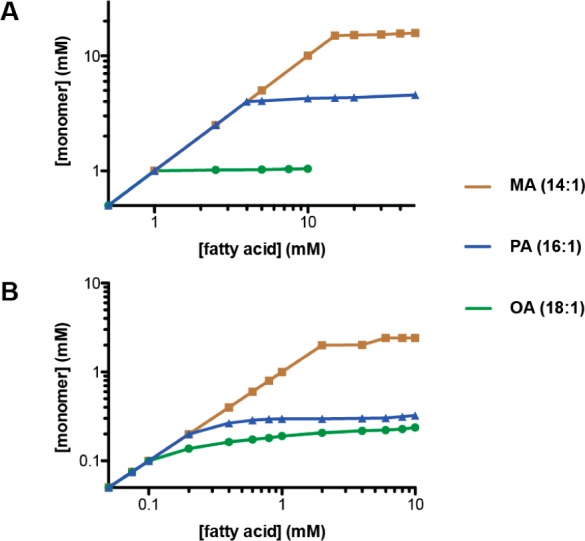
Fatty acid monomer concentrations as a function of total concentration for a series of monounsaturated fatty acids at pH 10.5 (A) and 8.5 (B). Monomer concentrations were derived from surface tension plots since aggregates are not surface active. The plateau points in (A) correspond to critical micelle concentrations (MA, 15 mM; PA, 4 mM; OA, 1 mM, in agreement with previous measurements27). Plateau points in (B) indicate critical aggregation concentrations (MA, 2 mM; PA, 0.2 mM; OA, <0.1 mM). MA, myristoleate (C14:1); PA, palmitoleate (C16:1); OA, oleate (C18:1).
We then repeated the above experiments at pH 8.5, where vesicles are expected to form. Monomer concentrations in fatty acid solutions at this lower pH (Figure 1B) also plateaued at critical concentrations, but not as abruptly as at pH 10.5. This was somewhat surprising because vesicles contain very large numbers of monomers, and vesicle formation should therefore more closely resemble a pure phase transition. We reasoned that this effect could be due to fatty acids aggregating into multiples states, e.g., vesicles and micelles, above the critical concentration. We also considered the alternative possibility that micelle aggregation occurred at a lower concentration than vesicle assembly at pH 8.5; i.e., the system had two critical concentrations, as has been observed in cationic/anionic surfactant mixtures.28 However, when we used light scattering, which detects vesicle assembly but not the formation of much smaller micelles, the cac’s we observed (Figure S2, Supporting Information) were at the same concentration as, or even slightly lower than, the critical concentrations obtained from surface tension plots. We therefore conclude that monomers do not aggregate into micelles at concentrations below that at which vesicle assembly occurs.
These initial experiments motivated us to find experimental techniques that would allow us to detect and measure both micellar and lamellar aggregates in the same experiment. This is a challenge because of the large size difference between micelles and vesicles (precluding microscopy or light scattering), the rapid exchange between these states (precluding any sort of physical separation), and their similar internal chemical environments (precluding dyes sensitive to nonpolar environments). Laurdan is a C12 fatty acid analogue with a fluorescent naphthalene derivative that features an emission spectrum that is sensitive to the polarity of its environment. Previous work in our laboratory had used Laurdan to monitor structural changes during fatty acid membrane bending,23 and so we reasoned that it would also be sensitive to larger changes in aggregate structure (Figure S3, Supporting Information).
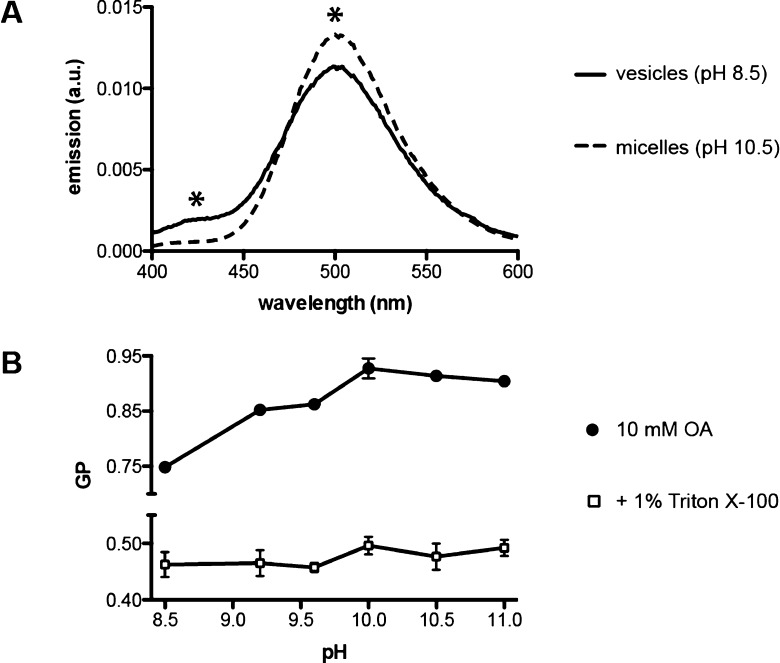
We observed a characteristic change in Laurdan emission intensities when incubated as a minor component (1:400) in fatty acid micelles as compared to vesicles (Figure 2A). This is explained by the high curvature of the micelle surface, which results in increased water penetration compared to bilayers. We quantified this spectral shift using a unitless Generalized Polarization24 (GP) parameter
where I430 and I500 are the emission intensities (excitation 364 nm) at 430 and 500 nm, respectively. We note that our expression for GP is inverted in sign from that generally used (for phospholipid membranes) due to the altered spectra of Laurdan in fatty acid aggregates. In this form, larger GP values indicate a more solvated state of the dye, e.g., as expected from micellar vs lamellar packing.
Figure 2.
Aggregate dependence of Laurdan emission. (A) Emission spectrum for 25 μM Laurdan (excitation 364 nm) in 10 mM oleate at pH 8.5 (vesicles) or pH 10.5 (micelles). Asterisks indicate peaks whose emission intensities are used to calculate GP. (B) Dependence of Laurdan GP on pH in 10 mM oleate with (open squares) or without (closed circles) 1% v/v Triton X100, which disrupts fatty acid aggregates. Error bars indicate SD (n = 3).
In oleate solutions, GP increased monotonically with pH until it plateaued above pH 10 (Figure 2B). This was consistent with a pH-dependent change from a lamellar to micellar phase, with intermediate values (e.g., at pH 9) reflecting coexisting vesicles and micelles.19 These pH-dependent changes in GP were not observed in the presence of detergent (Triton X100), which disrupts all fatty acid aggregates. Changes in Laurdan GP thus were not caused by the pH change per se but rather by the structure of the resulting fatty acid aggregate. GP was also notably insensitive to vesicle radius and thus mean curvature, in extruded samples (Figure S4, Supporting Information). This was consistent with our previous results on bending relaxation in fatty acid vesicles.23
We then asked if the Laurdan GP is dependent on the concentration of the fatty acid solution. At concentrations below the aggregation concentrations, Laurdan emission intensity and GP were low, likely reflecting the insolubility of the dye in the absence of hydrophobic aggregates (Figure S5, Supporting Information). For solutions at pH 10.5, GP remained constant with regard to concentration above the cmc for all three fatty acids tested (Figure 3A). Therefore, the micelle aggregate is structurally consistent over this concentration range, though it is likely heterogeneous in nature. In contrast, solutions at pH 8.5 showed a dramatic dependence of GP on concentration (Figure 3B). Concentrations just above the cac had a GP close to that for micelles, which decreased as the concentration increased, eventually plateauing at high concentrations. We interpreted this data to indicate a concentration dependence of the fatty acid aggregation state, with micelles favored in low concentration solutions. We also observed this effect in oleate solutions at pH 9.2, with GP plateauing to an intermediate value reflecting a roughly equal mixture of micelles and vesicles (Figure 3C).
Figure 3.
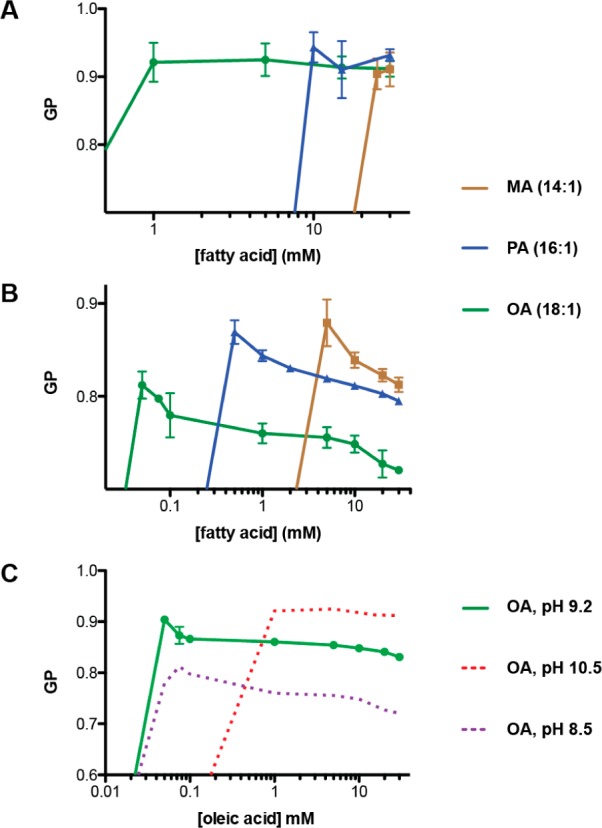
Concentration dependence of Laurdan GP in fatty acid solutions at varying pH. (A) GP as a function of concentration for monounsaturated fatty acids at pH 10.5. GP is constant for concentrations above the cmc. (B) GP as a function of concentration for monounsaturated fatty acids at pH 8.5. GP drops monotonically once above the cac, reflecting a change in the aggregate composition. (C) GP as a function of concentration in oleate at pH 9.2. Dotted lines representing equivalent curves for pH 10.5 (from A) and 8.5 (from B) are provided for reference. Error bars indicate SD (n = 3).
Assuming that Laurdan partitions representatively between micelles and vesicles, its emission in a solution can be modeled as a weighted average between its characteristic micelle and vesicle emissions (Materials and Methods). Using this approach, we approximated the micelle to vesicle partition coefficient as a function of concentration in the systems tested (Figure 4). These are relative partition coefficients with respect to the reference vesicle solutions at 30 or 50 mM and are thus expressed as “apparent Xm/Xv”, where Xm and Xv are the micelle and vesicle fractions, respectively.
Figure 4.
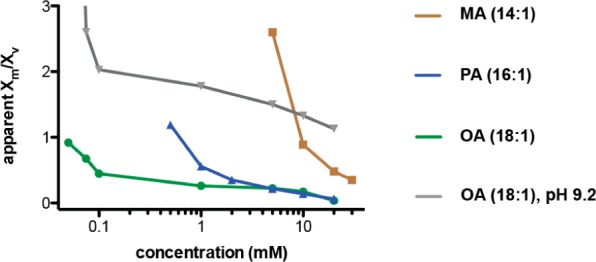
Apparent micelle to vesicle partition coefficients derived from Laurdan GP data. Partition coefficients are calculated by equating measured emission intensities to weighted averages between reference vesicle and micelle solutions. Partition coefficients are given as a function of concentration in vesicle solutions at pH 8.5 or 9.2 and show that low concentration solutions are enriched in micellar aggregates.
We tested the concentration dependence of the micelle to vesicle ratio independently by measuring the turbidity of vesicle solutions that had been extruded to 50 nm to eliminate spurious effects due to variation in vesicle size. Phospholipid (dimyristoleoyl phosphocholine) solutions, which only form vesicles, exhibited a linear increase in turbidity with concentration, corresponding to the expected linear increase in vesicle concentration (Figure 5A, black). In contrast, the absorbance of myristoleate solutions increased nonlinearly above the cac, with more dilute solutions depleted in vesicles (Figure 5A, green). From these absorbance values, we calculated apparent micelle to vesicle partition coefficients, assuming that all fatty acids not in vesicles were in the form of micelles (Materials and Methods). These values corresponded well with the partition coefficients derived from Laurdan measurements (Figure 5B).
Figure 5.
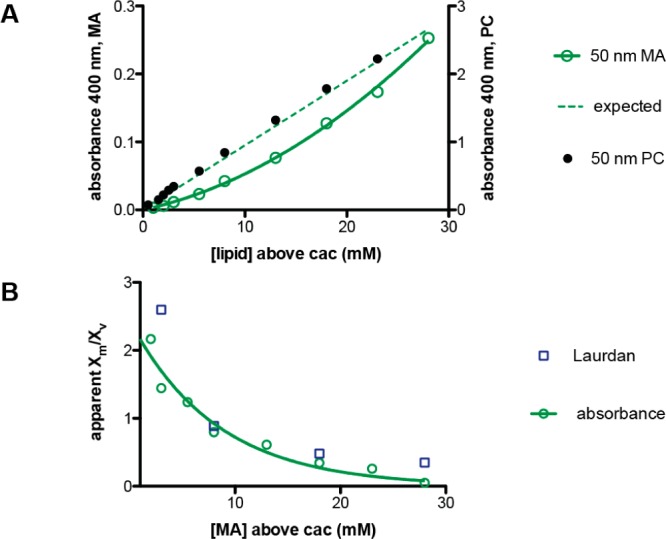
Vesicle concentration vs myristoleate concentration. (A) Turbidity of myristoleate solutions at pH 8.5 extruded to 50 nm (green, left axis). Dashed line is the expected absorbance if the vesicle concentration scaled linearly with myristoleate concentration, relative to the absorbance at 50 mM. In contrast, the turbidity of 50 nm phospholipid (dimyristoleoyl phosphocholine, PC) vesicles scales linearly with concentration (black, right axis). Myristoleate concentrations are total solution concentrations above the myristoleate cac, 2 mM. (B) Apparent micelle to vesicle partition coefficients for myristoleate at pH 8.5 as derived from absorbance readings (green circles) and from Laurdan GP (blue squares). A fitted single exponential decay (k = 0.12 mM–1) is shown and used to predict growth in Figure 8.
Our characterization of fatty acid phase behavior demonstrates that fatty acid incorporation into vesicles vs micelles increases with both increasing concentration and decreasing pH. The addition of alkaline micelles to buffered vesicles has long been used as a model system for vesicle growth.20 We therefore hypothesized that the concentration dependence of the micelle–vesicle equilibrium could provide an alternative mechanism for the growth of pre-existing fatty acid vesicles. In this scenario, a rise in amphiphile concentration would cause the incorporation of excess micellar fatty acids into vesicles, and dilution would drive vesicle shrinkage (as material leaves the lamellar phase and reforms micelles). We tested this possibility by monitoring changes in the membrane area of 100 nm vesicles using a Förster resonance energy transfer (FRET) growth assay.7,18 This assay quantitatively relates changes in FRET to changes in dye concentrations and therefore membrane surface area (Materials and Methods). Upon dilution from 10 to 5 mM, we observed rapid shrinkage of 100 nm myristoleate vesicles (Figure 6). Dilution was performed with buffer containing 2 mM myristoleate, at the cac, so shrinkage was not due to general aggregate dissolution. This shrinkage was subsequently reversed by the addition of preformed 20 mM myristoleate vesicles, to raise the total myristoleate concentration back to 10 mM. We were thus able to demonstrate a full cycle of growth and shrinkage by modulating the fatty acid concentration in the solution.
Figure 6.
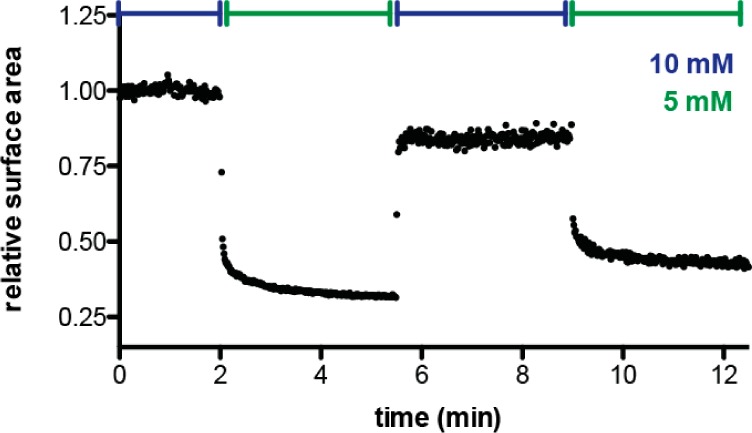
Reversible vesicle growth driven by amphiphile concentration changes. Myristoleate vesicles, initially at 10 mM, shrink in surface area upon dilution to 5 mM. Surface area grows back to near the initial value upon concentration via the addition of preformed vesicles and subsequently shrinks upon further dilution. Changes in membrane area are tracked by FRET between donor and acceptor phospholipids, which remain in the vesicles due to their insolubility.
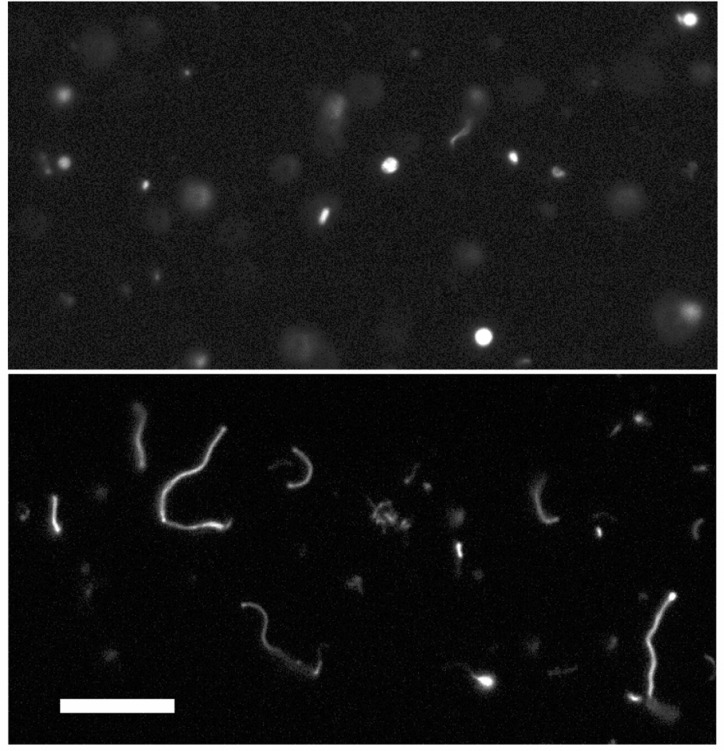
The rapid growth of large, multilamellar vesicles following the addition of excess micelles results in the transformation of initially spherical vesicles into extended filamentous vesicles.10,12 This pathway provides a straightforward route for protocell division due to the intrinsic fragility of filamentous vesicles, which break up into daughter vesicles in response to mild shear forces10 or photochemically induced pearling.29 We therefore asked whether concentration-driven vesicle growth is robust enough to drive the same filamentous shape transition. To test this possibility, we prepared large (∼4 um) myristoleate vesicles by large pore extrusion and dialysis at a concentration of 5 mM. The initially spherical vesicles were brought to a concentration of 15 mM via the addition of preformed myristoleate vesicles and within 30 min had grown into long, thin filamentous vesicles (Figure 7). The shape transition occurs because volume growth is osmotically limited by solute (buffer) permeation, geometrically necessitating high surface area morphologies. Vesicles were labeled with a soluble fluorescent dye, which stayed encapsulated during the entire experiment.
Figure 7.
Growth of large vesicles by increase in amphiphile concentration. Multilamellar (∼4 μm) myristoleate vesicles, initially mostly spherical (top), grow into long, filamentous vesicles upon addition of concentrated preformed vesicles (bottom). Filamentous growth occurs because of the osmotically limited increase in vesicle volume and is similar to growth seen upon addition of alkaline micelles. Top image taken immediately after mixing, bottom taken 20 min later. Scale bar, 30 μm.
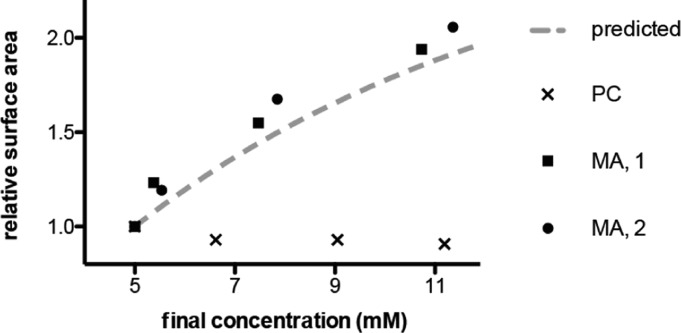
The simplest prebiotic mechanism for increasing lipid concentration would be through solution evaporation. We therefore asked whether gentle evaporation would drive the growth of fatty acid vesicles as a result of the transfer of material from coexisting micelles into the preformed vesicles as the fatty acid concentration increased (Figure 8). Solutions of 100 nm myristoleate vesicles, initially at a concentration of 5 mM, were allowed to evaporate at 35 °C with gentle agitation. Membrane area was monitored by FRET at discrete time points and approximately doubled over 24 h as the lipid concentration rose to ∼10 mM. This growth was similar in magnitude to that predicted (dashed line) from the previously measured apparent micelle–vesicle partition coefficients (Figure 5B; Materials and Methods) and thus was consistent with our model for concentration-driven growth. Growth was not observed for phospholipid vesicles, which do not feature a measurable coexisting solution phase of micelles or monomers and thus were not predicted to change in membrane area upon concentration.
Figure 8.
Solution evaporation drives the growth of fatty acid vesicles. Myristoleate (MA) vesicles, initially at 5 mM lipid concentration, were concentrated by gentle evaporation (Materials and Methods) and changes in surface area monitored by FRET at time points of 3, 10, and 24 h. Data are shown for two independent experiments (solid circles, squares) and are in agreement with that predicted from measured apparent micelle–vesicle partition coefficients (dashed line). An identical experiment with dimyristoleoyl phosphocholine (PC) vesicles did not show growth (points labeled x).
Conclusions
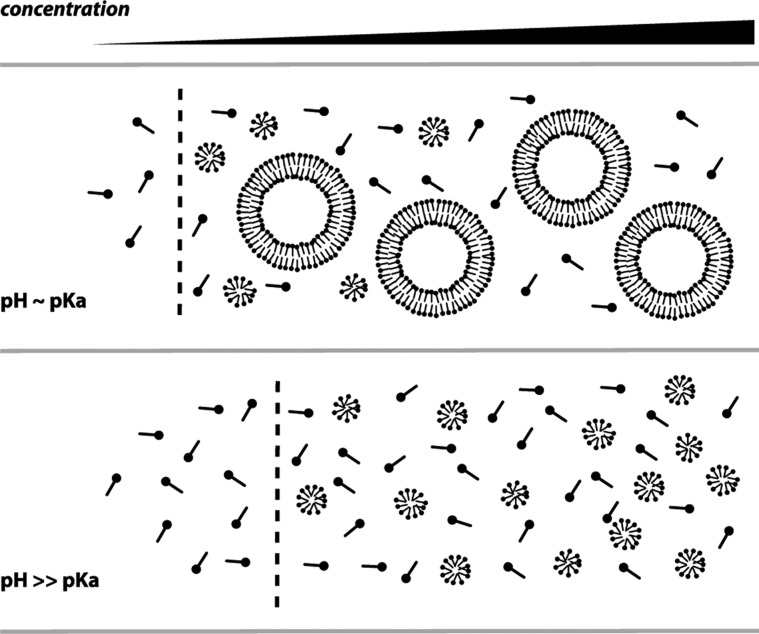
We have used a combination of physical and spectroscopic assays to characterize the phase behavior of fatty acid solutions to better understand models for prebiotic membrane assembly and function. In the course of these experiments, we found Laurdan to be a particularly useful fluorescent probe due to its ability to differentiate between fatty acid micelles and vesicles. This assay was complementary to standard approaches for measuring fatty acid monomer concentration (via surface tension) and vesicle concentration (via light scattering). At a given temperature and pressure, there are two determinants of fatty acid phase behavior in our system: pH, which controls headgroup ionization, and concentration, which entropically regulates aggregate size. Laurdan GP increases monotonically from pH 8.5 to pH 10, which reflects the previously identified transition from vesicle to micelle aggregates as the fatty acids become fully ionized and thus favor a high curvature geometry. More surprisingly, we also found that GP at pH 8.5 decreases with concentration above the cac. We interpret this to reflect a concentration-dependent change in the micelle–vesicle equilibrium, with lower concentrations favoring the smaller micellar aggregates and higher concentrations favoring the much larger vesicle aggregates. This behavior is independent of the concentration-dependent transition from monomers to aggregates (vesicles or micelles), which largely follows a pseudophase equilibrium that is characteristic of surfactant aggregation. Our model for fatty acid aggregation is shown in Figure 9.
Figure 9.
Model for fatty acid phase behavior. Solutions feature a pseudophase separation from monomers to aggregates, characterized by a cac (dashed line) that is dependent on pH. In addition, vesicle solutions feature a concentration-dependent vesicle–micelle equilibrium, with higher concentrations favoring the larger vesicle aggregates. In contrast, alkaline solutions exhibit a single sharp pseudophase transition at the cmc. Both pH and concentration-driven phase transitions can drive fatty acid vesicle growth.
The predominance of micelles at lower concentrations can be rationalized entropically since micelles are much smaller than vesicles. The greater magnitude of this effect with shorter chain length lipids (e.g., myristoleate vs oleate) supports this hypothesis: micelle aggregation number has a strong dependence on chain length, so shorter chain length lipids assemble into smaller micelles.30 We therefore expect this phenomenon to be broadly applicable to shorter, saturated single-chain lipids, which are the primary product of abiotic lipid synthesis.3,4 While the high working concentrations of such species precluded the quantitative fluorescence-based analysis introduced here, previous ESR experiments have shown similar micelle–vesicle coexistence in a decanoic acid (C10) system.15
On the basis of the results described above, we present a potential scenario in which environmental fluctuations could drive repeated cycles of protocell growth and division. We begin by considering a small warm pond, containing dilute fatty acids and perhaps other single-chain amphiphiles, along with other organic compounds. We assume that fatty acids were present at a concentration sufficient to lead to the assembly of micelles and vesicles. Evaporation, driven by solar or geothermal heat and wind, would lead to progressive concentration of the dissolved solutes and thus to vesicle growth as material in micelles redistributed into the pre-existing vesicles. If the increase in surface area caused by membrane growth occurred faster than the increase in vesicle volume, as could happen in the presence of slowly permeating solutes such as nucleotides, amino acids, and peptides, growth would result in the formation of fragile filamentous vesicles. Our laboratory has previously demonstrated that such vesicles fragment easily in response to gentle shear forces, resulting in division into daughter vesicles.10 Alternatively, photochemically induced membrane tension can drive vesicle division through a pearling instability, similarly resulting in daughter vesicles.29 After a cycle of growth and division, an influx of fresh water, for example, as a result of rainfall, would dilute the pond water, restoring initial concentrations. Rapid mixing of fresh water with concentrated pond water would probably result in dissolution of many vesicles, while slower mixing would cause vesicle shrinkage; both processes would increase the fraction of fatty acids present as micelles. Vesicle division following growth into filamentous morphologies could also retard shrinkage, as membrane loss would be favored from undivided vesicles, which are characterized by excess membrane area. Surviving vesicles would then be poised for another cycle of growth, driven by evaporation, and division, induced either by wave-induced shear forces or photochemically.
Although this model is quite speculative, it has the advantage that cycles of growth and division would be driven entirely by environmental fluctuations and could continue indefinitely in the absence of any additional input of fatty acids. If such a cycle could be coupled to the replication of encapsulated nucleic acids, the stage would be set for the emergence of Darwinian evolution through the competitive advantage conferred by functional nucleic acids (e.g., ribozymes). The subsequent evolution of catalytic mechanisms to drive membrane growth, such as the assembly of double-chain lipids,12 would have eventually freed early cells from depending on environmental fluctuations to drive their cell cycle.
Materials and Methods
Lipid Solutions
Fatty acids were obtained from Nu-chek and phospholipids from Avanti Polar Lipids. Laurdan, NBD-PE (N-(7-nitrobenz-2-oxa-1,3-diazol-4-yl)-1,2-dihexadecanoyl-sn-glycero-3-phosphoethanolamine), and Rhodamine-DHPE (Rhodamine B 1,2-dihexadecanoyl-sn-glycero-3-phosphoethanolamine) were obtained from Invitrogen. All other reagents were from Sigma-Aldrich. Fatty acid vesicles were prepared by mixing the fatty acids (as neat oil) in 0.2 M bicine buffer titrated with NaOH to pH 8.5, unless otherwise noted. This was followed by vigorous vortexing and tumbling overnight. Micelle solutions were prepared by dissolving the fatty acid in water and titrating with sodium hydroxide to pH 10.5, unless otherwise noted. Phospholipid vesicles were prepared by thin-film rehydration of chloroform solutions. Laurdan was incorporated into the solutions as a concentrated stock in ethanol either before or after addition of buffer. FRET dyes were incorporated into fatty acid solutions by addition in chloroform to the neat oil, followed by rotary evaporation. Large, multilamellar vesicles used for imaging were prepared with 2 mM 8-hydroxypyrene-1,3,6-trisulfonic acid (HPTS), a water-soluble dye, in the buffer and were isolated via extrusion through a 5 μm filter followed by dialysis against a 3 μm filter, as previously described.31 All other vesicle solutions were extruded 11 times through 100 nm filters with an Avanti mini extruder. 50 nm vesicles were prepared with an additional 11 passes through a 50 nm filter.
Surface Tension Measurements
Surface tensions were measured by the Noüy ring method on a Fisher Scientific Surface Tensiometer 21. Samples (5 mL) were prepared by serially diluting a concentrated (100 mM) vesicle/micelle stock and then allowed to equilibrate for at least 24 h before measuring. All measurements were taken at 21 °C. Monomer concentrations were calculated from surface tension plots using the Langmuir–Szyszkowski equation
where σ is the measured surface tension; σ0 is the surface tension with no surfactant (72.8 dyn/cm); K is the equilibrium constant for surface adsorption; Γmax is the maximum surface excess; and c is the monomer concentration. Therefore
We obtained Γmax from the maximum slope of the surface tension vs log([fatty acid]) plot according to the Gibbs isotherm
Lastly, K was obtained by solving for c in the linear region below the cmc/cac.
Light Scattering Measurements
Light scattering intensities of oleate and palmitoleate solutions were measured on a PDDLS/Batch system (Precision Detectors, Bellingham, MA). Absorbance readings of myristoleic acid solutions were taken on an Amersham Ultraspec 3100 UV/vis spectrophotometer. All measurements were taken at 21 °C.
Laurdan Measurements
Steady state fluorescence readings were performed on a Varian Cary Eclipse fluorimeter. General polarization values were calculated from emission intensities at 500 and 430 nm upon excitation at 364 nm. All measurements were taken at 21 °C.
Partition Coefficients
Micelle to vesicle partition coefficients were derived from measured Laurdan intensities by equating observed GP to a weighted average of micelle and vesicle GPs. Characteristic vesicle (I500v, I430) and micelle (I500m, I430) Laurdan intensities for each fatty acid were measured at pH 8.5 and 10.5, respectively, and a concentration of either 30 mM (oleate, palmitoleate) or 50 mM (myristoleate). The micelle/vesicle partition was calculated by solving for Xm (micelle aggregation fraction) and Xv (vesicle aggregation fraction) in the following
where GP is the measured Laurdan polarization for the given sample. We note that this approach carries several assumptions: (1) the only existing aggregates are micelles or vesicles, with Laurdan equally distributed between them on a molar basis and with minimal contribution from the monomer phase; (2) Laurdan emission ratios at high concentrations (30 or 50 mM) at pH 8.5 or pH 10.5 approximate that in a pure vesicle or pure micelle solution, respectively. The latter assumption is limited by the excess light scattering of more concentrated vesicle solutions and the differing pKa's of the fatty acids, which likely result in a micelle:vesicle ratio of >0 at pH 8.5 and the reference concentrations used. Partition coefficients are therefore expressed as “apparent Xm/Xv”, which are relative to the solution standard used.
Micelle/vesicle partition coefficients were also derived from absorbance at 400 nm (Abs400c). The vesicle fraction was calculated as proportional to the normalized absorbance for the concentration above the cac (2 mM for myristoleate). The micelle fraction was assumed to be the difference between this and the normalized vesicle absorbance at 50 mM (Abs400), assuming Xv ∼ 1 at 50 mM. Therefore
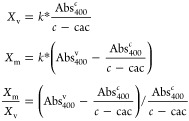 |
where k is the inverse of the absorption per unit concentration of 50 nm myristoleate vesicles and c is the solution concentration. This derivation involves the same assumptions used as for the Laurdan partition coefficients and is therefore comparable.
Vesicle Growth
Growth and shrinkage of 100 nm myristoleate vesicles was monitored as previously described.12,18 Briefly, 10 mM myristoleate vesicles were prepared with equal fractions of Rhodamine-DHPE and NBD-DHPE at a concentration of 0.2 mol % relative to total lipids. During experiments, FRET was recorded on a Cary Eclipse fluorimeter (excitation 430 nm) by quantifying FRET efficiency, Fε
where ED is the emission of the donor (530 nm) and ED,∞ the emission of the donor at infinite dilution, which was measured via addition of 1% Triton X100 at the end of the experiment. All values were adjusted for changes in volume. FRET efficiency was equated to surface area using a standard curve of 10 mM myrisoleate with varying concentrations of FRET dyes. Growth of large vesicles was observed on a Nikon TE2000-S inverted microscope using a 60X extra long working distance objective. All measurements were taken at 21 °C.
Solution Evaporation
Vesicle solutions (5 mM in 400 μL of 0.1 M Na+ bicine) were agitated via a stir bar in opaque 5 mL vials at 35 °C. Agitation was used to keep solutions homogeneous and prevent films from forming on the side of the vials. This method led to an evaporation rate of approximately 10 μL/h. Identical experiments were also performed without evaporation (using capped vials) to confirm that there was no measurable bleaching and/or dye degradation in time scales up to 40 h. Predicted relative surface area (SA) as a function of final concentration (c) was derived from the quadratic curve fit of the apparent Xm/Xv as a function of concentration in Figure 5B using the following
where ((Xm)/(Xv)5mM) is the micelle–vesicle partition at 5 mM (initial concentration) and ((Xm)/(Xv)c) is the micelle–vesicle partition at the final concentration.
Acknowledgments
J.W.S. is an investigator of the Howard Hughes Medical Institute. This research was supported in part by grant EXB02-0031-0018 from the NASA Exobiology Program to J.W.S. I.B. was supported by a fellowship from Harvard University. A.D. was supported by a fellowship from the Harvard Origins of Life Initiative. The authors thank Noam Prywes, Raphael Bruckner, Christian Hentrich, Craig Blain, and Anders Bjorkbom for helpful discussions and comments on the manuscript.
Supporting Information Available
Supplemental figures and schemes. This material is available free of charge via the Internet at http://pubs.acs.org.
Author Present Address
† Miller Institute for Basic Research in Science, University of California, Berkeley, 2536 Channing Way, Berkeley, CA 94720, USA.
The authors declare no competing financial interest.
Supplementary Material
References
- Gebicki J. M.; Hicks M. Nature 1973, 243, 232–234. [DOI] [PubMed] [Google Scholar]
- Hargreaves W. R.; Deamer D. W. Biochemistry 1978, 17, 3759–3768. [DOI] [PubMed] [Google Scholar]
- Rushdi A. I.; Simoneit B. R. Origins Life Evol. Biospheres 2001, 31, 103–118. [DOI] [PubMed] [Google Scholar]
- Simoneit B. R. T. Adv. Space Res. 2004, 33, 88–94. [Google Scholar]
- Yuen G. U.; Kvenvolden K. A. Nature 1973, 246, 301–303. [Google Scholar]
- Deamer D. W. Nature 1985, 317, 792–794. [Google Scholar]
- Hanczyc M. M.; Fujikawa S. M.; Szostak J. W. Science 2003, 302, 618–622. [DOI] [PMC free article] [PubMed] [Google Scholar]
- Mansy S. S.; Schrum J. P.; Krishnamurthy M.; Tobe S.; Treco D. A.; Szostak J. W. Nature 2008, 454, 122–125. [DOI] [PMC free article] [PubMed] [Google Scholar]
- Mansy S. S.; Szostak J. W. Proc. Natl. Acad. Sci. U.S.A. 2008, 105, 13351–13355. [DOI] [PMC free article] [PubMed] [Google Scholar]
- Zhu T. F.; Szostak J. W. J. Am. Chem. Soc. 2009, 131, 5705–5713. [DOI] [PMC free article] [PubMed] [Google Scholar]
- Chen I. A.; Roberts R. W.; Szostak J. W. Science 2004, 305, 1474–1476. [DOI] [PMC free article] [PubMed] [Google Scholar]
- Budin I.; Szostak J. W. Proc. Natl. Acad. Sci. U.S.A. 2011, 108, 5249–5254. [DOI] [PMC free article] [PubMed] [Google Scholar]
- Cistola D. P.; Hamilton J. A.; Jackson D.; Small D. M. Biochemistry 1988, 27, 1881–1888. [DOI] [PubMed] [Google Scholar]
- Haines T. H. Proc. Natl. Acad. Sci. U.S.A. 1983, 80, 160–164. [DOI] [PMC free article] [PubMed] [Google Scholar]
- Dejanović B.; Mirosavljević K.; Noethig-Laslo V.; Pečar S.; Šentjurc M.; Walde P. Chem. Phys. Lipids 2008, 156, 17–25. [DOI] [PubMed] [Google Scholar]
- Fukuda H.; Goto A.; Yoshioka H.; Goto R.; Morigaki K.; Walde P. Langmuir 2001, 17, 4223–4231. [Google Scholar]
- Blöchliger E.; Blocher M.; Walde P.; Luisi P. L. J. Phys. Chem. B 1998, 102, 10383–10390. [Google Scholar]
- Chen I. A.; Szostak J. W. Biophys. J. 2004, 87, 988–998. [DOI] [PMC free article] [PubMed] [Google Scholar]
- Budin I.; Bruckner R. J.; Szostak J. W. J. Am. Chem. Soc. 2009, 131, 9628–9629. [DOI] [PMC free article] [PubMed] [Google Scholar]
- Budin I.; Szostak J. W. Annu. Rev. Biophys. 2010, 39, 245–263. [DOI] [PMC free article] [PubMed] [Google Scholar]
- Parasassi T.; Krasnowska E. K.; Bagatolli L.; Gratton E. J. Fluoresc. 1998, 8, 365–373. [Google Scholar]
- Harris F. M.; Best K. B.; Bell J. D. Biochim. Biophys. Acta, Biomembr. 2002, 1565, 123–128. [DOI] [PubMed] [Google Scholar]
- Bruckner R. J.; Mansy S. S.; Ricardo A.; Mahadevan L.; Szostak J. W. Biophys. J. 2009, 97, 3113–3122. [DOI] [PMC free article] [PubMed] [Google Scholar]
- Parasassi T.; De Stasio G.; Ravagnan G.; Rusch R. M.; Gratton E. Biophys. J. 1991, 60, 179–189. [DOI] [PMC free article] [PubMed] [Google Scholar]
- Clint J. H.Surfactan Aggregation; Blackie: Glasgow and London, 1992. [Google Scholar]
- Tanford C.The Hydrophobic Effect: Formation of Micelles and Biological Membranes, 2nd ed; Wiley: New York, 1980. [Google Scholar]
- Mahieu N.; Canet D.; Cases J. M.; Boubel J. C. J. Phys. Chem. 1991, 95, 1844–1846. [Google Scholar]
- Huang J. B.; Zhao G. X. Colloid Polym. Sci. 1995, 273, 156–164. [Google Scholar]
- Zhu T. F.; Adamala K.; Zhang N.; Szostak J. W. Proc. Natl. Acad. Sci. U.S.A. 2012, 109, 9828–9232. [DOI] [PMC free article] [PubMed] [Google Scholar]
- Israelachvili J. N.; Mitchell D. J.; Ninham B. W. J. Chem. Soc., Faraday Trans. 2: Mol. Chem. Phys. 1976, 72, 1525–1568. [Google Scholar]
- Zhu T. F.; Szostak J. W. PLoS One 2009, 4, e5009. [DOI] [PMC free article] [PubMed] [Google Scholar]
Associated Data
This section collects any data citations, data availability statements, or supplementary materials included in this article.


