

Abstract
Genome-wide association studies (GWAS) have successfully identified a number of single-nucleotide polymorphisms (SNPs) associated with colorectal cancer (CRC) risk. However, these susceptibility loci known today explain only a small fraction of the genetic risk. Gene-gene interaction (GxG) is considered to be one source of the missing heritability. To address this, we performed a genome-wide search for pair-wise GxG associated with CRC risk using 8,380 cases and 10,558 controls in the discovery phase and 2,527 cases and 2,658 controls in the replication phase. We developed a simple, but powerful method for testing interaction, which we term the Average Risk Due to Interaction (ARDI). With this method, we conducted a genome-wide search to identify SNPs showing evidence for GxG with previously identified CRC susceptibility loci from 14 independent regions. We also conducted a genome-wide search for GxG using the marginal association screening and examining interaction among SNPs that pass the screening threshold (p<10−4). For the known locus rs10795668 (10p14), we found an interacting SNP rs367615 (5q21) with replication p = 0.01 and combined p = 4.19×10⁻⁸. Among the top marginal SNPs after LD pruning (n = 163), we identified an interaction between rs1571218 (20p12.3) and rs10879357 (12q21.1) (nominal combined p = 2.51×10⁻⁶; Bonferroni adjusted p = 0.03). Our study represents the first comprehensive search for GxG in CRC, and our results may provide new insight into the genetic etiology of CRC.
Introduction
Genome-wide association studies (GWAS) have successfully identified single-nucleotide polymorphisms (SNPs) associated with colorectal cancer (CRC) [1]–[10]. As biologic candidates, those findings have enhanced our understanding of the genetic etiology of CRC. However, the susceptibility loci found so far explain only a small fraction of the genetic risk: the “missing heritability” problem [7]. Among other explanations, the lack of a comprehensive examination of gene-gene interaction (GxG) is often considered as one possible source for the unexplained heritability [11]–[14]. A recent paper also suggests that the missing heritability problem could be due to the overestimation of additive heritability if the assumption that there is no GxG or GxE interaction is incorrect [15]. The standard GWAS test for association is to use a single-locus approach, testing one SNP at a time across the entire genome; however, the underlying genetic mechanism of a complex disease, like CRC, probably involves interplays among multiple loci. Testing each locus individually without considering other loci with which it may interact may miss true genetic effects. Compared to the single-locus approach, there have been very few genome-wide examinations of GxG, probably at least partially due to the limited availability of individual-level large-scale GWAS data and analytical difficulties and limitations in computation given the massive number of possible interactions. A genome-wide study of psoriasis has reported compelling evidence for an interaction between variants at the HLA-C and ERAP1 loci [16]. Another study identified a GxG between a previously identified locus C1orf106 and a new locus TEC for Crohn’s disease, with the interaction successfully replicated in an independent dataset [17]. So far, no GxG has been identified for CRC.
In this paper, we focus on testing pair-wise GxG for CRC using GWAS data in the Genetics and Epidemiology of Colorectal Cancer Consortium (GECCO) and the Colon Cancer Family Registry (CCFR) with a total sample size of 10,907 cases and 13,216 controls. We present a simple, but powerful method for testing interaction: the Average Risk Due to Interaction (ARDI). We performed a genome-wide search to identify SNPs interacting with previously identified CRC susceptibility loci in 14 independent regions (rs6687758/1q41, rs10936599/3q16.2, rs16892766/8q23.3, rs6983267/8q24, rs10795668/10p14, rs3802842/11q23, rs7136702/12q13.13, rs4444235/14q22.2, rs4779584/15q13, rs9929218/16q22.1, rs4939827/18q21, rs10411210/19q13, rs961253/20p12.3, rs4925386/20q13.33) [1]–[10]. We gave priority to these known susceptibility loci because they have been confirmed to be associated with CRC risk in previous studies. We also conducted a genome-wide search for pair-wise GxG. In order to alleviate the computational burden and reduce the number of multiple comparisons, we used marginal association screening and examined only pairwise interactions among the SNPs passing that screen.
Results
GxG for 14 known CRC Susceptibility Loci
After applying the QC and selection criteria, there were a total of 2,011,668 SNPs in common among studies in the Phase I studies (Materials and Methods; Table 1).
Table 1. Studies in Genetics and Epidemiology Colorectal Cancer Consortium (GECCO).
| Study | Case† | Control† | Female | Colon | Age (yrs) | |||||||||||
| No. | % | No. | % | Mean | Range | |||||||||||
| Phase I | N = 8,380 | N = 10,558 | ||||||||||||||
| ASTERISK | 948 | 947 | 782 | 41.3 | 661 | 69.7 | 65.3 | 40–99 | ||||||||
| CCFR | 1,171 | 983 | 1,077 | 50.0 | 569 | 48.6 | 56.2 | 19–83 | ||||||||
| Colo2&3 | 87 | 125 | 95 | 44.8 | 59 | 67.8 | 65.2 | 38–86 | ||||||||
| DACHS I | 1,710 | 1,708 | 1,395 | 40.8 | 1,037 | 60.6 | 68.6 | 33–98 | ||||||||
| DALS I | 706 | 710 | 615 | 43.4 | 702 | 99.4 | 65.0 | 30–79 | ||||||||
| MEC | 328 | 346 | 313 | 46.4 | 241 | 73.5 | 63.0 | 45–76 | ||||||||
| OFCCRa | 650 | 522 | 610 | 52.0 | 435 | 66.9 | 62.1 | 29–77 | ||||||||
| PLCO ¶ | 1,019 | 2,391 | 1,050 | 30.8 | 836 | 82.0 | 64.0 | 55–75 | ||||||||
| VITAL | 285 | 288 | 273 | 47.6 | 215 | 75.4 | 66.5 | 50–76 | ||||||||
| WHI | 1,476 | 2,538 | 4,014 | 100 | 1,157 | 78.4 | 67.9 | 50–79 | ||||||||
| Phase II | N = 2,527 | N = 2,658 | ||||||||||||||
| DACHS II | 675 | 498 | 440 | 37.5 | 375 | 55.6 | 69.1 | 35–99 | ||||||||
| DALS II | 410 | 464 | 414 | 47.4 | 410 | 100 | 65.4 | 30–79 | ||||||||
| HPFS | 227 | 230 | 0 | 0 | 158 | 69.6 | 66.4 | 48–82 | ||||||||
| NHS | 553 | 955 | 1,508 | 100 | 420 | 75.9 | 59.8 | 44–69 | ||||||||
| PHS | 382 | 389 | 0 | 0 | 296 | 77.5 | 59.6 | 40–85 | ||||||||
| PMH | 280 | 122 | 402 | 100 | 206 | 73.6 | 64.5 | 50–75 | ||||||||
| Total = 10,907 | Total = 13,216 | |||||||||||||||
| Adenoma studies | N = 826 | N = 923 | ||||||||||||||
| HPFS Adv Adnm | 313 | 345 | 0 | 0 | 245* | 78.3 | 60.7 | 48–81 | ||||||||
| NHS Adv Adnm | 513 | 578 | 1,091 | 100 | 401* | 78.1 | 57.0 | 44–69 | ||||||||
Sample size excludes overlap with CCFR;
Sample sizes given only for subjects clustering with HapMap CEU population in PCA (for data that has undergone QC);
Includes participants with data downloaded from dbGaP prostate and lung studies;*for adenoma, number and % colon does not include subjects with adenomas located in both colon and rectum.
We selected interactions that have fixed-effect meta-analysis p-values <10−6 in Phase I for replication in Phase II. These interactions are summarized in Table 2. For SNPs that are in LD (r2>0.8), we reported only the most significant interacting SNP. Overall we identified 12 interactions with p<10−6 in Phase 1, including three interacting SNPs selected for each of the known loci rs6687758, rs4925386; two interacting SNPs selected for known locus rs7136702, and one interacting SNP for each of known locus rs4779584, rs10795668, rs9929218, and rs961253, respectively.
Table 2. Results for selected top interactions for known CRC loci with p-value less than 10−6 in Phase I studies.
| Known Locus/region | Interacting SNP/region | MAF | Phase I InteractionOR (95% CI) P | Phase IIInteractionOR (95% CI) P | CombinedInteractionOR (95% CI) P | CombinedPhet * |
| rs6687758/1q41 | rs9365723/6q25.3 | 0.43 | 0.75 (0.67–0.84) 5.83×10⁻⁷ | 0.95 (0.77–1.17) 0.63 | 0.79 (0.71–0.87) 3.79×10⁻⁶ | 0.75 |
| rs39453/7p15.3 | 0.37 | 0.74 (0.66–0.83) 6.34×10⁻⁷ | 0.92 (0.74–1.13) 0.42 | 0.78 (0.70–0.86) 2.08×10⁻⁶ | 0.54 | |
| rs17777943/10q24.32 | 0.10 | 0.62 (0.51–0.74) 2.77×10⁻⁷ | 1.11 (0.80–1.55) 0.53 | 0.71 (0.60–0.83) 2.81×10⁻⁵ | 0.40 | |
| rs10795668/10p14 | rs367615/5q21.3 | 0.27 | 0.74 (0.66–0.84) 8.95×10 −7 | 0.76 (0.61–0.95) 0.01 | 0.74 (0.67–0.83) 4.19×10 −8 | 0.39 |
| rs7136702/12q13.13 | rs17730929/4q13.2 | 0.10 | 0.62(0.51–0.74) 1.72×10⁻⁷ | 0.97 (0.68 –1.40) 0.88 | 0.68 (0.58–0.80) 2.78×10⁻⁶ | 0.09 |
| rs751147/14q21.2 | 0.27 | 0.73 (0.65–0.82) 8.89×10⁻⁸ | 1.16 (0.93–1.45) 0.19 | 0.80 (0.72–0.89) 3.5×10⁻⁵ | 0.13 | |
| rs4779584/15q13/CRAC1 | rs10114408/9q22.31 | 0.24 | 0.67 (0.58–0.78) 3.26×10⁻⁷ | 0.93 (0.71–1.20) 0.56 | 0.73 (0.64–0.83) 2.54×10⁻⁶ | 0.28 |
| rs9929218/16q22.1/CDH1 | rs468905/16q21 | 0.28 | 0.76 (0.68–0.85) 7.14×10⁻⁷ | 1.03 (0.85 –1.26) 0.75 | 0.82 (0.74–0.90) 2.8×10⁻⁵ | 0.36 |
| rs961253/20p12.3/BMP2 | rs1661409/11q22.1 | 0.41 | 1.36 (1.20–1.54) 9.37×10⁻⁷ | 0.97 (0.78–1.20) 0.74 | 1.25 (1.12–1.39) 4.37×10⁻⁵ | 0.05 |
| rs4925386/20q13.33 | rs2500295/1p36.32 | 0.20 | 1.33 (1.19–1.50) 8.59×10⁻⁷ | 0.90 (0.73–1.11) 0.33 | 1.22 (1.10–1.35) 1.25×10⁻⁴ | 0.06 |
| rs4591517/3p24.3 | 0.28 | 1.31 (1.18–1.46) 6.92×10⁻⁷ | 1.06 (0.88–1.29) 0.54 | 1.25 (1.14–1.37) 3.26×10⁻⁶ | 0.21 | |
| rs1394349/18q21.2 | 0.10 | 1.51 (1.28–1.78) 8.31×10⁻⁷ | 0.98 (0.72–1.34) 0.89 | 1.38 (1.19–1.59) 1.72×10⁻⁵ | 0.08 |
Phet is the heterogeneity p-value.
Within Phase II, the interaction between known loci rs10795668 and rs367615 showed evidence for replication (OR = 0.76, 95% CI 0.61–0.95; p = 0.01) with a combined Phase I and II OR of 0.74 (95%CI 0.67–0.83; p = 4.19×10̂-8). rs367615 is located on 5q21 and has a MAF of 0.22 in CEU population. Additional inclusion of two advanced colorectal adenoma studies in the replication study further strengthened the statistical significance level of the replication (OR = 0.78 and 8.97×10⁻³); OR and p-value for Phase I, II and advanced adenoma studies combined are 0.75 and 2.88×10⁻⁸. rs10795668 was genotyped in 10 studies and imputed in 11 studies with average imputation R2 of 0.97 (range from 0.92 to 1.00); rs367615 was genotyped in 4 studies and imputed in 17 studies with average R2 of 0.98 (range from 0.91 to 1.00). The forest plot showing individual study results is presented in Figure 1. We did not observe evidence for heterogeneity, and random effects results are similar to fixed effects results for this interaction. Figure 2 shows the regional association plot. Several LD partners of rs367615 also show evidence of interaction with rs10795668.
Figure 1. Forest plot for meta-analysis results of GxG between rs10795668 and rs367615.

Box sizes are proportional to the inverse variance for each study and the lines depict the confidence intervals. The diamonds represent the fixed effects meta-analysis results, with the width of the diamond representing the confidence interval. The results of two advanced adenoma studies (HPFS Adv Adnm and NHS Adv Adnm) are shown at the bottom but not incorporated in the meta-analysis.
Figure 2. Regional interaction association plot for interacting region 5q21 with known CRC locus rs10795668.

The left y-axis shows the -log10 of the meta-analysis interaction p value. The right y-axis shows the recombination rate. Each dot on the plot represents the result for one SNP. The diamond dot represents SNP rs367615 and the round dots represent other SNPs. Difference colors of SNPs indicate different LD strength between the corresponding SNP and rs367615, measured by r2. The bottom of the figure shows the genes in the plotted region.
We also examined the two-locus interaction pattern for the SNP pair described above using a unrestricted model. Table 3(a) summarizes the OR and sample size for each genotype combination relative to the reference genotypes for Phase I and II studies combined. Table 3(b) and Table 3(c) summarize the OR for each SNP stratified by the genotypes of the other. In Table 3, we can see that subjects who carry AG genotype for rs10795668 and CT genotypes for rs367615 have a statistically significantly increased disease risk compared to those who carry reference genotypes at both loci (rs10795668:GG/rs367615:TT). However, for subjects who carry AG or AA genotype for rs10795668, carrying CT genotypes significantly decreases the disease risk. The interaction OR can also be calculated from the table. For example, if there were no interaction effect, samples that carry GG for rs10795668 and CT for rs367615 would have an increased risk compared to the reference group (OR would be 1.03*1.11 = 1.14). However, they actually have a statistically significantly decreased risk (OR = 0.87; p = 2.99×10⁻³) because of the interaction (OR = 0.76). The interaction OR’s of rs10795668:AG/rs367615:CT, rs10795668:AG/rs367615:CC, rs10795668:AA/rs367615:CT and rs10795668:AA/rs367615:CC in Table 3(a) can easily be calculated to be 0.76, 1.01, 0.60 and 0.89, respectively. This looks like an unusual interaction pattern. However, it is worth noting that the sample size is relatively small when the genotype of rs367615 is CC and as a result, all OR estimates in the third column have large p-values and wide confidence intervals. To account for the small sample size, and to aid interpretation, we re-constructed the interaction table by combining the CT and CC genotype of rs367615 and the AG and AA genotypes of rs10795668. Table 3(d) shows that the CT/CC genotypes of rs367615 have an increased risk when the genotype of rs10795668 is GG. On the other hand, the combination of AG/AA genotype of rs10795668 and CT/CC genotype of rs367615 has a protective effect.
Table 3. Interaction pattern between rs10795668 and rs367615.
| Table 3(a). | |||
| rs367615:TT | rs367615:CT | rs367615:CC | |
| rs10795668:GG | 1 | 1.11 (1.02–1.22) 1.73×10⁻² | 1.07 (0.87–1.32) 5.18×10⁻¹ |
| 3212/3968 | 1599/1783 | 229/246 | |
| rs10795668:AG | 1.03 (0.95–1.10) 5.00×10⁻¹ | 0.87 (0.80–0.95) 2.99×10⁻³ | 1.12 (0.92–1.36) 2.50×10⁻¹ |
| 2896/3585 | 1355/1858 | 349/316 | |
| rs10795668:AA | 1.14 (1.01–1.30) 3.19×10⁻² | 0.76 (0.64–0.89) 9.35×10⁻⁴ | 1.10 (0.85–1.42) 4.52×10⁻¹ |
| 691/771 | 319/493 | 250/193 | |
| For each combination of genotypes, we computed the odds ratio (95% CI), and pvalue relative to the baseline group (rs10795668:GG; rs367615:TT). We also list the sample size for cases/controls. | |||
| Table 3(b) . OR of rs367615 stratified by rs10795668 | |||
| rs367615:TT | rs367615:CT | rs367615:CC | |
| rs10795668:GG | 1 | 1.11 (1.02–1.22) 1.73×10⁻² | 1.07 (0.87–1.32) 5.18×10⁻¹ |
| rs10795668:AG | 1 | 0.85 (0.78–0.93) 5.82×10⁻⁴ | 1.09 (0.90–1.33) 3.70×10⁻¹ |
| rs10795668:AA | 1 | 0.66 (0.55–0.80) 2.96×10⁻⁵ | 0.96 (0.73–1.27) 7.88×10⁻¹ |
| Table 3(c) . OR of rs107895668 stratified by rs367615 | |||
| rs367615:TT | rs367615:CT | rs367615:CC | |
| rs10795668:GG | 1 | 1 | 1 |
| rs10795668:AG | 1.03 (0.95–1.10) 5.00×10⁻¹ | 0.78 (0.70–0.87) 5.27×10⁻⁶ | 1.05 (0.80–1.37) 7.43×10⁻¹ |
| rs10795668:AA | 1.14 (1.01–1.30) 3.19×10⁻² | 0.68 (0.57–0.81) 1.17×10⁻⁵ | 1.03 (0.76–1.40) 8.58×10⁻¹ |
| Table 3(d) . Interaction pattern between rs10795668 and rs367615 by combining the heterozygous and homozygous minor genotypes. | |||
| rs367615:TT | rs367615:CT/CC | ||
| rs10795668:GG | 1 | 1.11 (1.02–1.20) 1.96×10⁻² | |
| rs10795668:AG/AA | 1.05 (0.98–1.12) 1.92×10⁻¹ | 0.88 (0.81–0.95) 1.67×10⁻³ | |
As we have fit ARDI and unrestricted model for the top interaction between rs10795668 and rs367615, it would be interesting to also see the results from the multiplicative model. The multiplicative interaction OR is estimated to be 0.83 with combined p = 3.14×10⁻⁶, which is less significant compared to ARDI model.
GxG among Top Marginal SNPs
Based on the meta-analysis results of the marginal association analysis for all except two advanced adenoma studies, we selected 606 SNPs for testing GxG with MAF>0.05, average R2>0.3, and both fixed and random effect meta-analysis p<0.0001. Both fixed and random effect p-values were used because we wanted to avoid selecting SNPs with signal dominated by a few studies. With this selection criterion, all chosen SNPs had heterogeneity p-value >0.1. After applying a LD-pruning routine (Materials and Methods), 163 SNPs remained.
In Phase I, we observed five pairs of SNPs with fixed-effect meta-analysis interaction p-value<5×10⁻⁵ (Table 4). These five interactions point to 3 independent findings, as indicated by correlation of the first two SNPs (rs2170568 and rs7006896, r2 = 0.78) and the next two SNPs (rs2200579 and rs10879357, r2 = 0.75). In the replication, the GxG between rs1571218/20p12.3 and the two correlated SNPs rs2200579 and rs10879357 which are on 12q21.1 are significant at level 0.1 (p-values are 0.04 and 0.06, respectively), with interaction ORs in the same direction. The combined Phase I and II analysis OR and p-values are 0.81 and 4.61×10⁻⁶ and 0.80 and 2.51×10⁻⁶, respectively. The interaction between rs1571218 and rs10879357 passed the Bonferroni correction with threshold 3.79×10−6 = 0.05/(163*162/2). After including the two advanced colorectal adenoma studies, the replication OR and p-value are 0.89 and 0.17 for rs1571218 and rs10879357; the combined analysis OR and p-value are 0.82 and 1.15×10⁻⁵. rs1571218 was well imputed in all studies with average imputation R2 of 0.95 (range from 0.91 to 0.98); rs10879357 was genotyped in 11 studies and imputed in 10 studies with average R2 of 0.78 (range from 0.76 to 0.80). The forest plot shows consistent results across the individual studies (Figure 3). Again, we did not observe heterogeneity and random effects results are similar to fixed effects results.
Table 4. Results for selected top interactions among top marginal loci with p-value less than 5×10⁻⁵ in Phase I studies.
| Interacting SNP 1/region | MAF 1 | Interacting SNP 2/region | MAF 2 | Phase I InteractionOR(95% CI) P | Phase II InteractionOR(95% CI) P | Combined InteractionOR(95% CI) P | Combined Phet |
| rs11106204/12q21.33 | 0.21 | rs2170568/8q24.21 | 0.17 | 1.38 (1.19–1.60) 1.33×10⁻⁵ | 0.97 (0.75–1.26) 0.82 | 1.27 (1.12–1.44) 2.24×10⁻⁴ | 0.02 |
| rs7006896/8q24.21 | 0.17 | 1.38 (1.19–1.59) 1.29×10⁻⁵ | 0.97 (0.75–1.26) 0.82 | 1.27 (1.12–1.44) 2.16×10⁻⁴ | 0.03 | ||
| rs1571218/20p12.3 | 0.48 | rs2200579/12q21.1 | 0.31 | 0.81 (0.73–0.89) 4.72×10 −5 | 0.81 (0.67–0.99) 0.04 | 0.81 (0.74–0.89) 4.61×10 −6 | 0.77 |
| rs10879357/12q21.1 | 0.38 | 0.79 (0.70–0.88) 1.37×10 −5 | 0.83 (0.69–1.01) 0.06 | 0.80 (0.72–0.88) 2.51×10 −6 | 0.74 | ||
| rs4766549/12q24.11 | 0.16 | rs10879357/12q21.1 | 0.38 | 0.73 (0.63–0.85) 3.03×10⁻⁵ | 0.90 (0.70–1.17) 0.43 | 0.77 (0.68–0.88) 6.3×10⁻⁵ | 0.71 |
Phet is the heterogeneity p-value.
Figure 3. Forest plot for meta-analysis results of GxG between rs1571218 and rs10879357.

Box sizes are proportional to the inverse variance for each study and the lines depict the confidence intervals. The diamonds represent the fixed effects meta-analysis results, with the width of the diamond representing the confidence interval. The results of two advanced adenoma studies (HPFS Adv Adnm and NHS Adv Adnm) are shown at the bottom but not incorporated in the meta-analysis.
The two-locus interaction pattern for rs1571218 and rs10879357 is summarized in Table 5(a). The OR for each SNP stratified by the genotypes of the other are summarized in Table 5(b) and Table 5(c). In Table 5, we can see that all non-reference combinations are associated with an increased disease risk compared to the reference group. However, due to interactions with inverse associations, the risks are not as large as they would have been without interaction. For example, if there were no interaction effect, persons who carry AG for rs10879357 and GT for rs1571218 would have an higher risk compared to the reference group (OR = 1.12×1.18 = 1.32). However, the risk is lower (OR = 1.08) because of the interaction (OR = 0.82). Computed as above, the interaction OR’s of rs1571218:GT/rs10879357:AG, rs1571218:GT/rs10879357:AA, rs1571218:TT/rs10879357:AG and rs1571218:TT/rs10879357:AA in Table 5(a) are 0.82, 0.84, 0.83 and 0.89, respectively, which seems to follow a dominant genetic model. Table 5(b) shows the deleterious association with allele A of rs10879357 seems to be offset by the allele T of rs1571218. A similar pattern can also be observed for rs1571218 in Table 5(c). This indicates that there may be an exclusive interaction between rs10879357 and rs1571218.
Table 5. Interaction pattern between rs1571218 and rs10879357.
| Table 5(a) | |||
| rs10879357:GG | rs10879357:AG | rs10879357:AA | |
| rs1571218:GG | 1 | 1.12 (1.00–1.25) 4.96×10⁻² | 1.36 (1.18–1.57) 2.22×10⁻⁵ |
| 1383/1918 | 1930/2457 | 729/781 | |
| rs1571218:GT | 1.18 (1.06–1.31) 3.31×10⁻³ | 1.08 (0.98–1.20) 1.32×10⁻¹ | 1.35 (1.18–1.54) 1.03×10⁻⁵ |
| 1781/2186 | 2384/3022 | 948/1008 | |
| rs1571218:TT | 1.35 (1.16–1.57) 9.59×10⁻⁵ | 1.25 (1.09–1.44) 1.35×10⁻³ | 1.63 (1.33–2.00) 2.20×10⁻⁶ |
| 599/649 | 787/885 | 345/308 | |
| For each combination of genotypes, we computed the odds ratio (95% CI) and pvalue relative to the baseline group (rs1571218:GG; rs10879357:GG). We also list the sample size for cases/controls. | |||
| Table 5(b) . OR of rs10879357 stratified by rs1571218 | |||
| rs10879357:GG | rs10879357:AG | rs10879357:AA | |
| rs1571218:GG | 1 | 1.12 (1.00–1.25) 4.96×10⁻² | 1.36 (1.18–1.57) 2.22×10⁻⁵ |
| rs1571218:GT | 1 | 0.92 (0.83–1.01) 8.81×10⁻² | 1.14 (1.01–1.30) 4.05×10⁻² |
| rs1571218:TT | 1 | 0.93 (0.78–1.11) 4.10×10⁻¹ | 1.21 (0.96–1.51) 1.03×10⁻¹ |
| Table 5(c) . OR of rs 1571218 stratified by rs10879357 | |||
| rs10879357:GG | rs10879357:AG | rs10879357:AA | |
| rs1571218:GG | 1 | 1 | 1 |
| rs1571218:GT | 1.18 (1.06–1.31) 3.31×10⁻³ | 0.97 (0.88–1.07) 5.06×10⁻¹ | 0.99 (0.84–1.16) 8.85×10⁻¹ |
| rs1571218:TT | 1.35 (1.16–1.57) 9.59×10⁻⁵ | 1.12 (0.98–1.28) 8.69×10⁻² | 1.20 (0.96–1.49) 1.12×10⁻¹ |
We also calculated the multiplicative interaction OR ( = 0.94) and combined p ( = 0.08) between rs1571218 and rs10879357.
Discussion
In this large study, we performed a genome-wide search for pairwise GxG for each of the known CRC susceptibility loci and among top SNPs with small p-values for marginal effects. To our knowledge, this represents the first comprehensive GxG scan for colorectal cancer. The most significant interaction found in our examination of known loci and other SNPs genome-wide was between the known locus rs10795668 (10p14) and rs367615 (5q21) with replication p = 0.01 and combined p = 4.19×10⁻⁸. The effect sizes are very similar in Phase I and Phase II studies, and there is no evidence of heterogeneity (Phet = 0.39). Among the top marginal SNPs, the most promising interaction was between rs1571218 (20p12.3) and rs10879357 (12q21.1) (nominal p = 2.51×10⁻⁶; adjusted p = 0.03). Again, the effect sizes are very similar in Phase I and Phase II studies and there is little evidence for heterogeneity (Phet = 0.74).
The known locus rs10795668 in our identified interaction is located in an intergenic region within 10p14. So far, the function of this SNP has not been clearly defined and it has not been related to specific gene(s). The nearest predicted genes in this region are BC031880 and HV455515 and DD431424, the latter two are newly identified regulator genes for hTERT, a genetic region that contains susceptibility loci of multiple different cancers, including colorectal cancer [9], [18]–[27]. Other genes close by are TAF3 and GATA3 (∼0.6 M bp). GATA3 belongs to the GATA family of transcription factors, which are important for T-cell development. TAF3 is a TBP-associated factor (TAF); these contribute to promoter recognition and selectivity and act as antiapoptotic factors [28]. rs10795668 has also been found to be correlated with the expression of ATP5C1 [29], which is involved in cell metabolism. rs367615 is located in an intergenic region within 5q21, where there is one member of the Wnt signaling pathway (APC) known to be important in both familial and non-familial colorectal cancer as well as MCC, perhaps also important in CRC [30], [31]. The closest genes to rs367615 are PJA2, MAN2A1 and FER. PJA2 is responsible for ubiquitination of cAMP-dependent protein kinase type I and type II-alpha/beta regulatory subunits and for targeting them for proteasomal degradation [32]. PJA2 has been found to bind the ubiquitin-conjugating enzyme UbcH5B [33], which functions in the ubiquitination of the tumor-suppressor protein p53. FER regulates cell-cell adhesion and mediates signaling from the cell surface to the cytoskeleton via growth factor receptors. MAN2A1 is a Golgi enzyme important in N-glycan processing [34]. Upon additional bioinformatic analysis, we identified two potential functional candidates, rs2201016 and rs2201015, that are in strong LD with rs367615 (r2 values of 1 and 0.916 respectively). As shown in the UCSC Genome Browser view (Figure S2, Table S2), rs2201016 and rs2201015 fall within a region of strong DNAse hypersensitivity and evolutionary conservation. As shown in Table 3(a), the interaction seems to be driven by the CT group of rs367615, which is an uncommon phenomenon and may be related to heterozygote advantage. However, the minor allele heterozygous (CC) genotype is relatively rare, making it difficult to conclusively estimate the effect size in that genotyped. Although both SNPs point to potentially relevant genes involved in cancer development, advancing basic research and translating these GWAS findings in to clinical benefit will require further functional characterization through in vitro and in vivo analysis.
We observed a statistically significant interaction between rs1571218/20p12.3 and rs10879357/12q21.1 (and a marginally significant interaction with a close by and correlated SNP, rs2200579). The SNP rs1571218 is in the same region (20p12.3) and modestly correlated (r2 = 0.56) with the known CRC locus rs961253. The closest gene is bone morphogenetic protein 2 (BMP2), which is part of transforming growth factor-beta (TGF-β) pathway. The TGF-β pathway plays an important role in cell proliferation, differentiation, and apoptosis [35] and is established as important in CRC [36]. Two interacting SNPs rs2200579 and rs10879357 are close together (<4 k bp apart) at 12q21.1 and are correlated (r2 = 0.76). These SNPs fall in the intronic region of TPH2, which is a rate-limiting enzyme in the synthesis of serotonin [37]. Serotonin is known to be involved in numerous central nervous activities. There is also evidence that serotonin is mitogenic in different cancer cell lines [38]–[40]. One study has shown that lack of serotonin causes a reduction of tumor growth in a mouse model of colon cancer allografts [41]. Further bioinformatic analysis revealed that rs10879357 is in LD (r2 = 0.697) with a synonymous coding SNP (rs4290270) in the exonic region towards the tail end of TPH2. Further in vivo or in vitro analysis is necessary to determine whether this variant has a functional impact such as mRNA stability. Because rs2200579 and rs10879357 are in a gene rich region, it is also possible that the SNPs impact genes other than TPH2.
In this paper, studies were divided into Phase I and II according to the time their genotype data became available. Phase II was expected to serve as validation/replication of Phase I. For the known loci GxG search, the Phase II p-value between rs10795668 and rs367615 is 0.01, which is nominally significant at the 0.05 level but does not pass the Bonferroni threshold (0.05/12). Among the top marginal SNPs, the Phase II p-value between rs1571218 and rs10879357 also does not pass the Bonferroni threshold (0.05/5) even when the combined p-value passes the Bonferroni threshold (3.79×10−6 = 0.05/(163*162/2)). In fact, combined test was recommended in two-stage GWAS because the replication test has been shown to be less efficient compared to combined test [42]. Therefore, larger sample size is needed to reach enough power to replicate our findings.
Adenomas are well known precursor lesions of colorectal cancer. Accordingly, we investigated if the observed interactions for colorectal cancer are also seen in advanced colorectal adenomas. Our findings suggest that the interaction between rs10795668 and rs367615 is present in advanced adenomas, suggesting that the genetic variants may act early in the development of colorectal cancer. In contrast, the interaction between rs1571218 and rs10879357 was not observed in advanced adenoma, which may suggest that the genetic variants act at a later stage of cancer development. However, the findings need to be interpreted with caution, as the number of adenomas is relatively small (<1000 cases).
In marginal association analysis, the most commonly used model is the log-additive model, where the genotype is coded as 0, 1 or 2 (based on the number of count alleles). It is therefore natural to use the same genetic coding in a two-locus interaction model to test for GxG. In the interaction model, the interaction effect is modeled by the product of the genotypes of two SNPs. As we can see in Table 6(a), this interaction model assumes that the interaction when both SNPs have homozygous genotype ( = 2) is four times as large as when both SNPs have heterozygous genotype ( = 1). In other words, this model assumes  in the Table 6(b), which is a strong assumption. Indeed, we can see that the interaction pattern in Table 3(a) is not consistent with this assumption. Some simple calculations demonstrate that
 = log(0.89), which actually represents a smaller effect size compared to
  = log(0.76). In fact, we have found in simulation that violation of this assumption can result in substantial loss of power (Figure S1). A cautious way to avoid posing such a strong assumption is to use an unrestricted model, which is also a widely adopted method [17], [43]. Using an unrestricted model can avoid violation of assumptions but may result in substantial loss of power because of the increased degrees of freedom (from 1 to 4). Our ADRI method uses the same genetic coding as the log-additive model to allow allelic effects for main effects, which also makes the interaction test independent of the marginal screening. For the interaction, our method estimates the average interaction effect
  of
of  ,
,  ,
,  , and
, and  . Because
  is an average effect, it is less prone to heterogeneity among studies. As a result, our method is more stable and reproducible compared to the unrestricted and log-additive model. It is worth pointing out that when the underlying genetic model is indeed log-additive, ARDI is less powerful compared to the regular interaction model with log-additive genetic coding. For future applications, a model selection technique needs to be developed to determine the most appropriate model with the least loss of power. Another worth noting point is that the case-only model, which assumes independence between SNPs in controls, is known to be more powerful than the case control combined model while testing for gene-gene interaction [44], [45]. In our case, ARDI is a case control combined approach so the power can also be boosted by using its case-only counterpart. We did not implement the case-only ARDI for two reasons: it is relatively hard to completely avoid violation of the independence assumption (thus maintain the type I error rate) in case-only model due to the complexity of the LD structure of the human genome, i.e, long-range LD [46]; in addition, the current available package [47] for fitting a case-only model with covariates are only applicable to genotyped SNPs while our data include imputed dosages. As an on-going work, we are developing a package that can fit case-only model for two imputed SNPs while adjusting for covariates.
Table 6. An illustration of different two-SNP interaction models. SNP 1 has genotype AA, Aa and aa; SNP 2 has genotype BB, Bb, and bb. A and B are the major alleles for SNP1 and 2, respectively.
| (a) | |||
| AA | Aa | aa | |
| BB | 1 |

|

|
| Bb |

|

|

|
| bb |

|

|

|
| (b) | |||
| AA | Aa | aa | |
| BB | 1 |

|

|
| Bb |

|

|

|
| bb |

|

|

|
| (c) | |||
| AA | Aa | aa | |
| BB | 1 |

|

|
| Bb |

|

|

|
| bb |

|

|

|
Each entry in the tables represents the risk of the corresponding genotype combination relative to the baseline (AA/BB). (a) Multiplicative interaction model; (b) Unrestricted interaction model; (c) Average Risk Due to Interaction (ARDI) model.
GxG is usually defined as the departure from main effects [13]. Therefore, if the underlying main effects are not correctly specified, the residual main effects could be incorporated as part of the interaction effect in the statistical model [48]. As a result, testing interaction implicitly evaluates the residual main effect and interaction effect jointly. We keep the main effects as log-additive in ARDI, mainly because we want to be consistent with the usual log-additive model used in the marginal association analysis so that ARDI test is independent of the marginal screening. However, the log-additive main effect is prone to model misspecification. We observed this in our study for four of the known loci, rs10936599, rs6983267, rs4779584 and rs961253. These SNPs all showed an inflated  for the interaction tests when using additive genetic coding for the main effect. In all four cases, the inflation
  diminished after we switched to unrestricted coding with no misspecification. VanderWeele and Laird (2011) used a similar approach to protect against potential misspecification of main effects [49]. We tried ARDI with unrestricted main effect on our top findings. Under the ARDI model with unrestricted main effect, the interaction between known locus rs10795668 and rs367615 has an OR of 0.75 and combined p = 1.07×10⁻⁶ (original OR = 0.74 and combined p = 4.19×10⁻⁸); interaction between rs1571218 and rs10879357 has an OR of 0.83 and combined p = 3.90×10⁻⁴ (original OR = 0.80 and combined p = 2.51×10⁻⁶). As we can see, the OR’s stay largely the same and there are still strong signals of interaction. However, the p-values get larger in the new model, which could be due to random fluctuations between different models, or also could be a sign of main effect misspecification. Hence, our interaction test results should be interpreted with caution.
In our GxG search, we performed genome-wide interaction search for each known CRC locus and all other SNPs, including the SNPs that are in LD with it. This raises an important concern whether it is appropriate to test GxG between two SNPs that are in high LD. As an alternative, it is of interest to conduct haplotype analysis on the nearby regions of the known loci. We also prioritized SNPs based on their marginal association strength, using established methods [50]. Our reasoning is that if a SNP is involved in GxG, it is also likely that it will show evidence of some marginal effect. As most SNPs in GWAS are null, selecting a subset of SNPs that are more likely to show interaction could increase the power substantially as it reduces the overall multiple comparison burden. However, it is also possible for a SNP to show little or no marginal association if it is involved in interaction that is in the opposite direction to that seen with the main effect. In this case, we would not be able to find those qualitative interactions using our screening. Future research is needed to explore methods to complement the marginal association screening while still restricting the number of tests at a reasonable level to ensure reasonable power.
In this paper, we focused on pair-wise interactions. For higher order interactions, data mining methods such Random Forest [51], [52] and Multifactor Dimensionality Reduction [53] are preferred compared to the traditional regression-based methods because of the scarcity of the potential high-order contingency table [13]. As pointed out by Cordell [13], most of the high-order data mining methods, except for Random Forest, are computationally intensive, and hence, are not easily applicable to GWAS data. In addition, as the data mining methods are nonparametric, permutation tests are usually needed to produce p-value. Unfortunately they are generally computationally impossible for GWAS. Given the aforementioned limitations, one possible practical approach for searching for higher order GxG is to use Random Forest in a discovery dataset and use traditional regression-based methods to replicate the findings.
It is important to note that we focused on testing statistical interaction in this paper and statistical interaction does not always warrant a biologic or mechanistic interaction [54]. Mechanistic interaction can be tested using the sufficient cause framework [55], which is out of the scope of this paper.
In summary, our study is the first to comprehensively search for GxG for CRC. We have found evidence for two interactions associated with CRC risk. Further studies are needed to evaluate these interactions and to study the underlying molecular mechanisms.
Materials and Methods
Study Participants
The studies used in this analysis, including number of cases and controls, are listed in Table 1, with each study described in detail in the Text S1. In brief, colorectal cancer cases were defined as adenocarcinoma of colon and rectum (International Classification of Disease Code 153–154) and were confirmed by medical record, pathology report, or death certificate. Advanced colorectal adenoma cases are defined as adenoma ≥1 cm in diameter and/or with tubulovillous, villous, or high-grade dysplasia/carcinoma-in-situ histology, and were confirmed by medical record, histopathology, or pathology report. All participants provided written informed consent and studies were approved by the Institutional Review Board.
Genotyping
We conducted genome-wide scans for all studies. GECCO GWAS consisted of participants of European ancestry within 13 studies including the French Association Study Evaluating RISK for sporadic colorectal cancer (ASTERISK); Hawaii Colorectal Cancer Studies 2 and 3 (Colo2&3); Darmkrebs: Chancen der Verhutung durch Screening (DACHS); Diet, Activity, and Lifestyle Study (DALS); Health Professionals Follow-up Study (HPFS); Multiethnic Cohort (MEC); Nurses’ Health Study (NHS); Ontario Familial Colorectal Cancer Registry (OFCCR); Physician’s Health Study (PHS); Postmenopausal Hormone study (PMH); Prostate, Lung, Colorectal Cancer, and Ovarian Cancer Screening Trial (PLCO); VITamins And Lifestyle (VITAL); and the Women’s Health Initiative (WHI). Phase one genotyping on a total of 1,709 colon cancer cases and 4,214 controls from PLCO, WHI, and DALS (PLCO Set 1, WHI Set 1, and DALS Set 1) was done using Illumina Human Hap 550 K, 610 K, or combined Illumina 300 K and 240 K, and has been described previously [9]. A total of 650 colorectal cancer cases and 522 controls from OFCCR are included in GECCO from previous genotyping using Affymetrix platforms [2]. A total of 5,540 colorectal cancer cases and 5,425 controls from ASTERISK, Colo2&3, DACHS Set 1, DALS Set 2, MEC, PMH, PLCO Set 2, VITAL, and WHI Set 2 were successfully genotyped using Illumina HumanCytoSNP. A total of 1,837 colorectal cancer cases and 2,072 controls from HPFS, NHS, PHS, and DACHS set 2, as well as a total of 826 advanced adenoma cases and 923 controls from HPFS and NHS were successfully genotyped using Illumina HumanOmniExpress. A population-based case-control GWAS from CCFR (1,171 cases and 983 controls) was successfully genotyped using Illumina Human1M or Human1M-Duo [56].
We divided the studies into two phases according to the time their genotype data became available (Table 1). We used the Phase I studies (10 studies; 8,380 cases and 10,558 controls) as the discovery set and Phase II studies (6 studies; 2,527 cases and 2,628 controls) as the replication set. In addition, there are two advanced colorectal adenoma studies, which we use to evaluate whether the interactions found for carcinoma are also associated with advanced adenoma.
DNA was extracted from blood samples or, in the case of a subset of DACHS, MEC, and PLCO samples, and all VITAL samples, from buccal cells using conventional methods. All studies included 1 to 6% blinded duplicates to monitor quality of the genotyping. All individual-level genotype data were managed centrally at University of Southern California (CCFR), the Ontario Institute for Cancer Research (OFCCR), the University of Washington (HPFS, NHS, PHS, and the second GWAS of DACHS), or the GECCO Coordinating Center at the Fred Hutchinson Cancer Research Center (all other studies) to ensure a consistent quality assurance and quality control approach and statistical analysis. Samples were excluded based on call rate, heterozygosity, unexpected duplicates, gender discrepancy, and unexpectedly high identity-by-descent or unexpected concordance (>65%) with another individual. All analyses were restricted to samples clustering with the CEU population in principal component analysis, including the three HapMap populations as a reference. SNPs were excluded if they were triallelic, not assigned an rs number, or were reported as not performing consistently across platforms. Additionally, they were excluded based on call rate (<98%), Hardy Weinberg Equilibrium in controls (HWE, p<10−4), and minor allele frequency. To place studies on a common set of autosomal SNPs, all studies were imputed to HapMap II release 24, with the exception of OFCCR, which was imputed to HapMap II release 22. CCFR was imputed using IMPUTE [57], OFCCR was imputed using BEAGLE [58], and all other studies were imputed using MACH [59]. Given the high agreement of imputation accuracy among MACH, IMPUTE, and BEAGLE [60] the common practice to use different imputation programs is unlikely to cause heterogeneity [61]. Imputed data were merged with genotype data such that genotype data were preferentially selected if a SNP had both types of data, unless there was a difference in terms of reference allele frequency (>0.1) or position (>100 base pairs), in which case imputed data were used. As a measurement of imputation accuracy, we calculated R2 [59].
For the GxG analysis, we restricted the search to SNPs with MAF>0.05 and imputation R2>0.3 because there is inadequate power to detect interactions between less frequent variants or variants with lower imputation quality given the current sample size.
Statistical Method
GxG model
A logistic regression model was used to assess GxG for each SNP pair tested. In particular, we used a simple yet powerful approach named “Average Risk Due to Interaction (ARDI)” to test for GxG. In this approach, the main effects of the SNPs are log-additive and the interaction effect is the averaged deviation from the main effects. This is in contrast to the usual modeling of the interaction effect for log-additive model, where the interaction term is the product of the two SNPs. To see this, we consider two SNPs, G1 ( = AA, Aa or aa) and G2 ( = BB, Bb, or bb) while A and B are the major alleles for G1 and G2, respectively. Table 6(a) shows the usual interaction model with log-additive effects. Under this model, the interaction effect of aa/bb combination relative to the main effects is exp(4 ), which is considerably larger than the Aa/Bb combination, which is exp(
 ). One way to avoid this strong assumption of interaction pattern is to use an unrestricted model (Table 6(b)), which models the interaction effect by four parameters
  ,
,  ,
,  , and
, and  . A four-degrees-of-freedom test is needed to test for the interaction effect, which may result in a substantial power loss. We therefore modeled the average interaction effect with one parameter
  while keeping the main effect as log-additive (ARDI) (see Table 6(c)). This modeling avoids the strong assumption of the usual modeling of interactions with log-additive main effects, and yet gains power by having only one parameter to test for interaction. We keep the main effects as log-additive, mainly because we want to be consistent with the usual log-additive model used in the marginal association analysis. We have conducted extensive simulation studies to compare the performance of ARDI with multiplicative interaction model and unrestricted interaction model. Simulation results show that ARDI has favorable performance while the underlying interaction pattern is unknown (see Text S1, Table S1 and Figure S1). We have also tried both multiplicative model and ARDI in the Phase I studies and ARDI yielded more significant results genome widely, which supported the conclusion from the simulation because in this case the true underlying interaction is unknown and likely to vary among SNPs. Hence, we chose ARDI as our GxG model. Specifically, the ARDI model can be written as:
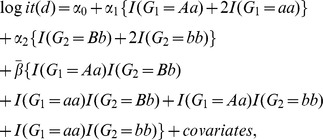 |
where d is the disease status (0/1),  is the intercept,
  and
and  are the main effects,
  is the ARDI interaction effect. The hypothesis is to test whether
  . For all models, we adjusted for age, sex, study center, and the first three principal components from EIGENSTRAT [62] to account for population substructure.
GxG searching strategy
We performed genome-wide interaction testing for each of the 14 known CRC susceptibility loci and all other 2.1 M SNPs in the Phase I studies. SNPs with p<10−6 in Phase I were examined in the Phase II studies using the same ARDI model.
We also conducted a genome-wide search of GxG for all SNPs, using a two-stage approach. In the first stage, we did a genome-wide marginal association test with additive genetic coding for all 2.1 M SNPs. Then we selected SNPs with marginal association p-value <0.0001 for the second stage and searched for pair-wise interactions among the selected SNPs. We selected 0.0001 as the cutoff so that around 100 independent regions would be selected assuming there are one million independent regions genome-wide [63]. It has been shown that the screening on marginal association is independent of the GxG test as long as the genetic coding for the main effect is the same as in the marginal association testing [50]. Because both the marginal association test and the main effect of ARDI use additive genetic coding, we need to adjust only for the number of interaction tests performed in the second stage to maintain the correct type I error level.
We observed 606 SNPs with marginal association p<0.0001. However, the 606 selected SNPs are not independent due to linkage disequilibrium (LD) between SNPs. As a result, if we used the number of pair-wise interactions among those 606 SNPs (n = 183,315) with a Bonferroni correction to compute the adjusted alpha level, the result would be too conservative. Therefore, we performed a pruning based on LD. First, the selected SNPs were ranked based on the marginal association p-value. Starting with the first SNP (SNP with the strongest signal), we removed all SNPs that have a LD r2>0.8 with that SNP. Then we moved to the next SNP, and repeated the procedure until we reached the end of the list. A total of 163 SNPs remained after this LD pruning. We then tested for GxG among these SNPs in Phase I studies. Interactions with p<5×10⁻⁵ were selected for Phase II (so the expected number of false positive based on total 163*162/2 = 13,203 interaction tests is less than one).
Meta-analysis
We used the fixed-effect meta-analysis to combine interaction estimates across studies. In this approach, we used the inverse-variance weighting to combine the regression coefficient estimates from each study. As previously demonstrated [64], the imputation quality is automatically incorporated into meta-analysis with the inverse-variance weighting. We report the summary estimate, standard error, and 95% confidence interval, as well as the heterogeneity p-value for the meta-analysis. For top findings we examined whether a random effects model would result in substantively different results from our fixed effects model. We also examined forest plots for top interaction findings. We present meta-analysis results for Phase I alone, Phase II alone, and Phase I and II combined.
Genomic Inflation
We checked the QQ plot and genomic inflation factor  for the GxG meta-analysis results of each known locus. Among 14 known loci, 10 of them showed no systematic bias, with
  ‘s less than 1.05. However, rs10936599, rs6983267, rs4779584 and rs961253 showed some indication of an inflated
  (1.10–1.78). For each of these SNPs we found that the systematic inflation was due to inappropriate additive genetic coding for the main effect. If the main effect for a SNP does not follow an additive model (with the heterozygote effect half way between the two homozygotes on the log scale), but additive coding is used, this misspecification results in a residual main effect. The residual effect impacts the testing for the interaction and causes the inflation (see Discussion for more details). For those four SNPs, we switched their main effect coding from an additive model to a 2 degree of freedom unrestricted coding and observed that the inflation factor for the interaction GxG meta-analysis results was diminished (
 ≤1.01).
Supporting Information
Simulation results comparing the performance of ARDI (red bars), multiplicative interaction model (black bars), and unrestricted interaction model (blue bars). For each model, the barplots show the power (type I error for Model 1) of each method under different parameter settings.
(DOCX)
ENCODE Integrated Regulation Tracks for 5q21.
(DOCX)
An illustration of six two-SNP interaction models used in the simulation. SNP 1 has genotype AA, Aa and aa; SNP 2 has genotype BB, Bb, and bb. A and B are the major alleles for SNP1 and 2, respectively. Each entry in the tables represents the risk of the corresponding genotype combination.
(DOCX)
Tools for functional annotation of non-coding variants.
(DOCX)
(DOCX)
Acknowledgments
We thank the reviewers for their helpful comments.
ASTERISK: We are very grateful to Dr. Bruno Buecher without whom this project would not have existed. We also thank all those who agreed to participate in this study, including the patients and the healthy control persons, as well as all the physicians, technicians and students.
DACHS: We thank all participants and cooperating clinicians, and Ute Handte-Daub, Renate Hettler-Jensen, Utz Benscheid, Muhabbet Celik and Ursula Eilber for excellent technical assistance.
GECCO: The authors would like to thank all those at the GECCO Coordinating Center for helping bring together the data and the people that made this project possible.
HPFS, NHS, PHS: We would like to acknowledge Patrice Soule and Hardeep Ranu of the Dana Farber Harvard Cancer Center High-Throughput Polymorphism Core who assisted in the genotyping for NHS, HPFS, and PHS under the supervision of Dr. Immaculata Devivo and Dr. David Hunter, Qin (Carolyn) Guo and Lixue Zhu who assisted in programming for NHS and HPFS, and Haiyan Zhang who assisted in programming for the PHS. We would like to thank the participants and staff of the Nurses’ Health Study and the Health Professionals Follow-Up Study, for their valuable contributions as well as the following state cancer registries for their help: AL, AZ, AR, CA, CO, CT, DE, FL, GA, ID, IL, IN, IA, KY, LA, ME, MD, MA, MI, NE, NH, NJ, NY, NC, ND, OH, OK, OR, PA, RI, SC, TN, TX, VA,WA, WY.
PLCO: The authors thank Drs. Christine Berg and Philip Prorok, Division of Cancer Prevention, National Cancer Institute, the Screening Center investigators and staff or the Prostate, Lung, Colorectal, and Ovarian (PLCO) Cancer Screening Trial, Mr. Tom Riley and staff, Information Management Services, Inc., Ms. Barbara O’Brien and staff, Westat, Inc., and Drs. Bill Kopp, Wen Shao, and staff, SAIC-Frederick. Most importantly, we acknowledge the study participants for their contributions to making this study possible.
PMH: The authors would like to thank the study participants and staff of the Hormones and Colon Cancer study.
WHI: The authors thank the WHI investigators and staff for their dedication, and the study participants for making the program possible. A full listing of WHI investigators can be found at: https://cleo.whi.org/researchers/Documents%20%20Write%20a%20Paper/WHI%20Investigator%20Short%20List.pdf.
Funding Statement
ASTERISK was funded by a Hospital Clinical Research Program (PHRC) and supported by the Regional Council of Pays de la Loire, the Groupement des Entreprises Françaises dans la Lutte contre le Cancer (GEFLUC), the Association Anne de Bretagne Génétique and the Ligue Régionale Contre le Cancer (LRCC). ARCTIC is partly supported by the National Cancer Institute, National Institutes of Health through funding allocated to the Ontario Registry for Studies of Familial Colorectal Cancer (U01 CA074783); see CCFR section below. ARCTIC is also supported by a GL2 grant from the Ontario Research Fund, the Canadian Institutes of Health Research, and the Cancer Risk Evaluation (CaRE) Program grant from the Canadian Cancer Society Research Institute. TJH and BWZ are recipients of Senior Investigator Awards from the Ontario Institute for Cancer Research, through generous support from the Ontario Ministry of Economic Development and Innovation. COLO2&3 is supported by the National Cancer Institute (R01 CA60987). CCFR is supported by the National Cancer Institute, National Institutes of Health under RFA # CA-95-011 and through cooperative agreements with members of the Colon Cancer Family Registry and P.I.s. This genome wide scan was supported by the National Cancer Institute, National Institutes of Health by U01 CA122839. The content of this manuscript does not necessarily reflect the views or policies of the National Cancer Institute or any of the collaborating centers in the CFRs, nor does mention of trade names, commercial products, or organizations imply endorsement by the U.S. Government or the CFR. The following Colon CFR centers contributed data to this manuscript and were supported by the following sources: Australasian Colorectal Cancer Family Registry (U01 CA097735), Seattle Colorectal Cancer Family Registry (U01 CA074794) and Ontario Registry for Studies of Familial Colorectal Cancer (U01 CA074783). DACHS was supported by grants from the German Research Council (Deutsche Forschungsgemeinschaft, BR 1704/6-1, BR 1704/6-3, BR 1704/6-4 and CH 117/1-1), and the German Federal Ministry of Education and Research (01KH0404 and 01ER0814). DALS was supported by the National Cancer Institute, National Institutes of Health, U.S. Department of Health and Human Services (R01 CA48998 to MLS). GECCO is supported by National Cancer Institute, National Institutes of Health, U.S. Department of Health and Human Services (U01 CA137088). Funding for the genome-wide scan of DALS, PLCO, and WHI was provided by the National Cancer Institute, National Institutes of Health, U.S. Department of Health and Human Services (R01 CA059045). HPFS, NHS, PHS: The National Institutes of Health supported HPFS (P01 CA 055075, R01 137178, P50 CA 127003), NHS (R01 137178, P50 CA 127003, P01 CA 087969), and PHS (CA42182). MEC is supported by R37 CA54281, P01 CA033619, and R01 CA63464. PLCO was supported by the Intramural Research Program of the Division of Cancer Epidemiology and Genetics and supported by contracts from the Division of Cancer Prevention, National Cancer Institute, NIH, DHHS. Control samples were genotyped as part of the Cancer Genetic Markers of Susceptibility (CGEMS) prostate cancer scan, supported by the Intramural Research Program of the National Cancer Institute. The datasets used in this analysis were accessed with appropriate approval through the dbGaP online resource (http://www.cgems.cancer.gov/data_acess.html) through dbGaP accession number 000207v.1p1.c1. (National Cancer Institute (2009) Cancer Genetic Markers of Susceptibility (CGEMS) data website, http://cgems.cancer.gov/data_access.html; Yeager et al. 2007). Control samples were also genotyped as part of the GWAS of Lung Cancer and Smoking (Landi et al. 2009). Funding for this work was provided through the National Institutes of Health, Genes, Environment and Health Initiative [NIH GEI] (Z01 CP 010200). The human subjects participating in the GWAS are derived from the Prostate, Lung, Colon and Ovarian Screening Trial and the study is supported by intramural resources of the National Cancer Institute. Assistance with genotype cleaning, as well as with general study coordination, was provided by the Gene Environment Association Studies, GENEVA Coordinating Center (U01 HG004446). Assistance with data cleaning was provided by the National Center for Biotechnology Information. Funding support for genotyping, which was performed at the Johns Hopkins University Center for Inherited Disease Research, was provided by the NIH GEI (U01 HG 004438). The datasets used for the analyses described in this manuscript were obtained from dbGaP at http://www.ncbi.nlm.nih.gov/gap through dbGaP accession number phs000093. PMH was supported by the National Institutes of Health (R01 CA076366 to PAN). VITAL was supported, in part, by the National Institutes of Health (K05 CA154337) from the National Cancer Institute and Office of Dietary Supplements. WHI: The WHI program is funded by the National Heart, Lung, and Blood Institute, National Institutes of Health, U.S. Department of Health and Human Services through contracts N01WH22110, 24152, 32100–2, 32105–6, 32108–9, 32111–13, 32115, 32118–32119, 32122, 42107–26, 42129–32, 44221, and 268200764316C. The funders had no role in study design, data collection and analysis, decision to publish, or preparation of the manuscript.
References
- 1. Tomlinson I, Webb E, Carvajal-Carmona L, Broderick P, Kemp Z, et al. (2007) A genome-wide association scan of tag SNPs identifies a susceptibility variant for colorectal cancer at 8q24.21. Nature genetics 39: 984–988 doi:10.1038/ng2085. [DOI] [PubMed] [Google Scholar]
- 2. Zanke BW, Greenwood CMT, Rangrej J, Kustra R, Tenesa A, et al. (2007) Genome-wide association scan identifies a colorectal cancer susceptibility locus on chromosome 8q24. Nature genetics 39: 989–994 doi:10.1038/ng2089. [DOI] [PubMed] [Google Scholar]
- 3. Broderick P, Carvajal-Carmona L, Pittman AM, Webb E, Howarth K, et al. (2007) A genome-wide association study shows that common alleles of SMAD7 influence colorectal cancer risk. Nature genetics 39: 1315–1317 doi:10.1038/ng.2007.18. [DOI] [PubMed] [Google Scholar]
- 4. Tenesa A, Farrington SM, Prendergast JGD, Porteous ME, Walker M, et al. (2008) Genome-wide association scan identifies a colorectal cancer susceptibility locus on 11q23 and replicates risk loci at 8q24 and 18q21. Nature genetics 40: 631–637 doi:10.1038/ng.133. [DOI] [PMC free article] [PubMed] [Google Scholar]
- 5. Jaeger E, Webb E, Howarth K, Carvajal-Carmona L, Rowan A, et al. (2008) Common genetic variants at the CRAC1 (HMPS) locus on chromosome 15q13.3 influence colorectal cancer risk. Nature genetics 40: 26–28 doi:10.1038/ng.2007.41. [DOI] [PubMed] [Google Scholar]
- 6. Tomlinson IPM, Webb E, Carvajal-Carmona L, Broderick P, Howarth K, et al. (2008) A genome-wide association study identifies colorectal cancer susceptibility loci on chromosomes 10p14 and 8q23.3. Nature genetics 40: 623–630 doi:10.1038/ng.111. [DOI] [PubMed] [Google Scholar]
- 7. Houlston RS, Webb E, Broderick P, Pittman AM, Di Bernardo MC, et al. (2008) Meta-analysis of genome-wide association data identifies four new susceptibility loci for colorectal cancer. Nature genetics 40: 1426–1435 doi:10.1038/ng.262. [DOI] [PMC free article] [PubMed] [Google Scholar]
- 8. Houlston RS, Cheadle J, Dobbins SE, Tenesa A, Jones AM, et al. (2010) Meta-analysis of three genome-wide association studies identifies susceptibility loci for colorectal cancer at 1q41, 3q26.2, 12q13.13 and 20q13.33. Nature genetics 42: 973–977 doi:10.1038/ng.670. [DOI] [PMC free article] [PubMed] [Google Scholar]
- 9.Peters U, Hutter CM, Hsu L, Schumacher FR, Conti DV, et al.. (2011) Meta-analysis of new genome-wide association studies of colorectal cancer risk. Human genetics. doi:10.1007/s00439–011–1055–0. [DOI] [PMC free article] [PubMed]
- 10. Tomlinson IPM, Carvajal-Carmona LG, Dobbins SE, Tenesa A, Jones AM, et al. (2011) Multiple Common Susceptibility Variants near BMP Pathway Loci GREM1, BMP4, and BMP2 Explain Part of the Missing Heritability of Colorectal Cancer. PLoS genetics 7: e1002105 doi:10.1371/journal.pgen.1002105. [DOI] [PMC free article] [PubMed] [Google Scholar]
- 11. Culverhouse R, Suarez BK, Lin J, Reich T (2002) A perspective on epistasis: limits of models displaying no main effect. American journal of human genetics 70: 461–471 doi:10.1086/338759. [DOI] [PMC free article] [PubMed] [Google Scholar]
- 12. Moore JH (2003) The ubiquitous nature of epistasis in determining susceptibility to common human diseases. Human heredity 56: 73–82 doi:10.1159/000073735. [DOI] [PubMed] [Google Scholar]
- 13. Cordell HJ (2009) Detecting gene-gene interactions that underlie human diseases. Nature reviews Genetics 10: 392–404 doi:10.1038/nrg2579. [DOI] [PMC free article] [PubMed] [Google Scholar]
- 14.Van Steen K (2011) Travelling the world of gene-gene interactions. Briefings in bioinformatics: bbr012–. doi:10.1093/bib/bbr012. [DOI] [PubMed]
- 15. Zuk O, Hechter E, Sunyaev SR, Lander ES (2012) The mystery of missing heritability: Genetic interactions create phantom heritability. Proceedings of the National Academy of Sciences of the United States of America 109: 1193–1198 doi:10.1073/pnas.1119675109. [DOI] [PMC free article] [PubMed] [Google Scholar]
- 16. Strange A, Capon F, Spencer CCA, Knight J, Weale ME, et al. (2010) A genome-wide association study identifies new psoriasis susceptibility loci and an interaction between HLA-C and ERAP1. Nature genetics 42: 985–990 doi:10.1038/ng.694. [DOI] [PMC free article] [PubMed] [Google Scholar]
- 17. Liu Y, Xu H, Chen S, Chen X, Zhang Z, et al. (2011) Genome-wide interaction-based association analysis identified multiple new susceptibility Loci for common diseases. PLoS genetics 7: e1001338 doi:10.1371/journal.pgen.1001338. [DOI] [PMC free article] [PubMed] [Google Scholar]
- 18.Hsiung CA, Lan Q, Hong Y-C, Chen C-J, Hosgood HD, et al.. (2010) The 5p15.33 locus is associated with risk of lung adenocarcinoma in never-smoking females in Asia. PLoS genetics 6. doi:10.1371/journal.pgen.1001051. [DOI] [PMC free article] [PubMed]
- 19. Landi MT, Chatterjee N, Yu K, Goldin LR, Goldstein AM, et al. (2009) A genome-wide association study of lung cancer identifies a region of chromosome 5p15 associated with risk for adenocarcinoma. American journal of human genetics 85: 679–691 doi:10.1016/j.ajhg.2009.09.012. [DOI] [PMC free article] [PubMed] [Google Scholar]
- 20. McKay JD, Hung RJ, Gaborieau V, Boffetta P, Chabrier A, et al. (2008) Lung cancer susceptibility locus at 5p15.33. Nature genetics 40: 1404–1406 doi:10.1038/ng.254. [DOI] [PMC free article] [PubMed] [Google Scholar]
- 21. Miki D, Kubo M, Takahashi A, Yoon K-A, Kim J, et al. (2010) Variation in TP63 is associated with lung adenocarcinoma susceptibility in Japanese and Korean populations. Nature genetics 42: 893–896 doi:10.1038/ng.667. [DOI] [PubMed] [Google Scholar]
- 22. Petersen GM, Amundadottir L, Fuchs CS, Kraft P, Stolzenberg-Solomon RZ, et al. (2010) A genome-wide association study identifies pancreatic cancer susceptibility loci on chromosomes 13q22.1, 1q32.1 and 5p15.33. Nature genetics 42: 224–228 doi:10.1038/ng.522. [DOI] [PMC free article] [PubMed] [Google Scholar]
- 23. Rafnar T, Sulem P, Stacey SN, Geller F, Gudmundsson J, et al. (2009) Sequence variants at the TERT-CLPTM1L locus associate with many cancer types. Nature genetics 41: 221–227 doi:10.1038/ng.296. [DOI] [PMC free article] [PubMed] [Google Scholar]
- 24. Shete S, Hosking FJ, Robertson LB, Dobbins SE, Sanson M, et al. (2009) Genome-wide association study identifies five susceptibility loci for glioma. Nature genetics 41: 899–904 doi:10.1038/ng.407. [DOI] [PMC free article] [PubMed] [Google Scholar]
- 25. Stacey SN, Sulem P, Masson G, Gudjonsson SA, Thorleifsson G, et al. (2009) New common variants affecting susceptibility to basal cell carcinoma. Nature genetics 41: 909–914 doi:10.1038/ng.412. [DOI] [PMC free article] [PubMed] [Google Scholar]
- 26. Turnbull C, Rapley EA, Seal S, Pernet D, Renwick A, et al. (2010) Variants near DMRT1, TERT and ATF7IP are associated with testicular germ cell cancer. Nature genetics 42: 604–607 doi:10.1038/ng.607. [DOI] [PMC free article] [PubMed] [Google Scholar]
- 27. Wang Y, Broderick P, Webb E, Wu X, Vijayakrishnan J, et al. (2008) Common 5p15.33 and 6p21.33 variants influence lung cancer risk. Nature genetics 40: 1407–1409 doi:10.1038/ng.273. [DOI] [PMC free article] [PubMed] [Google Scholar]
- 28. Gangloff YG, Pointud JC, Thuault S, Carré L, Romier C, et al. (2001) The TFIID components human TAF(II)140 and Drosophila BIP2 (TAF(II)155) are novel metazoan homologues of yeast TAF(II)47 containing a histone fold and a PHD finger. Molecular and cellular biology 21: 5109–5121 doi:10.1128/MCB.21.15.5109–5121.2001. [DOI] [PMC free article] [PubMed] [Google Scholar]
- 29. Loo LWM, Cheng I, Tiirikainen M, Lum-Jones A, Seifried A, et al. (2012) cis-Expression QTL Analysis of Established Colorectal Cancer Risk Variants in Colon Tumors and Adjacent Normal Tissue. PloS one 7: e30477 doi:10.1371/journal.pone.0030477. [DOI] [PMC free article] [PubMed] [Google Scholar]
- 30. Nishisho I, Nakamura Y, Miyoshi Y, Miki Y, Ando H, et al. (1991) Mutations of chromosome 5q21 genes in FAP and colorectal cancer patients. Science (New York, NY) 253: 665–669. [DOI] [PubMed] [Google Scholar]
- 31. Kinzler KW, Nilbert MC, Vogelstein B, Bryan TM, Levy DB, et al. (1991) Identification of a gene located at chromosome 5q21 that is mutated in colorectal cancers. Science (New York, NY) 251: 1366–1370. [DOI] [PubMed] [Google Scholar]
- 32. Lignitto L, Carlucci A, Sepe M, Stefan E, Cuomo O, et al. (2011) Control of PKA stability and signalling by the RING ligase praja2. Nature cell biology 13: 412–422 doi:10.1038/ncb2209. [DOI] [PubMed] [Google Scholar]
- 33. Yu P, Chen Y, Tagle DA, Cai T (2002) PJA1, encoding a RING-H2 finger ubiquitin ligase, is a novel human X chromosome gene abundantly expressed in brain. Genomics 79: 869–874 doi:10.1006/geno.2002.6770. [DOI] [PubMed] [Google Scholar]
- 34. Misago M, Liao YF, Kudo S, Eto S, Mattei MG, et al. (1995) Molecular cloning and expression of cDNAs encoding human alpha-mannosidase II and a previously unrecognized alpha-mannosidase IIx isozyme. Proceedings of the National Academy of Sciences of the United States of America 92: 11766–11770. [DOI] [PMC free article] [PubMed] [Google Scholar]
- 35. Massagué J (2000) How cells read TGF-beta signals. Nature reviews Molecular cell biology 1: 169–178 doi:10.1038/35043051. [DOI] [PubMed] [Google Scholar]
- 36. Slattery ML, Lundgreen A, Herrick JS, Caan BJ, Potter JD, et al. (2011) Associations between genetic variation in RUNX1, RUNX2, RUNX3, MAPK1 and eIF4E and riskof colon and rectal cancer: additional support for a TGF-β-signaling pathway. Carcinogenesis 32: 318–326 doi:10.1093/carcin/bgq245. [DOI] [PMC free article] [PubMed] [Google Scholar]
- 37. Walther DJ, Peter J-U, Bashammakh S, Hörtnagl H, Voits M, et al. (2003) Synthesis of serotonin by a second tryptophan hydroxylase isoform. Science (New York, NY) 299: 76 doi:10.1126/science.1078197. [DOI] [PubMed] [Google Scholar]
- 38. Cattaneo MG, Codignola A, Vicentini LM, Clementi F, Sher E (1993) Nicotine stimulates a serotonergic autocrine loop in human small-cell lung carcinoma. Cancer research 53: 5566–5568. [PubMed] [Google Scholar]
- 39. Hambek M, Werner C, Baghi M, Gstöttner W, Knecht R (n.d.) Prestimulation of head and neck cancer cells with growth factors enhances treatment efficacy. Anticancer research 26: 1091–1095. [PubMed] [Google Scholar]
- 40. Siddiqui EJ, Shabbir MA, Mikhailidis DP, Mumtaz FH, Thompson CS (2006) The effect of serotonin and serotonin antagonists on bladder cancer cell proliferation. BJU international 97: 634–639 doi:10.1111/j.1464–410X.2006.06056.x. [DOI] [PubMed] [Google Scholar]
- 41. Nocito A, Dahm F, Jochum W, Jang JH, Georgiev P, et al. (2008) Serotonin regulates macrophage-mediated angiogenesis in a mouse model of colon cancer allografts. Cancer research 68: 5152–5158 doi:10.1158/0008–5472.CAN-08–0202. [DOI] [PubMed] [Google Scholar]
- 42. Skol AD, Scott LJ, Abecasis GR, Boehnke M (2006) Joint analysis is more efficient than replication-based analysis for two-stage genome-wide association studies. Nature genetics 38: 209–213 doi:10.1038/ng1706. [DOI] [PubMed] [Google Scholar]
- 43.Tao S, Feng J, Webster T, Jin G, Hsu F-C, et al.. (2012) Genome-wide two-locus epistasis scans in prostate cancer using two European populations. Human genetics. doi:10.1007/s00439–012–1148–4. [DOI] [PMC free article] [PubMed]
- 44. Piegorsch WW, Weinberg CR, Taylor JA (1994) Non-hierarchical logistic models and case-only designs for assessing susceptibility in population-based case-control studies. Statistics in medicine 13: 153–162. [DOI] [PubMed] [Google Scholar]
- 45. Yang Q, Khoury MJ, Sun F, Flanders WD (1999) Case-only design to measure gene-gene interaction. Epidemiology (Cambridge, Mass) 10: 167–170. [PubMed] [Google Scholar]
- 46. Reich DE, Cargill M, Bolk S, Ireland J, Sabeti PC, et al. (2001) Linkage disequilibrium in the human genome. Nature 411: 199–204 doi:10.1038/35075590. [DOI] [PubMed] [Google Scholar]
- 47.Bhattacharjee S, Chatterjee N, Wheeler W (2010) CGEN: An R package for analysis of case-control studies in genetic epidemiology.
- 48. Prentice RL (2011) Empirical evaluation of gene and environment interactions: methods and potential. Journal of the National Cancer Institute 103: 1209–1210 doi:10.1093/jnci/djr279. [DOI] [PMC free article] [PubMed] [Google Scholar]
- 49. VanderWeele TJ, Laird NM (2011) Tests for compositional epistasis under single interaction-parameter models. Annals of human genetics 75: 146–156 doi:10.1111/j.1469–1809.2010.00600.x. [DOI] [PMC free article] [PubMed] [Google Scholar]
- 50. Kooperberg C, Leblanc M (2008) Increasing the power of identifying gene×gene interactions in genome-wide association studies. Genetic epidemiology 32: 255–263 doi:10.1002/gepi.20300. [DOI] [PMC free article] [PubMed] [Google Scholar]
- 51. Bureau A, Dupuis J, Falls K, Lunetta KL, Hayward B, et al. (2005) Identifying SNPs predictive of phenotype using random forests. Genetic epidemiology 28: 171–182 doi:10.1002/gepi.20041. [DOI] [PubMed] [Google Scholar]
- 52. Lunetta KL, Hayward LB, Segal J, Van Eerdewegh P (2004) Screening large-scale association study data: exploiting interactions using random forests. BMC genetics 5: 32 doi:10.1186/1471-2156-5-32. [DOI] [PMC free article] [PubMed] [Google Scholar]
- 53. Ritchie MD, Hahn LW, Roodi N, Bailey LR, Dupont WD, et al. (2001) Multifactor-dimensionality reduction reveals high-order interactions among estrogen-metabolism genes in sporadic breast cancer. American journal of human genetics 69: 138–147 doi:10.1086/321276. [DOI] [PMC free article] [PubMed] [Google Scholar]
- 54. VanderWeele TJ, Hernández-Díaz S, Hernán MA (2010) Case-only gene-environment interaction studies: when does association imply mechanistic interaction? Genetic epidemiology 34: 327–334 doi:10.1002/gepi.20484. [DOI] [PMC free article] [PubMed] [Google Scholar]
- 55. VanderWeele TJ (2009) Sufficient cause interactions and statistical interactions. Epidemiology (Cambridge, Mass) 20: 6–13 doi:10.1097/EDE.0b013e31818f69e7. [DOI] [PubMed] [Google Scholar]
- 56. Figueiredo JC, Lewinger JP, Song C, Campbell PT, Conti DV, et al. (2011) Genotype-environment interactions in microsatellite stable/microsatellite instability-low colorectal cancer: results from a genome-wide association study. Cancer epidemiology, biomarkers & prevention?: a publication of the American Association for Cancer Research, cosponsored by the American Society of Preventive Oncology 20: 758–766 doi:10.1158/1055–9965.EPI-10–0675. [DOI] [PMC free article] [PubMed] [Google Scholar]
- 57. Marchini J, Howie B, Myers S, McVean G, Donnelly P (2007) A new multipoint method for genome-wide association studies by imputation of genotypes. Nature genetics 39: 906–913 doi:10.1038/ng2088. [DOI] [PubMed] [Google Scholar]
- 58. Browning BL, Browning SR (2009) A unified approach to genotype imputation and haplotype-phase inference for large data sets of trios and unrelated individuals. American journal of human genetics 84: 210–223 doi:10.1016/j.ajhg.2009.01.005. [DOI] [PMC free article] [PubMed] [Google Scholar]
- 59. Li Y, Willer CJ, Ding J, Scheet P, Abecasis GR (2010) MaCH: using sequence and genotype data to estimate haplotypes and unobserved genotypes. Genetic epidemiology 34: 816–834 doi:10.1002/gepi.20533. [DOI] [PMC free article] [PubMed] [Google Scholar]
- 60. Nothnagel M, Ellinghaus D, Schreiber S, Krawczak M, Franke A (2009) A comprehensive evaluation of SNP genotype imputation. Human genetics 125: 163–171 doi:10.1007/s00439–008–0606–5. [DOI] [PubMed] [Google Scholar]
- 61. Gögele M, Minelli C, Thakkinstian A, Yurkiewich A, Pattaro C, et al. (2012) Methods for meta-analyses of genome-wide association studies: critical assessment of empirical evidence. American journal of epidemiology 175: 739–749 doi:10.1093/aje/kwr385. [DOI] [PubMed] [Google Scholar]
- 62. Price AL, Patterson NJ, Plenge RM, Weinblatt ME, Shadick NA, et al. (2006) Principal components analysis corrects for stratification in genome-wide association studies. Nature genetics 38: 904–909 doi:10.1038/ng1847. [DOI] [PubMed] [Google Scholar]
- 63. Hsu L, Jiao S, Dai JY, Hutter C, Peters U, et al. (2012) Powerful Cocktail Methods for Detecting Genome-Wide Gene-Environment Interaction. Genetic Epidemiology 36: 183–194 doi:10.1002/gepi.21610. [DOI] [PMC free article] [PubMed] [Google Scholar]
- 64. Jiao S, Hsu L, Hutter CM, Peters U (2011) The use of imputed values in the meta-analysis of genome-wide association studies. Genetic epidemiology 35: 597–605 doi:10.1002/gepi.20608. [DOI] [PMC free article] [PubMed] [Google Scholar]
Associated Data
This section collects any data citations, data availability statements, or supplementary materials included in this article.
Supplementary Materials
Simulation results comparing the performance of ARDI (red bars), multiplicative interaction model (black bars), and unrestricted interaction model (blue bars). For each model, the barplots show the power (type I error for Model 1) of each method under different parameter settings.
(DOCX)
ENCODE Integrated Regulation Tracks for 5q21.
(DOCX)
An illustration of six two-SNP interaction models used in the simulation. SNP 1 has genotype AA, Aa and aa; SNP 2 has genotype BB, Bb, and bb. A and B are the major alleles for SNP1 and 2, respectively. Each entry in the tables represents the risk of the corresponding genotype combination.
(DOCX)
Tools for functional annotation of non-coding variants.
(DOCX)
(DOCX)