

Abstract
Objective
The directional and temporal nature of relationships between overweight and obesity and hysterectomy with or without oophorectomy is not well understood. Overweight and obesity may be both a risk factor for the indications for these surgeries and a possible consequence of the procedure. We used prospective data to examine whether body mass index (BMI) increased more following hysterectomy with and without bilateral oophorectomy compared to natural menopause among middle-aged women.
Methods
BMI was assessed annually for up to 10 years in the Study of Women’s Health Across the Nation (SWAN (n=1962). Piecewise linear mixed growth models were used to examine changes in BMI before and after natural menopause, hysterectomy with ovarian conservation, and hysterectomy with bilateral oophorectomy. Covariates included education, race/ethnicity, menopausal status, physical activity, self-rated health, hormone therapy use, antidepressant use, and age the visit prior to the final menstrual period (FMP; for natural menopause) or surgery (for hysterectomy/oophorectomy).
Results
By visit 10, 1780 (90.6%) women reached natural menopause, 106 (5.5%) reported hysterectomy with bilateral oophorectomy, and 76 (3.9%) reported hysterectomy with ovarian conservation. In fully adjusted models, BMI increased for all women from baseline to FMP or surgery (annual rate of change=.19 kg/m2 per year), with no significant differences in BMI change between groups. BMI also increased for all women following FMP, but increased more rapidly in women following hysterectomy with bilateral oophorectomy (annual rate of change=.21 kg/m2 per year) as compared to following natural menopause (annual rate of change=.08 kg/m2 per year, p=.03).
Conclusion
In this prospective examination, hysterectomy with bilateral oophorectomy was associated with greater increases in BMI in the years following surgery than following hysterectomy with ovarian conservation or natural menopause. This suggests that accelerated weight gain follows bilateral oophorectomy among women in midlife, which may increase risk for obesity-related chronic diseases.
Keywords: menopause, oophorectomy, BMI, women’s health
Introduction
Hysterectomy is the second most common surgical procedure among women in the United States, with 600,000 performed each year. (1) Bilateral oophorectomy is done concomitantly with hysterectomy in 55–80% of cases. (2) Over 95% of all hysterectomies are elective, used to treat benign conditions, such as uterine fibroids and endometriosis,(1) and symptoms such as dysfunctional menstrual bleeding.(3). While hysterectomy is effective at treating these conditions and symptoms, the potential for surgical complications and sequelae such as dyspareunia and genitourinary symptoms (4) has led to concerns about its potential overuse.
Weight gain and increased risk for overweight and obesity, along with the impaired physical, social, and emotional functioning associated with these conditions, may also be a consequence of hysterectomy and/or oophorectomy.(5) Cross-sectional research supports an association between obesity and hysterectomy, although whether obesity is cause or consequence of the procedure is unclear. Obesity is typically thought to precede surgery, as adiposity increases risk of many of the disorders and symptoms leading to hysterectomy.(6)) However, weight gain is a common complaint of women following hysterectomy, (7) possibly resulting from reduced physical functioning associated with hysterectomy, (8) post-surgical inactivity, abdominal and adipose tissue disruption due to surgery, (6), and/or to the abrupt changes in estrogen and androgen production resulting from oophorectomy that may increase risk for weight gain. (Parker, 2010) As most research on this issue is cross-sectional and retrospective, there is limited evidence that have tested these relations in a prospective context.
It remains unclear whether increases in body mass index (BMI) are observed prior to and/or after hysterectomy and/or oophorectomy, and whether any changes in BMI differ than those observed with the natural menopause. Prospective evaluations of BMI changes in the years prior to and following hysterectomy with and without oophorectomy, compared to naturally menopausal women, are needed to increase our understanding of the nature of the relations between these common surgeries and obesity. In this study, we sought to estimate the course of BMI among women in midlife before and after natural menopause, hysterectomy with ovarian conservation, and hysterectomy with bilateral oophorectomy.
Materials and Methods
Participants
Participants were from the Study of Women’s Health Across the Nation (SWAN), a community-based prospective study of women from sites across the United States designed to examine the physical and psychological health of women as they undergo the menopausal transition. Details of the SWAN design and recruitment procedures have been reported elsewhere.(9)
At baseline, all SWAN participants had an intact uterus and at least one ovary, were aged 42–52 years, were not pregnant, were not using reproductive hormones, and had 1 or more menstrual cycles in the 3 months prior to the interview. Each site recruited non-Hispanic Caucasian women as well as women belonging to a predetermined racial/ethnic minority group: African American women in Pittsburgh, Pennsylvania; Boston, Massachusetts; Detroit, Michigan; and Chicago, Illinois; Japanese women in Los Angeles, California; Hispanic women in Newark, New Jersey; and Chinese women in the Oakland area of California. Participants were recruited using established sampling techniques, random digit dialing, and random sampling from lists of names or household addresses. Select sites supplemented primary sampling frames to obtain adequate numbers of racial/ethnic minority women. Seventy-three percent of the women selected were contacted and provided information to determine eligibility; 51% (n = 3,302) of eligible women enrolled. Participants returned to their local site facility annually for interviewer- and self-administered questionnaires, a fasting blood draw, and reassessments of physical measures. Data collection for this analysis spanned from 1996–2008. SWAN was approved by the institutional review boards at each site, and each participant provided written, informed consent.
Analytic sample
A total of 1962 women, including 1780 women who reached natural menopause, 76 women who had a hysterectomy with ovarian conservation, and 106 women who had a hysterectomy with bilateral oophorectomy comprised the analytic sample. The New Jersey site did not complete in person clinic visits after the 6th annual follow-up, and resumed clinic visits at follow-up 12. Because this resulted in an average length of follow-up for this site that is systematically shorter than that of any other site, data from this site were excluded from the current analysis (n=131). Due to potential effects of treatment and associated changes not comparable to elective hysterectomy, those who reported hysterectomy in the presence of known or suspected endometrial, uterine, or ovarian cancer (n=21) were also excluded. Additionally, data from women who did not report hysterectomy or reach natural menopause (n=1,097) during their participation in SWAN, those who had a hysterectomy after having been categorized naturally postmenopausal (n=32), and those who did not have data regarding BMI from at least one annual visit post-final menstrual period (FMP)/surgery (n=59) were excluded from analysis, Women included in this analytic sample were older (mean 46.3, SD 2.6 vs. mean 45.2, SD 2.7, p<.001), more educated (46.5% v. 37.3% college or post-college, p<.001), reported better self-rated health (61.3% v. 52.6% excellent/very good health, p<.001), and had a lower mean BMI (28.0, SD 7.3, v. 28.8, SD 7.1, p<.01) at baseline than those who were excluded.
Design and procedures
Primary variables
Hysterectomy status
Menopausal status and the occurrence of hysterectomy and/or oophorectomy were assessed annually in SWAN. Women were categorized as naturally postmenopausal if they reported a complete absence of menstrual bleeding in the previous 12 months. Participants were asked annually if they had a “hysterectomy (an operation to remove your uterus or womb)” and whether they had one or both ovaries removed since the last study visit. Participants were categorized as having had a hysterectomy with ovarian conservation if they reported having had a hysterectomy without oophorectomy or with one ovary removed before becoming naturally postmenopausal. Participants were categorized as having had a hysterectomy with bilateral oophorectomy if they reported having a hysterectomy and both ovaries removed, or both ovaries removed without hysterectomy, before becoming naturally postmenopausal.
Body mass index
BMI was calculated at each annual visit using weight (kg) and height (m)2, and treated as a continuous variable for this analysis.
Covariates
All covariates were selected on the basis of previously documented associations with obesity, and included race/ethnicity, educational attainment, menopausal status the year prior to FMP or surgery, and age the year prior to FMP (FMP) or surgery, as well as annual measurements of physical activity, smoking status, self-rated health, hormone therapy use, antidepressant use, and waist circumference. Race/ethnicity and educational level were self-reported in the screening interview. FMP date was based on participant self-report; if FMP date was unknown, it was set as 12 months prior to the date of the annual visit participants were first categorized postmenopausal. Menopausal status was assessed annually in SWAN, and drawn from the annual visit prior to each participant’s FMP/surgery date. Menopausal status was defined as premenopausal(bleeding in the last 3 months with no cycle irregularity in the previous 12 months), early perimenopausal (bleeding in the last 3 months with some change in cycle regularity in the last 12 months), late perimenopausal (bleeding >3 months ago but within the last 12 months), and unknown (hormone therapy or other circumstance interfering with ability to categorize menopausal status), and collapsed for this analysis into four categories: premenopausal (premenopausal and early perimenopausal), perimenopausal (late perimenopausal), unknown (hormone therapy or other circumstance interfering with ability to categorize menopausal status), and missing (no menopausal status available for participant, generally due to nonattendance in the previous year’s annual visit). Age was calculated from the participant’s date of birth and date of FMP or surgery. Physical activity was assessed with the Kaiser Physical Activity Survey,(10) an adaptation of the Baecke physical activity questionnaire,(11) at baseline and annual follow-up visits 3, 5, and 6. A sum score was derived from responses to questions about physical activity during sports/exercise, household/care giving tasks, and daily routine in the previous year. Current smoking status was self-reported at each annual visit. Self-rated health was assessed at each annual visit by response to the following question: “In general, would you say your health is excellent, very good, good, fair or poor?”.(12) Responses were categorized into two categories: 1) “excellent” and “very good” c and 2) “good”, “fair”, or “poor”. Antidepressant and hormone therapy use were self-reported at each annual visit. Waist circumference in centimeters was measured by trained staff at each annual visit with a measuring tape placed around the participant at the narrowest part of the torso.
Statistical analyses
Baseline characteristics of women with natural menopause, women with hysterectomy with ovarian conservation, and women with hysterectomy with bilateral oophorectomy were compared using chi-square and for categorical variables, and ANOVA for continuous variables using SPSS v.17. (SPSS for Windows, Rel 17.0.0, 2008.) Site, race/ethnicity, age at FMP/surgery, educational attainment, and menopausal status the year prior to FMP/surgery were included as covariates in final models based on a priori decisions due to associations with BMI in the current literature. Preliminary analyses were conducted to assess independent associations between annual observations of antidepressant use, hormone therapy use, self-rated health, smoking status, and physical activity with BMI using hierarchical linear regression. These time-varying covariates were retained in final models if they were associated with BMI in otherwise unadjusted models at p<.05.
Piecewise hierarchical linear growth models were used to estimate the mean rate of change in BMI leading up to and following FMP or surgery, with annual observations nested within women.(HLM for Windows, version 6.08, 2010) Hierarchical linear modeling was used due to its utility in accounting for the dependence of repeated, correlated observations within individuals. Piecewise hierarchical linear growth models were used to allow for the possibility of different mean growth trajectories before and after FMP or surgery.(13) Estimates of the mean rate of change in BMI were modeled with two time variables, one using data from baseline to the index visit, and one using data from the index visit to the end of observations. An interaction between hysterectomy status (hysterectomy with ovarian conservation or hysterectomy with bilateral oophorectomy, with natural menopause set as the referent) and each time variable was assesed. The intercept was set as the first annual visit following FMP or surgery (index visit), and modeled as a function of hysterectomy status, site, race/ethnicity, educational attainment, age at FMP or surgery, menopausal status at the visit prior to FMP or surgery, and elapsed time between FMP or surgery and index visit. The final model also included time-varying covariates antidepressant use, hormone therapy use, smoking status, self-rated health, and physical activity. All predictors and covariates were entered simultaneously in the final multivariate models. For all analyses, p values less than 0.05 (two-tailed) were considered statistically significant.
Though BMI and waist circumference are both commonly used indicators of obesity, waist circumference has been shown to be independently related to adverse health outcomes even when adjusting for BMI, and in some cases is a stronger indicator of health outcomes than BMI (14). Secondary analyses were conducted to examine whether waist circumference increased more following hysterectomy with or without bilateral oophorectomy relative to natural menopause. Models were otherwise identical to those described above.
Racial differences in the prevalence and age at hysterectomy are known (1), though racial differences in the impact of hysterectomy and/or oophorectomy have not been well-studied. In order to assess potential interactions between hysterectomy status and race/ethnicity, a secondary analysis was performed in a sample restricted to only African American and Caucasian women to determine whether potential increases in BMI and waist circumference following hysterectomy with or without oophorectomy were greater among African Americans compared to Caucasian women. Other groups represented in SWAN were not included due to their very low numbers of hysterectomy with or without bilateral oophorectomy. The restricted sample included 1,422 women who reached natural menopause, 71 women who had a hysterectomy with ovarian conservation, and 88 women who had a hysterectomy with bilateral oophorectomy. Models were otherwise identical to those described above.
Results
Characteristics of sample
Participants were followed for up to 10 years after baseline, with observations from up to 9 years before and after FMP or surgery. Characteristics of the sample can be found in table 1. The sample represents the ethnic diversity of SWAN.
Table 1.
Demographic characteristics of SWAN participants at study baseline
| Total (n=1962) | Natural Menopause (n=1780,%) n, col % | Hysterectomy with ovarian conservation (n=76, %) n, col % | Hysterectomy with bilateral oophorectomy (n=106%) n, col % | p-values | |
|---|---|---|---|---|---|
| Race/ethnicity | <.001 | ||||
| Caucasian | 954 (48.6) | 878 (49.3) | 32 (42.1) | 44 (41.5) | |
| African American | 617 (31.4) | 531 (29.8) | 39 (51.3) | 47 (44.3) | |
| Chinese | 180 (9.2) | 172 (9.7) | 0 (0) | 8 (7.5) | |
| Japanese | 211 (10.8) | 199 (11.2) | 5 (6.6) | 7 (6.6) | |
| Prior menopausal status | <.001 | ||||
| Premenopausal | 414 (21.1) | 322 (18.1) | 44 (57.9) | 48 (45.3) | |
| Perimenopausal | 846 (43.1) | 839 (47.1) | 2 (2.6) | 5 (4.7) | |
| Unknown | 311 (15.9) | 285 (16.0) | 9 (11.8) | 17 (16.0) | |
| Missing | 391 (19.9) | 334 (18.8) | 21 (27.6) | 36 (34.0) | |
| Education | .25 | ||||
| ≤ High school | 403 (20.7) | 366 (20.7) | 13 (17.1) | 24 (22.6) | |
| Some college | 635 (32.5) | 567 (32.1) | 25 (32.9) | 43 (40.6) | |
| ≥ College | 913 (46.8) | 836 (47.3) | 38 (50.0) | 39 (36.8) | |
| Self-Rated Health | .16 | ||||
| Excellent or very good | 428 (22.0) | 380 (21.5) | 23 (30.7) | 25 (23.8) | |
| Good/fair/poor | 1518 (78.0) | 1386 (78.5) | 52 (69.3) | 80 (76.2) | |
| Antidepressant use | .68 | ||||
| Yes | 171 (8.7) | 152 (8.6) | 8 (10.7) | 11 (10.4) | |
| No | 1787 (91.3) | 1625 (91.4) | 67 (89.3) | 95 (89.6) | |
| Smoking status | .43 | ||||
| Yes | 315 (16.2) | 287 (16.2) | 15 (19.7) | 13 (12.6) | |
| No | 1633 (83.8) | 1482 (83.8) | 61 (80.3) | 90 (87.4) | |
| mean (SD) | mean (SD) | mean (SD) | |||
| Age | 46.31 (2.62) | 46.41 (2.60) | 44.92 (2.57) | 45.66 (2.62) | <.001 |
| Age at FMP/surgery | 51.43 (2.73) | 51.71 (2.54) | 47.96 (2.83) | 49.25 (3.05) | <.001 |
| Body mass index | 27.94 (7.33) | 27.75 (7.29) | 30.11 (7.95) | 29.47 (7.32) | <.01 |
| Physical activity score | 7.74 (1.77) | 7.75 (1.77) | 7.76 (1.97) | 7.58 (1.65) | .66 |
Women who reported hysterectomy with or without ovarian conservation during the observed period differed significantly at baseline from women who reached natural menopause and did not have a hysterectomy over the observed period (table 1). Naturally postmenopausal women were less likely to be African American, were less likely to have used hormone therapy over the observed period, were more likely to be older, and had lower BMIs at baseline as compared to women who subsequently reported hysterectomy with or without oophorectomy.
Body mass index before and after final menstrual period/surgery
BMI increased before and after the FMP or surgery for all participants (Table 2). There were no significant differences in the rate of change in BMI prior to the FMP or surgery by hysterectomy or oophorectomy status. However, the mean rate of change in BMI was significantly higher in participants following hysterectomy with oophorectomy than in participants following hysterectomy with ovarian conservation or natural menopause (Figure 1). Several covariates also showed significant associations with BMI. At the index visit, BMI was higher among African American women and participants with lower educational attainment. Annually, BMI was lower among smokers and women reporting more physical activity (data not shown).
Table 2.
Mean change in body mass index before and after natural menopause, hysterectomy with ovarian conservation, and hysterectomy with bilateral oophorectomy.
| Coefficient (SE) | p | |
|---|---|---|
| Natural menopause (referent) | ||
| Mean BMI at index visit | 28.85 (.60) | <.001 |
| Mean annual rate of change in BMI from baseline to final menstrual period | .19 (.01) | <.001 |
| Mean annual rate of change in BMI from final menstrual period or surgery to end of observations | .08 (.02) | <.001 |
| Hysterectomy with ovarian conservation | ||
| Mean BMI at index visit | 30.96 (.91) | .02 |
| Mean annual rate of change in BMI from baseline to surgery | .30 (.08) | .20 |
| Mean annual rate of change in BMI from surgery to end of observations | .13 (.08) | .51 |
| Hysterectomy with bilateral oophorectomy | ||
| Mean BMI at index visit | 29.81 (.74) | .09 |
| Mean annual rate of change in BMI from baseline to surgery | .24 (.07) | .46 |
| Mean annual rate of change in BMI from surgery to end of observations | .21 (.06) | .03 |
Models adjusted by site, race/ethnicity, educational attainment, age at FMP or surgery, menopausal status at visit prior to FMP or surgery, elapsed time between index visit and FMP or surgery (time-invariant), and physical activity, antidepressant use, hormone therapy use, and smoking status (time-varying). All covariates entered simultaneously.
P-values for natural menopause (referent) refer to significant difference from a value of 0; p-values for hysterectomy with ovarian conservation and hysterectomy with bilateral oophorectomy refer to significant difference from values for natural menopause.
Figure 1.
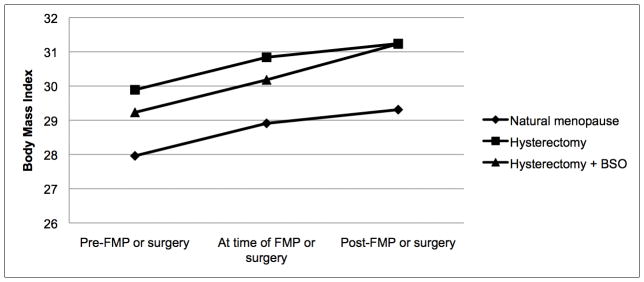
Mean change in body mass index before and after final menstrual period or surgery.
Secondary analyses
We also considered waist circumference as an outcome. In these models, waist circumference increased for all women both before (B=.65, p<.001) and after final (B=.47, p<.001) menstrual period or surgery, without variation by surgical status (data not shown; covariates: site, race/ethnicity, education, age at FMP or surgery, menopausal status prior to FMP or surgery, elapsed time between FMP or surgery and the index visit, and annually measured hormone therapy use, antidepressant use, smoking status, and physical activity). These findings indicate that while weight gain may be influenced by bilateral oophorectomy, fat distribution does not appear to be affected by the procedure among these women in midlife.
In the subsample of only African American and Caucasian women (n=1422), the results were similar to the overall sample results. However, the greater mean annual increase in BMI following hysterectomy with bilateral oophorectomy was reduced to a trend in final adjusted models (B=.13, p=.07). While African American women had higher absolute BMIs relative to Caucasian women (at index visit, B=31.65 relative to 28.92, p<.001), the mean annual change in BMI both before and after FMP or surgery did not differ by race. With waist circumference as the outcome, adjusted by the covariates previously listed, change in waist circumference did not vary by hysterectomy status or race/ethnicity (data not shown).
Discussion
This study explored the potential contribution of hysterectomy and bilateral oophorectomy to weight gain among women in midlife by comparing BMI trajectories of women with hysterectomy with ovarian conservation and hysterectomy with bilateral oophorectomy with those of naturally postmenopausal women. We found that BMI generally increased over the course of the menopausal transition for all women, with a steeper mean annual increase in BMI following hysterectomy with bilateral oophorectomy relative to natural menopause. Our results suggest that while weight gain is common across the menopausal transition, it is accelerated following hysterectomy with bilateral oophorectomy.
While these findings are consistent with some prospective studies suggesting an increased risk for weight gain (15) and severe obesity following hysterectomy with bilateral oophorectomy (5), they differ from others that showed increases in BMI following hysterectomy with ovarian conservation (7) or no effect of hysterectomy with bilateral oophorectomy on BMI (6,16). Discrepancies in findings may be due to differences in the age and menopausal status of other samples (7), limitations in BMI measurement (6), and comparison to nonhysterectomized, age-matched women rather than naturally menopausal women (6,16).
Several limitations of our study should be noted. The consequences of elective hysterectomy and oophorectomy in midlife women may differ from those of younger women, and findings should not be generalized to younger populations. Further, as women with prior hysterectomy were ineligible for SWAN enrollment, women who had a hysterectomy after enrollment are not representative of all women with hysterectomy. This may be particularly true of the non-Caucasian women in this sample, as minority women screened for SWAN were more likely to have been excluded due to past hysterectomy.(17) These sample characteristics may have contributed to differences between the results of the present study and others.
Despite these limitations, the study also had considerable strengths. A large, well-characterized, multi-ethnic population-based sample of women in midlife was examined, providing information about symptom experience among women from diverse backgrounds. Data were collected over an eleven-year period, allowing for observations across a range of participant ages and stages in the menopausal transition. This study was unique in prospectively evaluating BMI and hysterectomy status, providing information on changes in BMI relative to elective hysterectomy with and without bilateral oophorectomy while accounting for changes in BMI over time prior to surgery. The comparison of these trajectories to those of naturally postmenopausal women offers needed information not only on the possible effects of oophorectomy over hysterectomy alone, but also how they differ from general trends experienced over the natural menopausal transition.
Overall, the results of this study should lend caution to treatment decisions regarding bilateral oophorectomy concomitant with elective hysterectomy among women in midlife. Weight gain is common in midlife and may be accelerated in midlife women following surgery. This weight gain may confer increased risks for obesity-related diseases in the postmenopausal period.
Acknowledgments
The Study of Women’s Health Across the Nation (SWAN) has grant support from the National Institutes of Health (NIH), DHHS, through the National Institute on Aging (NIA), the National Institute of Nursing Research (NINR) and the NIH Office of Research on Women’s Health (ORWH) (Grants NR004061; AG012505, AG012535, AG012531, AG012539, AG012546, AG012553, AG012554, AG012495). The content of this manuscript is solely the responsibility of the authors and does not necessarily represent the official views of the NIA, NINR, ORWH or the NIH.
Clinical Centers: University of Michigan, Ann Arbor – Siobán Harlow, PI 2011 – present, MaryFran Sowers, PI 1994–2011; Massachusetts General Hospital, Boston, MA – Joel Finkelstein, PI 1999 – present; Robert Neer, PI 1994 – 1999; Rush University, Rush University Medical Center, Chicago, IL – Howard Kravitz, PI 2009 – present; Lynda Powell, PI 1994 – 2009; University of California, Davis/Kaiser – Ellen Gold, PI; University of California, Los Angeles – Gail Greendale, PI; Albert Einstein College of Medicine, Bronx, NY – Carol Derby, PI 2011 – present, Rachel Wildman, PI 2010 – 2011; Nanette Santoro, PI 2004 – 2010; University of Medicine and Dentistry – New Jersey Medical School, Newark – Gerson Weiss, PI 1994 – 2004; and the University of Pittsburgh, Pittsburgh, PA – Karen Matthews, PI.
NIH Program Office: National Institute on Aging, Bethesda, MD – Winifred Rossi 2012; Sherry Sherman 1994 – 2012; Marcia Ory 1994 – 2001; National Institute of Nursing Research, Bethesda, MD – Program Officers.
Central Laboratory: University of Michigan, Ann Arbor – Daniel McConnell (Central Ligand Assay Satellite Services).
Coordinating Center: University of Pittsburgh, Pittsburgh, PA – Kim Sutton-Tyrrell, CoPI 2001 – present; Maria Mori Brooks Co-PI 2012; New England Research Institutes, Watertown, MA - Sonja McKinlay, PI 1995 – 2001.
Steering Committee: Susan Johnson, Current Chairm
Chris Gallagher, Former Chair
We thank the study staff at each site and all the women who participated in SWAN.
Footnotes
Conflict of interest
The authors have no conflicts of interest to declare.
Supported by Cardiovascular Behavioral Medicine Training Grant NIH T32 HL 007560.
References
- 1.Keshavarz H, Hillis SD, Kieke BA, Marchbanks PA. Hysterectomy surveillance. United States 1994–1999. MMWR CDC Surveill Summ. 2002;51:1–8. [PubMed] [Google Scholar]
- 2.Whiteman MK, Hillis SD, Jamieson DJ, Morrow B, Podgornik MN, Brett KM, et al. Inpatient hysterectomy surveillance in the United States, 2000–2004. Am J Obstet Gynecol. 2008 Jan;198(1):34. e1–7. doi: 10.1016/j.ajog.2007.05.039. [DOI] [PubMed] [Google Scholar]
- 3.El-Hemaidi I, Gharaibeh A, Shehata H. Menorrhagia and bleeding disorders. Curr Opin Obstet Gynecol. 2007 Dec;19(6):513–20. doi: 10.1097/GCO.0b013e3282f1ddbe. [DOI] [PubMed] [Google Scholar]
- 4.Spilsbury K, Semmens JB, Hammond I, Bolck A. Persistent high rates of hysterectomy in Western Australia: a population-based study of 83 000 procedures over 23 years. BJOG. 2006 Jul;113(7):804–9. doi: 10.1111/j.1471-0528.2006.00962.x. [DOI] [PubMed] [Google Scholar]
- 5.Sutton-Tyrrell K, Zhao X, Santoro N, Lasley B, Sowers M, Johnston J, et al. Reproductive hormones and obesity: 9 years of observation from the Study of Women’s Health Across the Nation. Am J Epidemiol. 2010 Jun 1;171(11):1203–13. doi: 10.1093/aje/kwq049. [DOI] [PMC free article] [PubMed] [Google Scholar]
- 6.Cooper R, Kuh D, Hardy R, Power C. Is there an association between hysterectomy and subsequent adiposity? Maturitas. 2007 Nov 20;58(3):296–307. doi: 10.1016/j.maturitas.2007.09.004. [DOI] [PMC free article] [PubMed] [Google Scholar]
- 7.Moorman PG, Schildkraut JM, Iversen ES, Myers ER, Gradison M, Warren-White N, et al. A prospective study of weight gain after premenopausal hysterectomy. J Womens Health (Larchmt) 2009 May;18(5):699–708. doi: 10.1089/jwh.2008.1019. [DOI] [PMC free article] [PubMed] [Google Scholar]
- 8.Sowers M, Tomey K, Jannausch M, Eyvazzadeh A, Nan B, Randolph J., Jr Physical functioning and menopause states. Obstet Gynecol. 2007 Dec;110(6):1290–6. doi: 10.1097/01.AOG.0000290693.78106.9a. [DOI] [PMC free article] [PubMed] [Google Scholar]
- 9.Sowers M, Crawford S, Sternfeld B, et al. Menopause: Biology and pathology. New York, NY: Academic Press; 2000. SWAN: A multicenter, multiethnic, community-based cohort study of women and the menopausal transition; pp. 175–80. [Google Scholar]
- 10.Sternfeld B, Ainsworth BE, Quesenberry CP. Physical activity patterns in a diverse population of women. Prev Med. 1999 Mar;28(3):313–23. doi: 10.1006/pmed.1998.0470. [DOI] [PubMed] [Google Scholar]
- 11.Baecke JA, Burema J, Frijters JE. A short questionnaire for the measurement of habitual physical activity in epidemiological studies. Am J Clin Nutr. 1982 Nov;36(5):936–42. doi: 10.1093/ajcn/36.5.936. [DOI] [PubMed] [Google Scholar]
- 12.Ware J. Manual and Interpretation Guide. Boston, MA: The Health Institute, New England Medical Center; 1993. SF-36–211 Health Survey. [Google Scholar]
- 13.Bryk A, Raudenbush S. Hierarchical linear models: Applications and data analysis methods. 1992. London: Sage; [Google Scholar]
- 14.Welborn TA, Dhaliwal SS. Preferred clinical measures of central obesity for predicting mortality. Eur J Clin Nutr. 2007 Dec;61(12):1373–9. doi: 10.1038/sj.ejcn.1602656. [DOI] [PubMed] [Google Scholar]
- 15.Carlson KJ. Outcomes of hysterectomy. Clin Obstet Gynecol. 1997 Dec;40(4):939–46. doi: 10.1097/00003081-199712000-00029. [DOI] [PubMed] [Google Scholar]
- 16.Fitzgerald DM, Berecki-Gisolf J, Hockey RL, Dobson AJ. Hysterectomy and weight gain. Menopause. 2009 Apr;16(2):279–85. doi: 10.1097/gme.0b013e3181865373. [DOI] [PubMed] [Google Scholar]
- 17.Powell LH, Meyer P, Weiss G, Matthews KA, Santoro N, Randolph JF, Jr, et al. Ethnic differences in past hysterectomy for benign conditions. Womens Health Issues. 2005 Aug;15(4):179–86. doi: 10.1016/j.whi.2005.05.002. [DOI] [PubMed] [Google Scholar]