

Abstract
Current generation DNA sequencing instruments are moving closer to seamlessly sequencing genomes of entire populations as a routine part of scientific investigation. However, while significant inroads have been made identifying small nucleotide variation and structural variations in DNA that impact phenotypes of interest, progress has not been as dramatic regarding epigenetic changes and base-level damage to DNA, largely due to technological limitations in assaying all known and unknown types of modifications at genome scale. Recently, single-molecule real time (SMRT) sequencing has been reported to identify kinetic variation (KV) events that have been demonstrated to reflect epigenetic changes of every known type, providing a path forward for detecting base modifications as a routine part of sequencing. However, to date no statistical framework has been proposed to enhance the power to detect these events while also controlling for false-positive events. By modeling enzyme kinetics in the neighborhood of an arbitrary location in a genomic region of interest as a conditional random field, we provide a statistical framework for incorporating kinetic information at a test position of interest as well as at neighboring sites that help enhance the power to detect KV events. The performance of this and related models is explored, with the best-performing model applied to plasmid DNA isolated from Escherichia coli and mitochondrial DNA isolated from human brain tissue. We highlight widespread kinetic variation events, some of which strongly associate with known modification events, while others represent putative chemically modified sites of unknown types.
DNA sequencing carried out using current first and second (or next) generation sequencing (NGS) instruments has achieved significant success in providing DNA sequences in which the A's, G's, C's, and T's comprising any given DNA template of interest are very consistently called at accuracies that exceed 99%, enabling an explosion of whole-genome sequencing applications that promise to transform our understanding of living systems and usher in the era of personalized genomics (Shendure and Ji 2008; Wheeler et al. 2008; Huang et al. 2009; Wall et al. 2009; Alexander et al. 2010; Drmanac et al. 2010; Flusberg et al. 2010; Kan et al. 2010; Qin et al. 2010; van Bakel et al. 2010). However, extensive characterization of the chemical composition of bases encountered in DNA sequences has resulted in the enumeration of many different types of bases existing in nature that go beyond the fundamental deoxyribonucleotides (A's, G's, C's, and T's) that NGS technologies produce as the end product of their sequencing reactions. Chemical modifications and damage events such as 5-methylcytosine (5-mC), 5-hydroxylmethylcytosine (5-hmC), 6-methyladenine (6-mA), 8-oxoguanine (8-oxoG), pyrimidine dimers, and ribonucleotides, have been shown to play an increasingly important role in the regulation of genes and their association to disease. Presently, only 5-mC can be routinely detected using NGS technology and then only after samples have been bisulfite treated, a procedure that creates a number of experimental and informatics challenges (Cokus et al. 2008). Thus, new technologies and assays are needed to fully characterize DNA and RNA sequences if we hope to completely characterize variation in genomes and transcriptomes.
Single-molecule real-time (SMRT) technology is the first commercially available platform to directly observe single molecules of DNA polymerase as they synthesize DNA sequences, not only leveraging the speed and processivity of this enzyme to address many of the shortcomings of second-generation sequencing technologies (Levene et al. 2003; Eid et al. 2009), but providing a time dimension from which the kinetics of the DNA polymerase enzyme can be inferred in real time as DNA sequencing is carried out (Schadt et al. 2010). That is, as the DNA polymerase is synthesizing a strand of DNA, incorporating a base or translocating to the next base after an incorporation event, the time it takes the enzyme to carry out those processes can be directly observed. While stochastic processes drive much of the kinetic variation observed within and between single-molecule sequencing reactions, we have recently found that subtle changes in sequence context (e.g., methylation of a given cytosine residue at a given base location in a DNA template of interest) reproducibly alter the kinetics of base incorporation, providing for the possibility of directly observing chemical modification or damage events to nucleotides, and even discriminating between such events as a routine part of the SMRT DNA sequencing process (Flusberg et al. 2010).
Presently, no statistical framework has been proposed to identify kinetic variation events from SMRT sequencing data that can serve as a surrogate for chemical modifications of DNA or RNA sequences. In the first study published demonstrating the utility of kinetic variation information for detecting chemical modifications like 5-mC, a simple ratio measure was used to compare the kinetic parameters between two experimental groups for a given base position of interest (Flusberg et al. 2010). Empirically determined thresholds for the ratio measure were applied to identify putative modified bases in an artificially modified template sequence. While this simple ratio approach is effective at identifying high-confidence KVEs, it does not maximally leverage the available information. For example, the ratio method only makes use of mean kinetic variation behavior at a single site, not taking into account other features of the kinetic parameter distributions, such as number of observations, variance, kinetic information at neighboring bases that may reflect modifications at a given test site, and interactions between neighboring sites. Empirical data have shown that some base modification types induce correlated shifts in kinetics at neighboring sites (Flusberg et al. 2010).
Here, we develop a statistical framework for inferring kinetic variation from SMRT sequencing data. By modeling enzyme kinetics in the neighborhood of an arbitrary location in a given genomic region of interest as a conditional random field (referred to here as the CRF model), we provide a way to incorporate kinetic information not only at a test position of interest, but at neighboring sites as well. This model encompasses interactions among neighboring sites that can help enhance power to detect kinetic variation events. We demonstrate that single-site likelihood models, simple t-tests, and multisite likelihood models in which the sites are assumed to be independent, are special instances of the CRF model. The performance of the CRF model, reduced models derived from the CRF model, and nonparametric single-site models are compared using DNA templates in which the modification type and positions modified are known with complete certainty. Finally, we apply the best-performing models to plasmid DNA isolated from Escherichia coli and mitochondrial DNA isolated from postmortem human brain tissue. We highlight widespread kinetic variation events, some of which strongly associate with known modification events, while others represent putative chemical modifications.
Results
A general CRF model for detecting kinetic variation in SMRT sequencing data
SMRT sequencing is carried out using zero-mode waveguides (ZMW) that are capable of isolating a single DNA polymerase molecule. Sequencing by synthesis in a ZMW is carried out at the single-molecule level by anchoring one molecule of DNA polymerase bound to a single DNA sequence to be synthesized to the bottom of the ZMW. Nucleotides, each type labeled with a different colored fluorophore, are then allowed to diffuse in and out of the ZMWs. While held by the polymerase, the fluorescent label emits colored light. The sequencing instrument detects this as a flash (or pulse) whose color corresponds to the base identity. When the nucleotide is incorporated into the growing DNA strand—a process that takes on the order of milliseconds—the fluorophore is cleaved from the newly incorporated nucleotide. Critically, the time it takes for the incorporation to be carried out is measured and provided as the duration of the pulse (referred to as pulse width or PW). Following incorporation, the signal immediately returns to baseline and the process repeats The time between the incorporation events is also precisely measured (referred to as the interpulse duration or IPD). While there is a fair degree of stochastic variation in the IPD and PW values over different reads covering a common genomic region, reproducible variations in IPD and PW are induced as a result of modifications to the bases, as has been previously shown (Flusberg et al. 2010). Given the high degree of regulation involved in the base incorporation process, PW is not as sensitive to shifts in sequence context induced by modifications as IPD (Flusberg et al. 2010). Therefore, for the purposes of developing an initial model of kinetic variation, we restrict attention to IPDs.
Consistent differences in IPD values between two sets of conditions at a given test site or between different groups of molecules in a given sample can serve as a surrogate for chemical modification events. For example, consider the IPDs between two samples at a given sequence location in which the site has an unmodified G residue in one sample, and the G residue in another sample has been modified to 8-oxoguanine, a common DNA lesion resulting from reactive oxygen species (Kanvah et al. 2010). Representative traces for the unmodified position and neighboring bases and the modified base and the same neighboring bases are shown in Figure 1A, with the IPDs after the modified base being generally longer compared with the IPD after the unmodified base. The consistency of this longer IPD over the different reads of individual molecules in the modified versus unmodified samples is shown in Figure 1B using the modeling discussed below. Further, as can be seen in Figure 1B, the IPDs of some of the neighboring bases of the modified site are also altered in a statistically significant way.
Figure 1.

Reproducible variation in interpulse durations as a surrogate for chemical modifications to nucleotide bases. (A) Sample traces of six DNA molecules, three in which the DNA template contains a single 8-oxoG modification (right three traces), and the other identical but with no 8-oxoG modification (left three traces). While the IPD is observed to vary significantly even within the same modification state (a consequence of the exponential nature of the IPD), in the case of the 8-oxoG residue the IPDs are seen to be generally longer than the IPDs of the unmodified G residue. (B) After examining hundreds of molecules in which the G residue was modified versus unmodified, the consistent lengthening of the mean IPD for the modified G residue compared with the mean IPD for the unmodified G residue becomes statistically significant (red bar). The effect of the 8-oxoG modification to the G residue is also seen to affect the IPDs of the neighboring bases in a statistically significant way. In this case, the P-value indicated at each position was computed using the Mann-Whitney test.
Another interesting feature of the DNA polymerase kinetics in SMRT sequencing is that it is exquisitely sensitive to local sequence context. That is, a significant proportion of the variance in the IPD measures can be explained by local sequence context. In fact, seven bases upstream of and two bases downstream from the incorporation site explain >80% of the variance in the IPD measures (Fig. 2A). If this 10-mer sequence context is taken into account between different sequence runs carried out on different species, it still explains the vast majority of the variation in the IPD measures (Fig. 2B). The strong dependence of IPD on local sequence context, combined with the fact that modifications at one base can affect the IPD at nearby bases, support that modifications to bases change the local sequence context in ways that alter how the local sequence (the 10-mer) interacts with the enzyme, and these interactions can be nonlinear, with changes in one base affecting the kinetics of the enzyme at nearby bases. Therefore, to test whether IPDs at a given position reflect different kinetic rate distributions, taking into account IPDs at neighboring positions and allowing for interactions between the different IPD vectors at neighboring sites, have the potential to enhance the power to detect kinetic variation events.
Figure 2.

DNA polymerase kinetics in SMRT sequencing is a function of the local sequence context of the incorporation site, motivating a conditional random field approach to KVE detection. (A) Heatmap of the coefficient of determination (R2) for the IPD variance for the incorporation site of a SMRT sequencing reaction explained by local sequence context. This heatmap suggests that seven bases upstream of and two bases downstream from the incorporation site are the most informative, and that bases beyond this context do not provide much additional information about the enzyme kinetics. (B) Scatter plot comparing IPDs in identical sequence contexts between whole-genome amplified E. coli and M. genitalium samples. Each point represents the log of the IPD for a given 10-bp context (seven bases upstream of and two bases downstream from the incorporation site) in E. coli (y-axis) and M. genitalium (x-axis): 2500 points sampled from the 1,048,576 possible 10-mer contexts are shown here for ease of viewing. The strong correlation (Pearson's correlation coefficient = 0.91) between IPDs in identical contexts assayed from completely independent sequencing runs of different species demonstrate that the context effects are highly consistent between experiments. (C) Graphical representation of the CRF model. The  variables represent the hidden modification states for site i, while the
  represent the observed IPD values for site i that inform on the modification status of the site. In this model we are considering interactions between the incorporation site,
  , and the two nearest neighboring sites on each side of
  . The edges between the
  variables indicate there can be interactions between the local sites, with the
  parameters representing the degree of interaction among the nodes. The
  parameters represent the exponential rates for the two possible rate classes at each position i (
 ), while the
  parameters represent the proportion of molecules in state k at position i (with
  ).
).
Therefore, to characterize the IPD values at a given site of interest and at positions flanking the site of interest, we developed a model that considers IPD information at sites flanking the site of interest and allows for neighboring sites to interact (Fig. 2C). To see how the graphical model depicted in Figure 2C is developed, consider any number of aligned sequences N nucleotides long in which we wish to assess whether the IPDs or related trace-derived metrics for a given data set are sampled from multiple distributions (each distribution corresponding to a “rate class”) at a given site of interest, and whether there is interaction among the rate classes at neighboring sites. To model this, we assume that associated with the N sites for a given read is a random rate class vector, 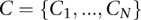 , where the
  can take on different rate class values from the set
  , corresponding to different IPD distributions that a given read (single DNA molecule sampled from the population of reads of interest) can follow. For a given rate class instance,
  , at position i in the DNA sequence of interest, we have an associated kinetic rate
  . Given the exponential nature of the IPD distribution (see below) and the want to account for interactions among the neighboring sites, we model the rate class vector as a Gibbs random field (see Methods).
Given this general construct, for each site i we have that the IPD corresponding to that site can take on one of R kinetic rates,  , corresponding to the different rate classes. We can assume that the IPD for a given site follows a particular distribution, like exponential or lognormal. Once a distributional form of the IPD is chosen and once we limit the extent of spatial interaction that is possible among the sites, an IPD likelihood function can be formed and efficiently computed (see Methods for details). Parameterization of the potential function includes not only multiple different rate classes for IPDs at a given site, but it also includes interaction terms between the sites that reflect correlation of the rate classes between sites, given modifications at one site can influence the IPDs at neighboring sites.
Parameter estimates in the likelihood model are obtained using standard maximum likelihood techniques. While the model we developed can accommodate any number of rate classes and interaction terms, we consider herein a maximum of two rate classes per site and only nearest neighbor interactions, referring to the corresponding likelihood function as the full CRF model. We are generally interested in testing specific positions in a sequence for kinetic variation, so that, typically, the full CRF model would not be run over the entire sequence under consideration, but instead would be applied to a small window around each test site of interest. The window size should be set so as to capture all sites neighboring the test site of interest that have the potential to inform on the modification status of the test site.
CRF-based tests for detecting kinetic variation events
There are two types of applications to consider in developing a statistical test for kinetic variation using the CRF model. The first is the supervised application in which two groups are compared at each test position to determine whether the kinetic rates at the test site vary between the two groups. For example, DNA sequence data generated from DNA isolated from an organism of interest can be compared with DNA sequence data generated from whole-genome amplified (WGA) DNA isolated from the same organism. In this case, WGA erases all of the base modifications from the DNA so that WGA versus native DNA enables a direct comparison of rates between the two groups. The second type of application is unsupervised, in which DNA sequence data is generated for a given sample and the aim is to then discover whether there are a mixture of rate distributions at a given test site of interest within that given sample.
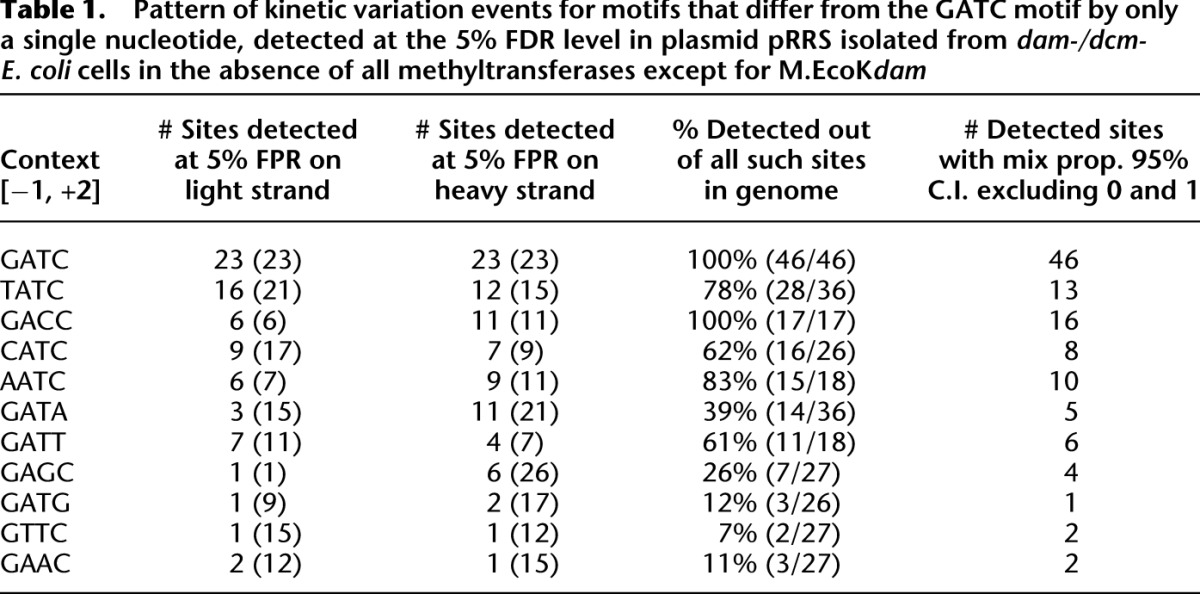
For the unsupervised case, the null hypothesis is that there is no kinetic variation at the test site of interest (only a single-rate parameter) versus the alternative hypothesis that there is a mixture of distributions for the IPD that have different rates (two rate parameters). These competing hypotheses can be tested using a standard likelihood ratio test in which the null hypothesis is rejected in favor of the alternative hypothesis if the resulting P-value is below some significance threshold. The individual parameter estimates from the full CRF model can be used to test for a variety of effects as well. For a given site there is a parameter that estimates the proportion of reads whose IPDs were sampled from a given rate class distribution, a parameter that indicates the degree to which rate classes between sites in the window flanking the test site are correlated over the space of reads considered, and a parameter for the actual rate of each rate class (see Methods for details). The supervised case is similar to the unsupervised case, but in the supervised case the full CRF model no longer includes interaction terms, given the grouping of sequences into different rate classes is fixed, so that the rates between sites are perfectly correlated.
The full CRF model includes as special cases a number of simpler, but useful models. In the supervised case we can assume that all interaction terms in the CRF model are 0, so that in this case the CRF model reduces to a simple product of likelihoods (referred to as the multisite likelihood model) in which rate class assignments for a given site are made independently of all other sites. If we set the window size to 1 (considering only a single base at a time), the multisite likelihood model reduces to a single-site likelihood model, in which we are simply comparing IPD values at a given site between two groups. In the case where we assume that the log of the IPDs are distributed as a normal random variable, the single-site likelihood model is equivalent to a simple t-test. In the unsupervised case, if we set the window size to 1, the CRF model reduces to a simple single-site mixture model. Finally, we note that while there are some features of the CRF model that could be captured by a Hidden Markov Model (HMM), we chose the discriminative CRF model over the generative HMM to allow for greater flexibility in modeling nonconsecutive, spatially separated dependencies between IPDs and for modeling interactions among features.
The CRF model and derived submodels assume an underlying distribution for the IPDs. The process of a DNA polymerase enzyme sampling nucleotides during active synthesis to identify the appropriate base for incorporation has previously been shown to be a Poisson process, so that the waiting time between incorporation events (the IPDs) is exponentially distributed. There is a highly significant quadratic relationship between the IPD mean and variance that supports the IPDs as exponentially distributed random variables (Supplemental Fig. 1). However, direct observation of the P-value distribution in the control data of the 5-mC set under the null hypothesis that the IPDs are exponentially distributed, gave rise to a strong anticonservative distribution (Supplemental Fig. 2A), whereas a uniform P-value distribution was expected. We have previously noted that during the synthesis process, the DNA polymerase enzyme may pause at times for abnormally long intervals (Flusberg et al. 2010). We suspected that the nonuniform P-value distribution could be driven by such events. Therefore, we set an IPD threshold to treat very long IPD values as missing data (given that the translocation kinetics in these cases are obscured by enzyme-pausing issues), which was effective in producing a uniform P-value distribution under the null hypothesis of no kinetic rate variation (Supplemental Fig. 2B).
Application and comparison of the CRF and related models
To explore the utility of the full CRF model and simpler models derived from the CRF model, we examined a 3995-bp plasmid from EcoK-, dam-/dcm- E. coli cells that lacked all methyltransferase enzymes except M. Sau3AI, an enzyme known to specifically methylate the C residue (5-methylcytosine) in a GATC sequence context (Fig. 3A; Clark et al. 2012). The plasmid contains 19 GATC contexts so the expectation is that the M.Sau3AI enzyme would methylate all of these sites, and as a result we would expect to make 19 detections covering all GATC contexts and no detections outside of that context given the strong context sensitivity of M.Sau3AI. We chose this type of methylation because it has among the most subtle impacts on the enzyme kinetics (small effect size), enhancing the power to discriminate among the different models at moderate fold coverage. We generated on average 1000-fold coverage of sequence data on the modified template sequence in addition to roughly 1000-fold coverage on the unmodified (no 5-mC residues) template sequence, using the Pacific Biosciences single-molecule, real-time (SMRT) DNA sequencing instrument (Clark et al. 2012). Given knowledge of the exact locations of the modified bases, sensitivity and specificity of the different models can be assessed on observed data and compared using receiver operator characteristic (ROC) curves, which simply reflect the rate at which a given model identifies true positives as a function of false positives. The area under the ROC curves serves as a natural metric for rank-ordering competing models, with an AUC score of 0.5 representing what would be expected by chance and an AUC score of 1.0 representing perfect prediction. The P-value plot depicted in Figure 3A is for the single-site model applied to the filtered full-coverage data set, with all C residues in GATC contexts detected, demonstrating the specificity of the M.Sau3AI enzyme to the GATC context (see also Supplemental Fig. 3).
Figure 3.

Detecting kinetic variation events using different models derived from the full CRF model. (A) Plasmid pRRS depicted as a circos plot, with the inside of the annulus representing the coordinates of the plasmid, the blue hash marks indicating C residues in a GATC context, and the two red curves representing –log10(P-value) for the single-site likelihood model for the two DNA strands. The P-values are based on 475-fold filtered coverage of the plasmid genome. In this case, at a 5% FDR threshold, all methylated sites in the GATC context were detected and no other sites outside of the GATC context were detected. (B) Receiver operator characteristic (ROC) curves for the supervised models described in the text applied to the M.Sau3AI plasmid and control data, with false-positive rate (FPR) plotted along the x-axis, and true-positive rate (TPR) plotted along the y-axis. The [−1,+1], [−2,+1], [−3,+1], and [−4,+1] labels in the legend indicate the window size and position with respect to the test site (at 0 in each interval) to which the multisite model was fitted. (C) ROC curves for the unsupervised models described in the text applied to the M.Sau3AI plasmid data only. The ROC curves dipping below the diagonal results from the relatively small number of true positive sites (relative to all sites tested) and that these sites were detected at a lower rate compared with false-positive sites. (D) ROC curves for the unsupervised models applied to the 8-oxoG data.
Figure 3B depicts the ROC curves for seven different kinetic rate-variation detection models applied to the M.Sau3AI data set in supervised mode at a lower fold coverage of 800 subsampled from the original data for evaluation purposes and then filtered before the models were applied: the exponential single-site model, a single-site nonparametric model that makes no underlying assumptions on the IPD distributions (using the Kruskal-Wallis test, a nonparametric analog to the t-test), three different multisite models assuming exponentially distributed IPD values with different window sizes and positions relative to the test site, and the CRF model assuming exponentially distributed IPD values. The single-site models all performed similarly, detecting ∼60% of the modified sites at a 5% false-positive rate, and AUCs equal to 0.83, 0.82, and 0.82 for the lognormal, exponential, and nonparametric single-site models, respectively. The CRF model outperformed the single-site models, but the multisite models assuming independence among the sites outperformed the CRF and single-site models to a significant degree (Fig. 3B), where in the best case, 100% of the methylated sites were detected at a 5% false-positive rate. The AUC measures for the multisite models assuming site-to-site independence at window sizes of 3, 4, 5, and 6 were 0.94, 0.98, 0.99, and 0.98, respectively, while the AUC measures for the two CRF models considered were 0.85 (no interaction terms) and 0.93 (nearest neighbor interactions). These results suggest that for 5-mC data, the multisite models are better powered to pick out kinetically varying sites that correspond to chemically modified bases, reflecting that multiple sites in the neighborhood of a test site can provide information as to the state of a given site. The interaction terms in the CRF model do not provide any additional information over the independent site information captured by the multiple-site models, and so it is less powered to make detections given the loss of degrees of freedom to fit these parameters.
Figure 3C depicts the ROC curves for three different kinetic rate-variation detection mixture models applied to the M.Sau3AI data set in unsupervised mode: the single-site exponential mixture model and two CRF models with different window sizes. To highlight the power difference between the supervised and unsupervised cases, the single-site exponential model is provided in Figure 3C for comparison. Interestingly, none of the unsupervised models performs well at what would otherwise be considered more than sufficient sequence coverage for this type of experiment (>1000× coverage of the modified samples). The impact on enzyme kinetics in this case may be insufficient to make detections even with unlimited sample size. To explore this, we simulated IPDs for all sites for the plasmid sequence such that the IPD distributions were equivalent to those observed in the M.Sau3AI set, and then applied the full CRF model, allowing for nearest neighbor interactions. As we varied the sample size from 100- to 2000-fold coverage, the modified sites could not be identified with any greater accuracy then we would expect by chance (Supplemental Fig. 4A). However, when we increased the effect size by roughly three times that observed in the M.Sau3AI set, at 2000-fold coverage we could perfectly identify all modified sites with no false positives (Supplemental Fig. 4B). In this case, the addition of the interaction parameters in the CRF model significantly enhanced the fit of this model to the simulated data set compared with the multisite mixture models that do not include this term.
To test the unsupervised models further on a modification type with a much stronger impact on enzyme kinetics, we introduced two 8-oxoG modifications, a common DNA lesion resulting from reactive oxygen species (Kanvah et al. 2010), in a 199-bp template, given we had previously observed this modification type to give rise to significantly longer IPDs compared with 5-mC (data not shown). In this case, with a bigger effect size, the unsupervised models performed significantly better than random, with the CRF model taking into account multiple sites and interactions among rate class assignments at these sites outperforming the single-site mixture model (Fig. 3D; Supplemental Table 1). Interestingly, beyond the kinetic variation events caused by 8-oxoG, we observed a significantly increased error rate in the neighborhood of the 8-oxoG events (Supplemental Fig. 5). In this case, the errors can also be used to aid in the detection of 8-oxoG events. Specifically, for each base we counted the number of reads covering the corresponding position and the number of reads in which an error was observed near the position (mismatches or indels). Given these two counts in the control and experimental groups, we applied a likelihood ratio test based on the binomial distribution to test whether the error distributions for each site were similar between the two groups. The tests based on error rates perfectly coincided with the IPD-based log-likelihood tests in the 8-oxoG cases (Supplemental Fig. 5).
Detection of kinetic variation events in plasmids modified by bacterial DNA methyltransferases
Detecting kinetic variation events in DNA templates that have been artificially modified at specific sites is useful for calibrating model performance, but does not demonstrate the utility of formal statistical models well in detecting such events. Given the strong performance of the multisite likelihood model in detecting kinetic variation events in the M.Sau3AI data set in the supervised case, we further explored the pattern of modifications in a plasmid (pRRS) isolated from EcoK-, dam-/dcm- E. coli cells in which a plasmid expressing dam had been introduced, a more biologically interesting context in which to search for kinetic variation events (Clark et al. 2012). While M.EcoKdam is an enzyme thought to only methylate A residues in the GATC context, we previously demonstrated that the specificity of this enzyme for the GATC context is not as high as we observed with M.Sau3AI (Clark et al. 2012; Supplemental Fig. 6A). DNA from this plasmid was sequenced to high fold coverage (500-fold or greater). With 24 GATC contexts in this plasmid, all sites compared with control using the multisite likelihood model were identified at a 5% false discovery rate (FDR; Supplemental Fig. 6B). Kinetic variation events corresponding to the expected modifications in all of the GATC contexts (referred to here as on-target effects) represented in the plasmid sequence were detected with 100% accuracy. However, many other detections were made outside of the GATC context (referred to here as off-target effects), indicating modifications to bases outside of the expected target sites (Table 1). We note that the off-target effects that we observed are highly unlikely to result from sequencing errors given the random nature of the errors on the PacBio RS platform and given the high-degree of consensus sequence accuracy achieved on this platform (>99.99%) (Rasko et al. 2011; Bashir et al. 2012).
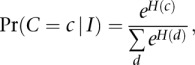
Table 1.
Pattern of kinetic variation events for motifs that differ from the GATC motif by only a single nucleotide, detected at the 5% FDR level in plasmid pRRS isolated from dam-/dcm- E. coli cells in the absence of all methyltransferases except for M.EcoKdam
While there is reduced power to detect kinetic variation events using the models in an unsupervised fashion, once kinetic variation events have been identified for specific sites, we can apply single-site mixture models to assess the fraction of molecules in a sample that are supported as modified. We applied the single-site mixture model to all sites listed in Table 1 and, on average, for on-target effects in which we expected 100% of the GATC sites to be modified, the 95% confidence interval for the estimate of the proportion of sites detected as unmodified did not include 0. The lower bound for the 95% confidence interval for all sites tested was 16% (see Supplemental Table 2 for a full listing of all confidence interval estimate). This result supports that while M.EcoKdam has high efficiency in modifying A residues in the GATC context, the modification rate may not be 100% for all molecules in a given sample. For the majority of sites associated with off-target effects, the average lower bound of the 95% confidence interval for the mixing proportion did not include 0 and ranged between 5% and 15%, indicating that the efficiency with which M.EcoKdam modifies A residues outside of the GATC context is similar when such sites are detected as modified. As shown in Table 1, many of the off-target effects are associated with sequence contexts that differ at only a single base position from the GATC context.
Detecting kinetic variation events in mtDNA sequences
The M.Sau3AI, 8-oxoG, and M.EcoKdam data sets involved scenarios in which the type of modification and sites affected were known a priori. To explore the extent of kinetic variation in DNA isolated from a more natural setting, we sequenced mtDNA isolated from mitochondria extracted from human postmortem brain tissue. The mitochondrial genome encodes 13 polypeptides required for electron transport and oxidative phosphorylation, along with rRNA and tRNA required for their translation. Lesions in mtDNA, like 8-oxoG, have been shown to occur and to affect gene function (Saxowsky et al. 2008) and are postulated to play a role in human brain aging as well as the development of various neurodegenerative diseases (Beal 2005). The mtDNA was sequenced to high fold coverage (>500-fold) and, again, kinetic variation events were detected using the multisite likelihood model. We identified 302 kinetic variation events at a 5% FDR in the mtDNA sample, with 172 detections occurring on the heavy strand encoding 22 of the 37 mtDNA genes versus 130 detections occurring on the light strand (Fig. 4A; Supplemental Table 3), representing ∼1% of the mitochondrial genome. Interestingly, G residues were 2.01-fold more likely to be identified as modified than we would expect by chance (given the proportion of G residues in the mtDNA genome), while A and T residues were 2.5- and 1.7-fold, respectively, less likely to be detected as kinetically varying compared with what would be expected by chance (Supplemental Table 3).
Figure 4.

Kinetic variation events detected in the mitochondrial genome. (A) The bottom left circular plot is an annotation of the mitochondrial genome with respect to the genes found on the heavy and light strands. The larger circular plot indicates the –log10 P-values for each position tested on the mitochondrial genome, with inside and outside of the circle representing the heavy and light strands, respectively. (B) Putative 8-oxoG event detected at position 4186 in the mitochondrial genome (heavy strand). (Left) The IPDs values are shown for six molecules from the neuronal mtDNA sample, with each molecule read five to 10 times within individual SMRTbells for each molecule. The color coding reflects the IPD value, with dark blue indicating IPDs <0.5 sec and dark red indicating IDPs >3.0 sec. Molecules 1–3 indicate highly variable IPDs with long IPDs represented, expected if the IPD distribution is exponentially distributed with a high IPD mean. Molecules 4–6 have significantly lower IPD values compared with molecules 1–3. These data suggest that molecules 1–3 are modified at this position compared with molecules 4–6. (Right) The mean IPD computed for each position within each molecule. The mean values at the highlighted test position are clearly different between molecules 1–3 and molecules 4–6, indicating why this site was detected as a kinetic variation event. None of the sites within 10 bases of this test site were detected as kinetic variation events. (C) DNA samples with (right) and without (left) evidence of modification were treated with a glycosylase to create single-strand breaks at oxidatively modified positions. The samples were PCR amplified before and after treatment to demonstrate the degree of modification. First-derivative plots of the amplification are shown.
Identification of putative 8-oxoG events in mtDNA
To determine whether the overrepresentation of G residues detected as kinetically varying could be due to 8-oxoG, we tested for increased rates of error using the error-based loglikelihood ratio test described above at the G residues detected as kinetically varying. G residue sites supported as significantly kinetically varying and with significantly increased error rates are prime candidates for 8-oxoG events. Of the 141 sites with a G residue detected as kinetic variation events, 12 were also detected as sites enriched for increased rates of sequencing error (Supplemental Table 3). Supplemental Figure 7 highlights an example of a putative 8-oxoG event discovered from the mtDNA sample, with the G base of interest having significantly longer IPDs and error rates compared with controls, similar to what we observed for the 8-oxoG events in the artificial template. Figure 4B shows one putative 8-oxoG event detected at position 4186 in the mitochondrial genome (heavy strand), which was further predicted by the unsupervised mixture model to have partial modification. The high variability of the signal depicted in this figure well illustrates the utility of a formal statistical model that takes variability into account in assessing significance. Increased modification at this site was confirmed using a PCR-based technique that detects the difference in the sensitivity of template DNA to treatment with 8-oxoG glycosylase. The sample with a predicted modification at position 4186 had a 10-fold (0.101 ± 0.09) reduction in amplification after glycosylase treatment when compared with a control sample in which no kinetic variation was detected (Fig. 4C).
Kinetic variation events at A residues
Given the detection of 34 kinetic variation events at A residues, and that A residues are not known to be modified in the mtDNA, we explored whether the data that supported those events are specific to the A residues where detections occurred. One reason these sites may be detected is that they are adjacent to other sites that are modified and that cause shifts in IPDs of the neighboring bases that include A residues. To focus on the sites that are unlikely to be affected due to neighboring modification events, we selected 14 sites (from the 34) that were greater than 20 bases from the nearest neighboring kinetic variation event, far greater than the range we have detected for any modification type (Flusberg et al. 2010; Supplemental Table 4). These 14 confident modifications of A residues could result from 8-oxo-A events (similar to 8-oxoG) or, less likely, from 6-mA events. While there is no literature support for 6-mA modifications being detected in human mtDNA, we do note that 6-mA events that we detected in the M.EcoKdam plasmid (Supplemental Fig. 6) were always most strongly detected at the A residue, consistent with our observations in the mtDNA genome. While the kinetic variation data on its own cannot resolve the modification type, the data do support that the A residues in these cases are modified in some way.
To experimentally validate whether KVEs at A residues are supported as 6-mA events, we rank ordered all 34 KVEs at A residues by –log10 (P-value) and selected the top 12 most significant KVE that were not within 6 bp of another KVE (Supplemental Table 5). Given the very strong dependence of local sequence context on IPDs (Fig. 2A,B) and the fact that modifications to bases change this context, we synthesized three 50-mer oligos for each of the 12 sites. Each oligo represents the local sequence context for the corresponding KVE site, with the 10 bases flanking the KVE site identical to the corresponding sequence in the mtDNA (Supplemental Table 5). The three oligos for each KVE differed at the KVE site, with one oligo harboring a standard A base at the KVE site (A oligos), another harboring a 6-mA base at the KVE site (6-mA oligos), and another harboring an 8-oxoA base at the KVE site (8-oxoA oligos). We then sequenced each of the oligos and generated kinetic variation signatures for the 6-mA and 8-oxoA oligos by comparing them with the A oligos. The 6-mA and 8-oxoA oligo kinetic signatures were then compared with the kinetic signature observed in the mtDNA for each site. The overall pattern was clear, with the 6-mA oligo kinetic variation signature most closely matching the observed mtDNA signature, while the 8-oxoA oligo kinetic signature was observed to give rise to secondary peaks that were not observed in the 6-mA oligo and mtDNA kinetic variation signatures (Supplemental Fig. 8).
Discussion
We have developed and applied a number of modeling techniques to third generation DNA sequencing data to detect kinetic variation events in these data that correspond to chemical modification of bases in the DNA sequences. Not only are these methods capable of detecting modifications with a high degree of sensitivity and specificity when fold coverage is high, but models like the CRF are capable of estimating the percentage of molecules within a given sample that harbor modifications at a given site, providing quantitative information on modification states that can in turn be associated with gene activity, protein states, disease status, genetic loci, or other biologically interesting covariates of interest. We note that the kinetic variation events are detected from SMRT sequencing data generated as part of routine sequencing, without any modifications required to the standard sequencing protocols for the PacBio RS platform. Further, we note that while the modeling approaches developed here were applied to the only commercially available third-generation DNA sequencing instrument available at the time this manuscript was written (the PacBio RS) (Schadt et al. 2010), we anticipate that this approach will be applicable to all single molecular sequencing technologies. Our model is predicated on being able to observe rate information associated with individual DNA (or RNA) molecules as they are processed. A recent demonstration of single-nucleotide resolution nanopore sequencing highlighted the ability to detect base modification (Manrao et al. 2012), supporting that detection of base modifications will likely be a feature of all emerging nanopore-based technologies.
The objective, data-driven fashion with which putative modification events can be detected from the kinetic and error rate variations is unprecedented, given no a priori assumptions need to be made as to the type of modification desired to be detected. Not only does this approach provide a way to understand the extent of such variations in genomes, but it provides the data necessary to associate these events with other biological information to understand the functional consequences of the chemical modifications to the bases. This advantage was well highlighted in the case of the pRRS plasmid in which N6-methyladenine events were not only detected in the expected GATC context, but in unexpected contexts as well (Table 1), like GACC, providing direct experimental support that the M.EcoKdam enzyme is more promiscuous, affecting many more sites than previously believed, and so providing for the possibility of far more extensive influence on gene regulatory activity. In the case of GACC, the predictions of the A sites being modified are supported experimentally using methyl-sensitive restriction digests (Clark et al. 2011). Similarly, the many detections made in the brain mtDNA genome opens the door for a completely novel form of DNA variation information to be associated with biologically relevant traits like gene expression, metabolite levels, disease-associated traits, and disease status. The extensive kinetic variation events uncovered in the mitochondrial genome can be scored in population-based mtDNA samples to test for association to DNA variations, or the mixing proportions of these events can be treated as a quantitative trait for which quantitative trait loci can be mapped.
The modeling presented herein should be considered as a first step in leveraging the extensive kinetic information provided by SMRT sequencing to uncover information that heretofore has been hidden from view. Exploring how spatial interactions in a given local context change as a function of the context will be important for maximizing the power to make detections. As more and more sequence information is generated under different conditions, it may be possible to define the neighborhood size that the DNA polymerase is sensitive to regarding the kinetics. Once all contexts are understood, baseline models can be established for all contexts and the detection of kinetic variation events will simply be a matter of comparing the IPD patterns for a given observed context against the baseline model constructed for that context. In addition, because the DNA polymerase enzyme is so exquisitely sensitive to local sequence context in the DNA template being synthesized, where modification events represent changes in the local sequence context, this type of data will be very useful in reducing error rates in the sequencing process, since kinetic patterns will be context specific.
Methods
Forming and computing the CRF likelihood function
In order to detect kinetic variation events at a specific site of interest, we must model the IPDs for that site, as well as neighboring sites, where we assume the assignment of rate classes between sites is not necessarily independent. Conditional random fields enable an explicit representation of dependencies between sites (Fig. 2C) in addition to an explicit parameterization of the distribution of IPDs at sites of interest, and so this approach was chosen as a very flexible modeling approach for this problem. Toward this end, for a given read in the alignment covering a position of interest, we can form the likelihood that the different IPDs corresponding to the different base positions in the read were sampled from a given rate class vector, by assuming the random rate class vector is distributed as a Gibbs random field, which assigns the prior probability
 |
for the realization  given the observed interpulse duration matrix
  , where
  is the potential function (for notational simplicity we have omitted the usual minus signs in the definition of potentials and priors), and
  is the partition function consisting of a multiple sum extending over all vectors
  drawn from the N-fold Cartesian product of
  .
.
Without loss of generality we assume that the IPDs are exponentially distributed (a reasonable assumption given nucleotide incorporation is well modeled as a Poisson process) (Eid et al. 2009), so that for a given rate assignment over a given sequence, n, the IPD likelihood is given by
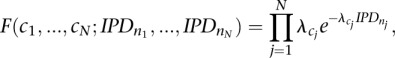 |
and then over all M reads in the alignment this likelihood can be written as:
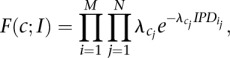 |
where  is the rate class vector and I is the matrix of IPD values
  .
.
Now, we are in a position to compute the full likelihood that includes rate variation over all sites and that considers all possible rate assignments:
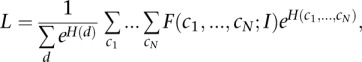 |
where the  are the rate class variables taking on rate class values
  that correspond to the rate parameters for a given site. At this level of generality it is not possible to suggest an efficient method of evaluating L. However, once we limit the extent of spatial interaction among the sites, evaluating the likelihood becomes straightforward. Because we want to allow the rate classes at different sites to be correlated, we propose a simple potential function:
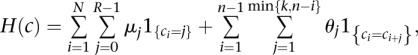 |
for a linear logistic model in which interactions extend over the k nearest neighbors. Here  accounts for the proportion of sites in class j, and the vector
  accounts for the spatial interaction over a distance. The indicator function
  equals 1 when condition D is true and 0 otherwise. Positive values of
  favor positive interactions between sites and induce clumped rate class assignments. Negative values of
  favor negative interactions and induce alternating rate class assignments. The full likelihood is then written as
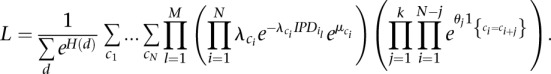 |
We obtain estimates for the parameters in this likelihood model using standard maximum likelihood techniques.
Preparing and sequencing DNA from plasmids and mitochondria
Synthetic template with 8-oxoG
A custom DNA template 199 bp in length was used to characterize the performance of the different statistical models in detecting 8-oxoG modifications.
AAAGAGAGAGAGAAGTGCACGGTCGATCAAGTACAGATCATGCGTTGCACGGTCGATCAAGTACAGATCATGCGTCGGGCTCGGAACTTTCGTTCCGAGCCCGACGCATGATCTGTACTTGATCGACCGTGCAACGCATGATCTGTACTTGATCGACCGTGCACTTCTCTCTCTCAACAACAACAACGGAGGAGGAGGA.
The 8-oxoG modifications were incorporated at positions 54 and 69 in this DNA template by Trilink BioTechnologies. The template DNA was then prepared for sequencing as described below for the 6-mA synthetic oligonucleotides.
Preparation of the plasmid DNA samples
Ligation products were used to transform NEB-Express E. coli (or NEB dam-/dcm- E. coli in the case of the M.Sau3AI ligation) and recombinant plasmid DNAs were isolated from ampicillin-resistant transformants, and the presence of inserts of the expected size was confirmed by restriction analysis. Plasmids were then used to transform ER2796, also called DB24, a strain that lacks all known E. coli MTase genes (Kong et al. 2000). Plasmid DNAs were reisolated from ER2796 cells and their methylation status was assessed by restriction with PstI plus the relevant cognate restriction endonuclease in the case of the construct containing M.Sau3AI. The construct containing the gene encoding M.EcoKdam, was assessed by restriction with PstI plus the MboI endonuclease. Unmethylated control substrates for each construct were produced by PCR amplification (using Phusion-HF polymerase) of the complete plasmids—using oligonucleotide primers that anneal to opposite strands of the vector DNA at a position 18 nt 5′ of the vector SbfI/PstI site. Control substrates were restricted with the same enzymes as the methylated plasmids but without PstI.
Preparation of mtDNA samples
The mtDNA sample was isolated from the cerebellum of a subject using a previously described method specifically designed for synaptosomal preparations (Dunkley et al. 2008) and for DNA preparation from the mitochondria that were isolated (Strauss 2001). These samples and patient data were handled in accordance with the policies and procedures established at the University of Pennsylvania. An aliquot of ∼25 ng of mitochondrial DNA was whole-genome amplified (WGA) using the REPLI-g Midi Kit (Qiagen) to erase DNA modifications. WGA and native plasmid and mitochondrial DNA were sheared to an average size of 300 bp via adaptive focused acoustics (Covaris). For the native mtDNA samples, a small amount of lambda DNA was spiked in as a control for the sample preparation and sequencing processes. After applying a local perfect-match filter over the range (−7:+2) for each test site, the average coverage in the native and control data was 95× and 230×, respectively.
Confirmation of DNA-modification by qRT-PCR
DNA modification was confirmed by comparison of amplification over a modified position before and after treatment with 8-oxoguanosine glycosylase (FPG, New England Biosciences) as previously described (Lu et al. 2004). DNA from samples (1 ng) with and without predicted modification were incubated in the presence or absence of 4U FPG. DNA was amplified with forward (m.4145–4164) and reverse (m.4246–4227) primers. Amplification was monitored by real-time PCR (Applied Biosystems). The post-treatment crossing-threshhold was compared with the pretreatment amplification for both samples and quantitated in ΔΔCt mode.
Construction of sequencing libraries and SMRT sequencing
With the DNA prepared from plasmids and mitochondria, SMRTbell sequencing libraries were prepared as previously described (Travers et al. 2010). Briefly, sheared DNA was end repaired, A-tailed, and hairpin adapters with a single T-overhang were ligated. Incompletely formed SMRTbells were degraded with a combination of Exonuclease III (New England Biolabs) and Exonuclease VII (USB). Primer was annealed and samples were sequenced on the PacBio RS as previously described (Korlach et al. 2010; Chin et al. 2011).
Constructing synthetic oligonucleotides with 6-mA modifications
Custom oligonucleotides containing modified bases were purchased from Trilink BioTechnologies and Integrated DNA Technologies. All oligonucleotides contained 5′ phosphate groups. SMRTbell templates were generated by ligating several synthetic oligonucleotides. Complementary and hairpin oligonucleotides were annealed by heating to 80°C for 2 min and slowly cooling to 25°C (0.1°C/sec) in 10 mM Tris (pH 7.5), 100 mM NaCl. Annealed oligonucleotides were ligated using T4 DNA Ligase (NEB) for 60 min at 25°C, followed by heat kill for 10 min at 65°C. Incompletely formed SMRTbell templates were degraded with a combination of Exonuclease III (NEB) and Exonuclease VII (USB) at 37°C for 30 min. SMRTbell templates were purified using QIAquick PCR Purification columns (Qiagen).
Data processing
SMRT Sequence data
Reads were processed and mapped to the respective reference sequences for each reference sequence (artificial template, plasmid, or mtDNA) using the BLASR mapper (http://www.pacbiodevnet.com/SMRT-Analysis/Algorithms/BLASR) and the Pacific Biosciences SMRTAnalysis pipeline (http://www.pacbiodevnet.com/SMRT-Analysis/Software/SMRT-Pipe) using the standard mapping protocol. Inter-pulse durations (IPDs) were measured as previously described (Flusberg et al. 2010) for all pulses aligned to each position in the reference sequence. For each group, WGA control versus native as described in the main text, we removed the boxplot outliers at each reference position. Each IPD, measurement was replaced by log(IPD + 0.01), and from each of these values we subtracted the mean for the corresponding subread. IPD ratio plots were visualized using Circos (Krzywinski et al. 2009).
Application of single and multisite models in the supervised case
For the single-site models, the likelihood under the null is nested in the likelihood under the alternative hypothesis. The null model assumes that the IPDs are sampled from a single-rate distribution, whereas the alternative model assumes they are sampled from two different rate distributions. When using a lognormal model for the IPD distributions, we used a pooled estimate of the variances for both the null and alternative models. The nonparametric test statistic was computed using the Kruskal-Wallis test with two groups. The theoretical distribution for all three single-site test statistics is χ2 with a single degree of freedom under the null hypothesis.
For the multisite likelihood model assuming independence between the sites, and for a given test position t of interest, the likelihood was found by summing up the exponential single-site test statistics in the window [t – u, t + d]. The theoretical distribution for the multisite test statistic over a window [−u, +d] is χ2 with u + d + 1 degrees of freedom. In the case of the partially supervised CRF, the window sized used was [−1, +1]. In this case, as in the single-site likelihood model case, the likelihood corresponding to the null hypothesis is nested within the likelihood corresponding to the alternative hypothesis. For the null model, the interaction terms are constrained to be 0, while in the alternative model they are allowed to vary. We refer to this model as partially supervised because it is assumed that the rate class for the first base in the window is known. In the ROC curve plots, the curve labeled Partially Supervised CRF [−1, +1] was obtained by taking the test statistics found for the partially supervised CRF and then summing them over a window of size [−1, +1], just as in the computation of the multisite test statistics. For this curve, the test statistic at position t includes information from a window of size [t – 2, t + 2]. We explored the use of different window sizes but found the results were not very sensitive to the selection of larger window sizes (data not shown).
Application of the CRF and derived models in the unsupervised case
For the unsupervised cases, the data were preprocessed as described above to normalize and remove outliers. For each reference position t, we retained only those subreads that had an IPD measurement available for each position in the window [t – 2, t + 1]. The asymmetric nature of this window size reflects that the DNA polymerase is more sensitive to the nucleotide composition upstream of the test position compared with the downstream nucleotide composition. Extending the window size for the data presented herein did not significantly enhance the power to make detections (data not shown).
The single-site mixture model under the null assumes a single-rate distribution at the test site, just as in the supervised case. The model for the alternative hypothesis assumes that the IPDs at the test position are sampled from two rate distributions. The null model is nested within the alternative model, and so the test of hypothesis was carried out using a standard loglikelihood ratio test.
For the CRF models, the curve labeled as CRF0 in the ROC curve plots is essentially the unsupervised analog of the multisite model described for supervised detection and can be found by summing the mixture model statistics over a window [−2, +1]. The CRF statistic (labeled as CRF1 in Fig. 3C,D) is also computed from a nested loglikelihood ratio test. The null model assumes that the IPDs at the test position are sampled from a single exponential rate distribution. The alternative model is found by fitting the CRF model described in the main text to the data using standard maximum likelihood techniques. In this case, under the alternative hypothesis, the model contains parameters for the rates, mixing proportions, and interaction terms.
To compute confidence intervals for the mixing proportions estimated in the unsupervised single-site likelihood model and in the CRF model, we case resampled 100 times to obtain standard error (SE) estimates. Assuming that the estimates would be approximately normally distributed, we estimated a lower/upper bound on the 95% confidence interval using ±1.96 SE.
The CRF and related models were all implemented in the software package R version 2.12; all code is available upon request.
Generating ROC curves
To generate the ROC curves shown in the main text and Supplemental figures, we randomly selected 25,000 subreads, fit the models as described, and then counted the number of true positives and the number of false positives for a range of P-value thresholds. This process was repeated 15 times and the results were averaged together.
Data access
The raw sequence data and alignments for the raw reads for the 199-bp DNA template with 8-oxoG modifications, the M.EcoKdam and M.Sau3AI plasmids, and the human mtDNA have been deposited in the NCBI Sequence Read Archive (SRA) (http://www.ncbi.nlm.nih.gov/sra) and are available under accession number SRA058893. In addition, all data are also available at http://www.pacbiodevnet.com/Share/Datasets/CRF-for-Base-Modification. A description of the data formats, software tools to manipulate these data formats, and all R code implementing the statistical models described herein can also be found at http://www.pacbiodevnet.com.
Competing interest statement
O.B, T.A.C., K.L., and J.K. are full-time employees at Pacific Biosciences, a company that is commercializing SMRT DNA sequencing. O.B, T.A.C., K.L., J.K, and E.E.S. all own stock in Pacific Biosciences.
Acknowledgments
This study was partially supported by the US National Institutes of Health grant 1RC2HG005618-01.
Footnotes
[Supplemental material is available for this article.]
Article published online before print. Article, supplemental material, and publication date are at http://www.genome.org/cgi/doi/10.1101/gr.136739.111.
Freely available online through the Genome Research Open Access option.
References
- Alexander RP, Fang G, Rozowsky J, Snyder M, Gerstein MB 2010. Annotating non-coding regions of the genome. Nat Rev Genet 11: 559–571 [DOI] [PubMed] [Google Scholar]
- Bashir A, Klammer A, Robins WP, Chen CS, Webster D, Paxinos E, Hsu D, Ashby M, Wang S, Peluso P, et al. 2012. A hybrid approach for the automated finishing of bacterial genomes. Nat Biotechnol 30: 701–707 [DOI] [PMC free article] [PubMed] [Google Scholar]
- Beal MF 2005. Mitochondria take center stage in aging and neurodegeneration. Ann Neurol 58: 495–505 [DOI] [PubMed] [Google Scholar]
- Chin CS, Sorenson J, Harris JB, Robins WP, Charles RC, Jean-Charles RR, Bullard J, Webster DR, Kasarskis A, Peluso P, et al. 2011. The origin of the Haitian cholera outbreak strain. N Engl J Med 364: 33–42 [DOI] [PMC free article] [PubMed] [Google Scholar]
- Clark TA, Murray IA, Morgan RD, Kislyuk AO, Spittle K, Boitano M, Fomenkov A, Roberts RJ, Korlach J 2011. Characterization of DNA methyltransferase specificities using single-molecule, real-time DNA sequencing. Nucleic Acids Res 40: e29 doi: 10.1093/nar/gkr1146 [DOI] [PMC free article] [PubMed] [Google Scholar]
- Cokus SJ, Feng S, Zhang X, Chen Z, Merriman B, Haudenschild CD, Pradhan S, Nelson SF, Pellegrini M, Jacobsen SE 2008. Shotgun bisulphite sequencing of the Arabidopsis genome reveals DNA methylation patterning. Nature 452: 215–219 [DOI] [PMC free article] [PubMed] [Google Scholar]
- Drmanac R, Sparks AB, Callow MJ, Halpern AL, Burns NL, Kermani BG, Carnevali P, Nazarenko I, Nilsen GB, Yeung G, et al. 2010. Human genome sequencing using unchained base reads on self-assembling DNA nanoarrays. Science 327: 78–81 [DOI] [PubMed] [Google Scholar]
- Dunkley PR, Jarvie PE, Robinson PJ 2008. A rapid Percoll gradient procedure for preparation of synaptosomes. Nat Protoc 3: 1718–1728 [DOI] [PubMed] [Google Scholar]
- Eid J, Fehr A, Gray J, Luong K, Lyle J, Otto G, Peluso P, Rank D, Baybayan P, Bettman B, et al. 2009. Real-time DNA sequencing from single polymerase molecules. Science 323: 133–138 [DOI] [PubMed] [Google Scholar]
- Flusberg BA, Webster DR, Lee JH, Travers KJ, Olivares EC, Clark TA, Korlach J, Turner SW 2010. Direct detection of DNA methylation during single-molecule, real-time sequencing. Nat Methods 7: 461–465 [DOI] [PMC free article] [PubMed] [Google Scholar]
- Huang S, Li R, Zhang Z, Li L, Gu X, Fan W, Lucas WJ, Wang X, Xie B, Ni P, et al. 2009. The genome of the cucumber, Cucumis sativus L. Nat Genet 41: 1275–1281 [DOI] [PubMed] [Google Scholar]
- Kan Z, Jaiswal BS, Stinson J, Janakiraman V, Bhatt D, Stern HM, Yue P, Haverty PM, Bourgon R, Zheng J, et al. 2010. Diverse somatic mutation patterns and pathway alterations in human cancers. Nature 466: 869–873 [DOI] [PubMed] [Google Scholar]
- Kanvah S, Joseph J, Schuster GB, Barnett RN, Cleveland CL, Landman U 2010. Oxidation of DNA: Damage to nucleobases. Acc Chem Res 43: 280–287 [DOI] [PubMed] [Google Scholar]
- Kong H, Lin LF, Porter N, Stickel S, Byrd D, Posfai J, Roberts RJ 2000. Functional analysis of putative restriction-modification system genes in the Helicobacter pylori J99 genome. Nucleic Acids Res 28: 3216–3223 [DOI] [PMC free article] [PubMed] [Google Scholar]
- Korlach J, Bjornson KP, Chaudhuri BP, Cicero RL, Flusberg BA, Gray JJ, Holden D, Saxena R, Wegener J, Turner SW 2010. Real-time DNA sequencing from single polymerase molecules. Methods Enzymol 472: 431–455 [DOI] [PubMed] [Google Scholar]
- Krzywinski M, Schein J, Birol I, Connors J, Gascoyne R, Horsman D, Jones SJ, Marra MA 2009. Circos: An information aesthetic for comparative genomics. Genome Res 19: 1639–1645 [DOI] [PMC free article] [PubMed] [Google Scholar]
- Levene MJ, Korlach J, Turner SW, Foquet M, Craighead HG, Webb WW 2003. Zero-mode waveguides for single-molecule analysis at high concentrations. Science 299: 682–686 [DOI] [PubMed] [Google Scholar]
- Lu T, Pan Y, Kao SY, Li C, Kohane I, Chan J, Yankner BA 2004. Gene regulation and DNA damage in the ageing human brain. Nature 429: 883–891 [DOI] [PubMed] [Google Scholar]
- Manrao EA, Derrington IM, Laszlo AH, Langford KW, Hopper MK, Gillgren N, Pavlenok M, Niederweis M, Gundlach JH 2012. Reading DNA at single-nucleotide resolution with a mutant MspA nanopore and phi29 DNA polymerase. Nat Biotechnol 30: 349–353 [DOI] [PMC free article] [PubMed] [Google Scholar]
- Qin J, Li R, Raes J, Arumugam M, Burgdorf KS, Manichanh C, Nielsen T, Pons N, Levenez F, Yamada T, et al. 2010. A human gut microbial gene catalogue established by metagenomic sequencing. Nature 464: 59–65 [DOI] [PMC free article] [PubMed] [Google Scholar]
- Rasko DA, Webster DR, Sahl JW, Bashir A, Boisen N, Scheutz F, Paxinos EE, Sebra R, Chin CS, Iliopoulos D, et al. 2011. Origins of the E. coli strain causing an outbreak of hemolytic-uremic syndrome in Germany. N Engl J Med 365: 709–717 [DOI] [PMC free article] [PubMed] [Google Scholar]
- Saxowsky TT, Meadows KL, Klungland A, Doetsch PW 2008. 8-Oxoguanine-mediated transcriptional mutagenesis causes Ras activation in mammalian cells. Proc Natl Acad Sci 105: 18877–18882 [DOI] [PMC free article] [PubMed] [Google Scholar]
- Schadt EE, Turner S, Kasarskis A 2010. A window into third-generation sequencing. Hum Mol Genet 19: R227–R240 [DOI] [PubMed] [Google Scholar]
- Shendure J, Ji H 2008. Next-generation DNA sequencing. Nat Biotechnol 26: 1135–1145 [DOI] [PubMed] [Google Scholar]
- Strauss WM 2001. Preparation of genomic DNA from mammalian tissue. Curr Protoc Mol Biol 42: 2.2.1–2.2.3 [DOI] [PubMed] [Google Scholar]
- Travers KJ, Chin CS, Rank DR, Eid JS, Turner SW 2010. A flexible and efficient template format for circular consensus sequencing and SNP detection. Nucleic Acids Res 38: e159 doi: 10.1093/nar/gkg543 [DOI] [PMC free article] [PubMed] [Google Scholar]
- van Bakel H, Nislow C, Blencowe BJ, Hughes TR 2010. Most “dark matter” transcripts are associated with known genes. PLoS Biol 8: e1000371 doi: 10.1371/journal.pbio.1000371 [DOI] [PMC free article] [PubMed] [Google Scholar]
- Wall PK, Leebens-Mack J, Chanderbali AS, Barakat A, Wolcott E, Liang H, Landherr L, Tomsho LP, Hu Y, Carlson JE, et al. 2009. Comparison of next generation sequencing technologies for transcriptome characterization. BMC Genomics 10: 347 doi: 10.1186/1471-2164-10-347 [DOI] [PMC free article] [PubMed] [Google Scholar]
- Wheeler DA, Srinivasan M, Egholm M, Shen Y, Chen L, McGuire A, He W, Chen YJ, Makhijani V, Roth GT, et al. 2008. The complete genome of an individual by massively parallel DNA sequencing. Nature 452: 872–876 [DOI] [PubMed] [Google Scholar]