

Abstract
We create a new assembly of the Drosophila simulans genome using 142 million paired short-read sequences and previously published data for strain w501. Our assembly represents a higher-quality genomic sequence with greater coverage, fewer misassemblies, and, by several indexes, fewer sequence errors. Evolutionary analysis of this genome reference sequence reveals interesting patterns of lineage-specific divergence that are different from those previously reported. Specifically, we find that Drosophila melanogaster evolves faster than D. simulans at all annotated classes of sites, including putatively neutrally evolving sites found in minimal introns. While this may be partly explained by a higher mutation rate in D. melanogaster, we also find significant heterogeneity in rates of evolution across classes of sites, consistent with historical differences in the effective population size for the two species. Also contrary to previous findings, we find that the X chromosome is evolving significantly faster than autosomes for nonsynonymous and most noncoding DNA sites and significantly slower for synonymous sites. The absence of a X/A difference for putatively neutral sites and the robustness of the pattern to Gene Ontology and sex-biased expression suggest that partly recessive beneficial mutations may comprise a substantial fraction of noncoding DNA divergence observed between species. Our results have more general implications for the interpretation of evolutionary analyses of genomes of different quality.
The completion of genomes for an increasing number of eukaryotic species promises unprecedented power to distinguish among models of genome evolution. Population genetic theory predicts that the amount of divergence along a species lineage should depend on the mutation rate, the strength and mode of natural selection, and the species effective population size (Ne), as well as the genomic context such as sex linkage, recombination rate, and other factors (Kimura 1983; Charlesworth et al. 1987, 2009). How these factors ultimately contribute to observed patterns of genome evolution is an empirical question that has been the subject of intense investigation in population genetics for the past several decades (Charlesworth 2010).
Studies of Drosophila, particularly Drosophila melanogaster and its close relatives, have historically been at the forefront of such investigations. Ohta (1993) first raised the point that the protein alcohol dehydrogenase evolves more quickly in Hawaiian Drosophila than other Drosophilids, consistent with a reduction in the efficacy of purifying selection on weakly deleterious amino acid substitutions associated with smaller Ne in this species. Ohta also noted elevated rates of protein evolution in primates and rodents, again, consistent with smaller Ne in these species than in many Drosophilids. Using a larger collection of genes, Akashi (1995, 1996) showed that rates of synonymous and nonsynonymous substitution are higher in the D. melanogaster lineage relative to the Drosophila simulans lineage, consistent with a historically smaller Ne and concomitantly relaxed selection on slightly deleterious mutations at these sites in D. melanogaster (Aquadro et al. 1988; Moriyama and Powell 1996).
Since these seminal studies, numerous follow-up studies on Drosophila and other species have tested the relationship between population size, genomic context (i.e., recombination rate and sex linkage), and lineage-specific rates of evolution. Broadly speaking, these studies have found patterns that are consistent with the nearly neutral evolution view with respect to lineage-specific rates of evolution and effects of chromosomal context (Wright and Andolfatto 2008; Charlesworth et al. 2009; Mank et al. 2010). However, there are exceptions, and recent studies based on genome-wide analyses suggest a more complex picture. For example, in the first genome-wide comparison of the D. melanogaster and D. simulans lineages, Begun et al. (2007) found significantly greater levels of divergence for nonsynonymous, synonymous and 5′ untranslated region (UTR) sites in the D. melanogaster lineage, but the opposite pattern for introns, intergenic, and 3′-UTR regions. This finding is unexpected given the “smaller Ne in D. melanogaster” interpretation for the differential accumulation of synonymous and nonsynonymous substitutions in the two lineages. Since introns, intergenic, and 3′-UTR regions, like 5′ UTRs, nonsynonymous, and synonymous sites are all subject to purifying selection in both D. melanogaster and D. simulans (Andolfatto 2005; Haddrill et al. 2008), we expect asymmetric levels of divergence in the two lineages in the same direction, albeit to different extents.
Likewise, previous analyses comparing rates of evolution on the X versus the autosomes have also revealed complex patterns. If most of genome evolution is due to the accumulation of neutral and slightly deleterious variants that are at least partially recessive, we expect that the X chromosome will evolve more slowly than the autosomes, while the opposite pattern is expected if a large fraction of genome evolution is due to partly recessive beneficial substitutions (Charlesworth et al. 1987). In this context, Begun et al. (2007) found some evidence that the X evolves faster than autosomes in the two species; however, the detailed pattern was complex. For example, the pattern appears to be inconsistent in the two species lineages, with X-linked intronic and intergenic regions evolving significantly slower than autosomes in D. melanogaster, but at the same rate or significantly faster in D. simulans (see Table S3 of Begun et al. 2007).
One is left wondering about the cause of these complex patterns of divergence among different annotations of sites and chromosomal contexts. In one sense, they are perhaps not surprising given the plurality of population genetic processes, with models of negative and positive selection predicting effects in opposing directions. Other factors, such as differences in mutation rate, may also play a role. For example, Begun et al. (2007) cite hypertranscription of genes on the X, associated with dosage compensation, as possibly elevating mutation rates on the X chromosome (although this seems at odds with their finding of a significantly slower X for introns in D. melanogaster).
Differences in patterns of divergence in the D. melanogaster and D. simulans lineages suggest potentially interesting differences in biology between the species. However, a possible concern in overinterpreting such analyses is the quality of the D. simulans genome reference sequence relative to that of D. melanogaster. In particular, the D. simulans assembly represents a composite of six independently derived strains, each with only partial coverage of the genome (Begun et al. 2007). Even when combined, the D. simulans genome has the lowest Q20 coverage (number of assembled reads with an average quality score of 20) of the initial 12 sequenced Drosophila genomes (Drosophila 12 Genomes Consortium et al. 2007). The D. simulans reference genome is also represented in 10,005 scaffolds, with the assembly of the six major chromosome arms (X, 2L, 2R, 3L, 3R, and 4) containing just 101.3 Mb of the expected 137.8 Mb (based on the D. melanogaster reference genome). In addition, genomic DNA from a mixture of males and females was sequenced, implying that the X chromosome has lower coverage on average than the autosomes (since there will be three copies of the X chromosome for every four copies of the autosomes). The difference in coverage between the X and autosomes makes a quantitative comparison of rates of evolution on these chromosomes difficult. Finally, a recent linkage analysis based validation of the D. simulans genome revealed several major misassemblies in the D. simulans genome (Andolfatto et al. 2011a).
To address concerns regarding quality and completeness of the D. simulans genome, we have created a new assembly by combining high-coverage Illumina short-read sequence data with previously published Sanger sequence data from a single strain. By sequencing females, we effectively balance sequence coverage between the X and autosomes. Using this improved sequence, we revisit analyses of genome-wide divergence along the D. melanogaster and D. simulans lineages and document some surprising differences with previous analyses. In particular, we find consistently higher rates of divergence along the D. melanogaster lineage for all types of sites, including the putatively neutral “fastest-evolving sites” of short introns, implying that all such sites are under weak purifying selection or a higher mutation rate in the D. melanogaster lineage. In addition, in both D. melanogaster and D. simulans, we find faster-X divergence at nonsynonymous, introns longer than 100 bp, and UTR sites, but not other sites, consistent with recessivity of positively selected mutations or a different composition of genes on the X chromosome and autosomes. We discuss the implications of our findings in the context of ongoing low-coverage genome sequencing projects and how coverage and quality ultimately affect the reliability of evolutionary inferences in comparative genomic studies.
Results
Sequencing and assembly
We created a de novo assembly of the D. simulans genome by combining new sequence data (142 million 104-bp and 101-bp paired-end Illumina reads) with previously published Sanger sequence data for strain w501 (Supplemental Table 1) using the Velvet assembler (Zerbino and Birney 2008). Our de novo assembly comprises 21,613 contigs totaling 124.2 Mb with an N50 of 150 kb (Supplemental Table 2), a considerable improvement over the previous assembly's N50 of 17 kb (Drosophila 12 Genomes Consortium et al. 2007). It is generally expected that repetitive DNA should limit the efficiency of de novo assembly (Treangen and Salzberg 2012). We find that our 500-bp insert libraries, combined with the published 3-kb insert paired-end Sanger data, is sufficient to assemble contigs despite the presence of (albeit small) internal repetitive elements (Supplemental Figs. 1, 2). An estimated 6.85% of our assembly corresponds to annotated transposons in D. melanogaster (see Methods), where most of the contigs containing transposable elements are dominated by contigs smaller than 500 bp (Supplemental Fig. 1B). This said, a repetitive element was found within 500 bp of the end in only 7% of contigs >3 kb, and of this set, 58% had an element at both ends. Thus, transposable elements do not appear to be a major factor limiting our assembly of larger contigs.
We assembled Velvet contigs into scaffolds using the D. melanogaster reference sequence as a guide (see Methods). A schematic of this approach is shown in Supplemental Figure 3. A total of 2156 contigs map uniquely to the D. melanogaster reference genome and the final assembly of chromosomes X, 2, 3, 4, and the mtDNA genome totals 118.5 Mb (Table 1). This represents 95.4% of the expected genome size based on the sum of contig lengths generated by the Velvet assembly. Read depth across the entire assembly centers around 75× with comparable sequence coverage between the X and autosomes (Supplemental Fig. 4; Supplemental Table 3). An additional 19,596 contigs (totaling 8.3 Mb) remain unassembled and correspond primarily to repetitive regions and/or unassembled regions of the D. melanogaster reference assembly. We fail to uniquely map Velvet contigs to 3.15% (3,580,129 bp) of a “TE-minimized” version of the D. melanogaster reference genome (see Methods). These regions in the D. melanogaster reference genome generally corresponded to repetitive or low complexity regions where determining the uniqueness of mapped Velvet contigs was difficult.
Table 1.
Assembled chromosome size (non-N base pairs)

Of the 13,717 annotated genes in D. melanogaster, orthologs were determined for 13,281 genes (96.8%) in our D. simulans assembly. Relative to D. melanogaster, we detected 35 transposition events between chromosome arms (ICT) and 374 putative local rearrangement (LR) events in our assembly (Supplemental Table 4). When incorporating Drosophila yakuba, the number of orthologs found in all three species reduces to 12,747 genes (92.9% of D. melanogaster genes). From this subset, rates of evolution along the D. melanogaster and D. simulans lineages are measured relative to a reconstructed ancestor (see Methods).
Comparing D. simulans assemblies
Our assembly (hereafter Dsimw501) offers significant improvements over the previous assembly (hereafter Dsimref) (Begun et al. 2007; Drosophila 12 Genomes Consortium et al. 2007) in several fundamental ways that are crucial to confidence in genome sequence accuracy. First, we effectively increase the assembly length across all chromosome arms by ∼17% on average (Supplemental Fig. 5; Table 1). The largest improvement in sequence content over Dsimref is for the X chromosome. In particular, our assembly produces an additional 6.41 Mb on the X chromosome, which is 44% larger than Dsimref (Table 1). A pairwise dotplot comparing Dsimw501 to the D. melanogaster and Dsimref assemblies reveals that these gains are widely dispersed across the X chromosome rather than localized to a few regions (Fig. 1). The substantial increase in coverage of the X chromosome translates to a 17% gain in the total number of full-length orthologous gene matches (Supplemental Table 5). We also see particularly large gains in the assembly length compared with Dsimref on chromosome 4. Like the X, the additional coverage is widely dispersed rather than localized (see the inset of Supplemental Fig. 5). Second, Dsimw501 contains fewer misassembled regions than Dsimref (Supplemental Table 6), and our assembly properly conforms with the inferred genetic ordering of markers (Supplemental Fig. 6), at the level of resolution permitted by previously published linkage data (Andolfatto et al. 2011a). In particular, several large misassemblies detected using genetic linkage patterns and compiled from the GFF (Gene Format File) for Dsimref (see Tables S9.1 and S9.2 of Andolfatto et al. 2011a) are not detected in Dsimw501 (Supplemental Table 6). In addition, we detect an inversion on the X chromosome (X:13361146–13723239) in Dsimref relative to our assembly (Dsimw501) that is also not found in D. melanogaster (Fig. 1). Support from paired-end reads at both putative breakpoints suggest that this inversion is the result of a misassembly in Dsimref.
Figure 1.

Dotplot for chromosomes X (A) and 3L (B) comparing our assembly to that of D. melanogaster (light gray) and D. simulans reference assembly (dark gray) (Begun et al. 2007). An inversion on the X (circled) is an example of a misassembly detected in the Begun et al. (2007) D. simulans assembly spanning X:13361146–13723239.
Third, because Dsimref is a mosaic assembly of six inbred strains sequenced to relatively low coverage, we expect that Dsimw501 should contain fewer sequencing errors since it is based on high sequence coverage of a single inbred strain. By comparing orthologs of D. melanogaster protein-coding genes between the two D. simulans assemblies (see Methods), we find that Dsimw501 contains fewer predicted proteins with frameshift mutations (6.6% vs. 20.6%) and premature stop codons (4.0% vs. 5.9%) while containing more informative non-N codons (6,322,536 vs. 5,698,459) and a greater proportion of genes with intact start and stop codons (94.1% vs. 85.8%) (Fig. 2; Supplemental Table 5). The high fraction of D. simulans orthologs with frameshifts in both assemblies represents difficulties in creating multiple sequence alignments that preserve proper gene structure (intron–exon boundaries) in all three species. Because site classification by annotation is with respect to the D. melanogaster annotation, we find a similarly high fraction of frameshifts in the D. yakuba ortholog (14.2% using Dsimw501 and 13.9% using Dsimref). Furthermore, while the fraction of genes with a premature stop codon in Dsimw501 is similar with respect to that found in the D. yakuba ortholog (4.0% vs. 3.8%), an increase is found in Dsimref (4.9% vs. 3.7%). The reduced number of inferred frameshifts and premature stop codons using the D. melanogaster annotation point to higher sequence quality in Dsimw501.
Figure 2.

Sequence quality metrics by gene. The number of D. simulans orthologs for which the amount of informative non-N codons, frameshifts, and premature stop codons generated from Dsimref differs from Dsimw501 (in total, 11,053 genes are compared).
Analysis of Dsimw501 also results in systematically lower divergence estimates for the D. simulans lineage in comparison to Dsimref across all site classes, regardless of chromosomal context (Supplemental Fig. 9; Table 2). In Figure 3, we show that divergence measured using Dsimref is biased upward relative to Dsimw501 when divergence estimates differ for the D. simulans branch (i.e., estimates from Dsimref are more often greater than estimates from Dsimw501). In contrast, divergence estimates along the D. melanogaster lineage are not biased by the choice of D. simulans reference. These patterns suggest a systematic overestimation of the D. simulans branch length in analyses using Dsimref.
Table 2.
Lineage-specific divergence by annotation and chromosomal context in D. simulans and D. melanogaster
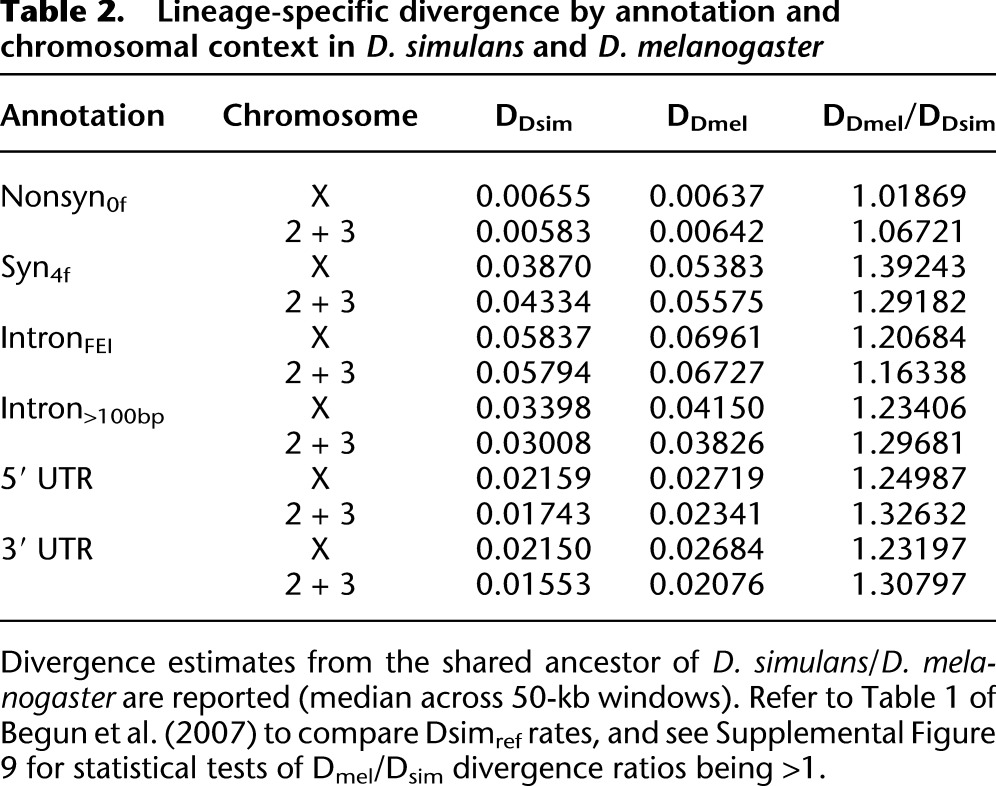
Figure 3.

Comparison of estimated lineage-specific divergence rates using the two D. simulans assemblies. The fraction of genes, by chromosome and site class, for which the estimated divergence rate per gene is different (greater or less than) depending on the D. simulans assembly used. Estimated rates for D. melanogaster are shown on top and D. simulans on bottom. (Right) The ratio of the number of genes for which the estimate from Dsimref > Dsimw501 relative to Dsimref < Dsimw501. Note that putatively neutral intronFEI sites correspond to bases 8–30 of introns shorter than 100 bp (Halligan and Keightley 2006; Parsch et al. 2010).
Finally, as an additional evaluation of quality, we consider the spatial clustering of amino acid substitutions in protein sequences (Callahan et al. 2011). In examining the spatial pattern of coding sequence substitutions within and between seven Drosophilid genomes, Callahan et al. (2011) found an excess of intralineage clustering of nonsynonymous substitutions over a physical scale of about 20 codons. Callahan et al. (2011) specifically identify D. simulans as an outlier in their analyses, citing the D. simulans reference sequence quality as a possible cause. In support of this claim, we show that the extent of intralineage spatial clustering found in Dsimw501 is similar to that found in the D. melanogaster lineage (Fig. 4), and D. simulans no longer remains an outlier with respect to the intralineage clustering excess (Fig. 4, inset).
Figure 4.

Comparison of intralineage and interlineage clustering of nonsynonymous substitutions. For all comparisons,  (the correlation in divergence between nonsynonymous substitutions) decreases with increasing distance separating two nonsynonymous substitutions, specific to the lineage from which the substitution arose (polarized), following Figure 4A of Callahan et al. (2011). The amount of intralineage clustering within D. simulans (red line) and D. melanogaster (blue line) relative to interlineage clustering (black line) is shown separately for the two D. simulans assemblies: Dsimref (A); Dsimw501 (B). The excess of intralineage relative to interlineage clustering in D. simulans is represented by the area between the red and blue curves for the first 20 codons [
 , shaded in gray]. Note that the same set of genes from both assemblies is analyzed, and D. simulans orthologs from either assembly containing a premature stop codon or non-start or stop codons are excluded. (B) Unlike the pattern from Dsimref, a similar amount of intralineage clustering is found in both the D. simulans and D. melanogaster lineages when using Dsimw501 (greater overlap between blue and red lines; shaded region in gray is smaller). The intralineage clustering excess
  relative to the extent of intralineage clustering
  is shown in the inset (following Fig. 4B of Callahan et al. 2011). A considerably larger intralineage clustering excess is found in the D. simulans lineage when using Dsimref, which is also circled in the inset.
Faster evolution in the D. melanogaster lineage
Table 2 and Figure 5 catalog rates of divergence along the D. melanogaster and D. simulans lineages for various site annotation categories. The rank order of rates of divergence across site annotation classes is the same in both D. melanogaster and D. simulans, consistent with previous findings; bases 8–30 of introns shorter than 100 bp (hereafter, intronFEI sites) evolve the fastest, and nonsynonymous sites the slowest (Halligan and Keightley 2006; Parsch et al. 2010). Based on levels of nucleotide diversity, D. simulans is predicted to have a somewhat larger historical Ne than that of D. melanogaster. As a result, rates of evolution are predicted to be faster along the D. melanogaster lineage due to the increased role of random genetic drift and corresponding lower efficacy of selection for species with smaller Ne. For the major autosomes (including only major arms 2L, 2R, 3L, and 3R for all subsequent analyses) and the X chromosome, we find that divergence along the D. melanogaster lineage is indeed faster than D. simulans across all annotated site classes, apparent in the distribution of rates of divergence across genes and nonoverlapping 50-kb windows (Fig. 5; Supplemental Fig. 9; Table 2).
Figure 5.

Boxplot distribution of lineage-specific divergence by gene across different site classes in autosomal (2 + 3) genes in D. simulans and D. melanogaster. For each site class, the top darker bar represents the distribution across D. simulans, and the bottom lighter bar for D. melanogaster (each gene must contain a minimum of 10 non-N sites for intronFEI sites and 100 otherwise). (*) The weighted average (based on the number of sites corresponding to the annotated class for each gene) across all genes. See also Table 2.
We note that intronFEI sites also evolve 16%–20% faster in the D. melanogaster lineage. Assuming that these sites are neutral, this raises the possibility that there may be a mutation rate difference between the two species. Such a difference in mutation rates need not involve a mutation rate difference per generation but may simply reflect a different average historical generation time for the two species. While differences in mutation rate may be a contributing factor to the generally higher divergence along the D. melanogaster lineage, the extent of the divergence excess varies significantly across site annotations (P = 7.34 × 10−52 for autosomes, P = 1.22 × 10⁻¹² for the X; Kruskal-Wallis test), suggesting that between-lineage mutation rate differences alone cannot fully account for the acceleration in the D. melanogaster lineage.
Heterogeneity in levels of divergence across site annotation classes would be expected if the two species differed in Ne and thus were subject to different intensities of selective constraint (see Discussion). Assuming that intronFEI sites are neutral, we can quantify constraint across site classes as 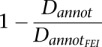 . For both noncoding and synonymous sites, we find that constraint is stronger in D. simulans on the autosomes, while this trend is weaker on the X chromosome (P > 0.02 for X, P < 1 × 10⁻⁵ for autosomes; Sign Test). Interestingly, however, we find the reverse pattern for nonsynonymous sites, where constraint is instead significantly higher in D. melanogaster (P = 0.005 for X, P = 0.0026 for autosomes; Sign Test). Assuming that intronFEI sites are, indeed, neutral, the discord among site annotations is inconsistent with a model that posits that most divergence is neutral or slightly deleterious. This implies that either positive selection contributes substantially to divergence or that intronFEI sites themselves are constrained and subject to different intensities of selection in the D. melanogaster and D. simulans lineages.
X versus autosome evolution
Comparing divergence rates between the X chromosome and autosomes provides an opportunity to examine the nature of newly arising mutations and the substitutions that accumulate between species (Charlesworth et al. 1987). Because the rate of neutral evolution is solely dependent on the mutation rate, the X should evolve at the same rate as the autosomes at neutral sites, assuming that mutation rates are equal. However, due to hemizygosity in males, all newly arising non-neutral mutations on the X, including those that are recessive, are exposed to natural selection (assuming that selection is not female specific). As a result, if a substantial fraction of newly arising non-neutral mutations is partly recessive, the X is expected to fix more beneficial substitutions than autosomes (the “faster-X” effect), and the converse pattern (i.e., a “slower-X”) is expected for detrimental substitutions. The net effect on rates of evolution for the X versus the autosomes depends on a balance between the fraction of substitutions accumulating between species that are beneficial, neutral, and detrimental.
Notably, the X/A (X-to-autosome) ratio is close to unity for intronFEI sites, which have been proposed to be close to a neutrally evolving class of sites in the D. melanogaster genome (Halligan and Keightley 2006; Parsch et al. 2010). A priori, we expect that sites under pervasive negative selection (i.e., most sites in the Drosophila genome) (Andolfatto 2005; Halligan and Keightley 2006; Haddrill et al. 2008) should accumulate substitutions more slowly on the X, due to the more efficient selection expected on this chromosome. Contrary to this expectation, we find strong evidence for faster-X divergence among 5′ and 3′ UTRs, intron >100 sites, and faster-X divergence at nonsynonymous sites in both D. simulans and D. melanogaster (Fig. 6; Table 2; Supplemental Table 7). The faster-X pattern for these site classes is consistent with the more frequent fixation of beneficial mutations arising on the X chromosome, where a large fraction of the UTR, intron, and nonsynonymous divergence (i.e., >50%) along the D. simulans and D. melanogaster lineages is inferred to be the product of positive selection (Andolfatto 2005; Haddrill et al. 2008). While a faster-X seems apparent for many site classes, we conversely find evidence for a slower-X at synonymous sites, where a large fraction of the divergence accumulating at synonymous sites in the two species is instead inferred to be weakly detrimental (Supplemental Table 9; Akashi 1995; Begun 2001). Of note, the dramatic discrepancy in rates of evolution on the X and autosomes (Fig. 6) is not apparent when comparing between autosomes 2 and 3 (Supplemental Fig. 11; Supplemental Table 8).
Figure 6.

X/autosome divergence ratio in D. simulans and D. melanogaster. The X/A divergence ratio is expected to be unity assuming that the X and autosomes have the same effective population size in the ancestor of these species. In support of this, synonymous nucleotide diversities on the X and autosomes are approximately equal in African populations of both species (Andolfatto 2001). The distribution for X/autosome divergence ratios reflects 10,000 bootstrap samples with replacement by gene across the various site classes, separately for genes on the X and autosomes. Refer to Supplemental Table 7 for bootstrap P-values.
Interestingly, the magnitude of the bias in the X/A ratio appears more pronounced in D. simulans relative to D. melanogaster across all site classes, and the two distributions are significantly different (Fig. 6, P < 2.2 × 10⁻¹⁶ for all site classes; Wilcoxon Test, unpaired). The “faster” faster-X pattern in D. simulans suggests that a larger proportion of newly arising mutations are beneficial in D. simulans (as weaker purifying selection in the D. simulans lineage seems less likely). On the other hand, the “slower” slower-X pattern for synonymous sites in D. simulans conforms with expectations of stronger codon usage bias reported in D. simulans than D. melanogaster (Akashi 1995; Akashi and Schaeffer 1997; McVean and Vieira 2001; Nielsen et al. 2007; Andolfatto et al. 2011b).
While it is tempting to interpret differences in rates of evolution on the X and autosomes in the context of the dominance/recessivity of newly arising mutations, this phenomenon does not preclude alternative explanations (Vicoso and Charlesworth 2006). In particular, the same pattern could arise simply from differences in gene composition on the X versus the autosomes (i.e., the “different X” hypothesis). To evaluate the “different X” explanation for differential rates of divergence on the X versus autosomes, we carried out an ANOVA analysis that incorporates Gene Ontology (GO) as a factor (see Methods). We find that GO is a significant predictor of rates of divergence across all classes of sites (Supplemental Table 10). Interestingly, the trend toward a faster-X at nonsynonymous sites in D. simulans and D. melanogaster (Fig. 6; Supplemental Table 7) is no longer significant when accounting for GO category (Supplemental Table 10). This suggests that a large part of the faster-X effect for nonsynonymous sites may be explained solely by differences in gene composition on the X and autosomes. Notably, we find no effect of chromosome 2 linkage when restricting the analysis to autosomes, suggesting the X–autosome difference is distinct from more general genomic heterogeneity due to GO category (Supplemental Table 12). This said, X-linkage is still a significant predictor of divergence at synonymous and noncoding sites even after accounting for GO category, suggesting that the differences in gene composition cannot fully account for X–autosome differences (Supplemental Table 10).
Related to the possibility of gene composition differences discussed above is the issue of differences in gene expression patterns between males and females for genes on the X and autosomes. Controlling for sex-biased expression patterns is particularly interesting because the X chromosome is deficient in male-biased genes (Sturgill et al. 2007; Zhang et al. 2007). Since proteins with male-biased expression tend to evolve faster (Zhang et al. 2007), this could obscure a faster-X effect due to recessive beneficial substitutions at nonsynonymous sites. To evaluate this possibility, we performed an ANOVA analysis incorporating sex-biased expression data measured in D. melanogaster (Gnad and Parsch 2006) (see Methods). In general, we find that sex-biased expression is a significant predictor of rates of divergence across most classes of sites in both lineages (Supplemental Table 11). Interestingly, however, we find that even after accounting for sex-biased expression patterns, X-linkage remains a significant factor predicting rates of divergence at most classes of nonintronic sites in both species (Supplemental Table 11). Similar to the GO analysis (above), restricting the analysis to autosomes fails to reveal any significant effect of chromosome 2 linkage, suggesting that X-autosome differences are distinct from more general genomic heterogeneity correlated with sex-biased expression patterns (Supplemental Table 13).
Discussion
The first genome-wide study comparing rates of evolution between D. melanogaster and D. simulans was based on a mixed-sex, multiple-strain, low-coverage genome assembly of D. simulans versus the D. melanogaster reference assembly (Begun et al. 2007). That analysis revealed several complex patterns of lineage-specific divergence that were difficult to interpret in the context of population genetic models that considered the effects of differences in Ne and genomic context. When comparing genomes of species that differ in sequence coverage and quality, complicated and unreliable patterns may emerge specific to the species whose genome sequence suffers from lower quality. In particular, we expect that divergence will generally be overestimated for the species with lower genome quality. Sequence errors may be particularly problematic when the evolutionary distance between the studied species is small, such that the proportion of the divergence they represent will be larger. Similarly, one might be apprehensive of overinterpreting patterns that emerge from intragenomic studies where sequence coverage and quality differ between chromosomes, such as those examining the evolutionary consequences of chromosomal context.
To address these concerns, we created an improved version of the D. simulans genome that is based on high coverage of a single strain and, by sequencing females only, has close to equal coverage on the X and autosomes. By several metrics, our efforts have resulted in an assembly with fewer sequence and assembly errors than the previous D. simulans reference assembly. The scaffolding of our genome assembly was guided by the D. melanogaster genome reference and is expected to be biased by this (particularly in terms of unique genomic content). However, we expect that gains from an independent assembly of contigs would mostly lie in heterochromatic regions, and these regions would not contribute much to the evolutionary analysis because they would also be difficult to align between species due to their repetitive nature. Our evolutionary analysis is also limited by the number of full-length orthologs found in the D. yakuba genome reference, and improvements to the D. yakuba genome could increase the total number of gene orthologs analyzed. While our assembly greatly reduces the number of frameshifts and premature stop codons compared with the previous assembly, we note that this issue still affects almost 9% of gene alignments (and were excluded from further analyses). This may in large part be caused by our reliance on gene structure annotations defined in D. melanogaster, an issue common to evolutionary comparisons to model organisms. This problem could be remedied to some extent by a community effort to independently annotate D. simulans and D. yakuba, which would allow for more independent comparisons of orthologs in the three species.
Caveats aside, our analyses reveal a different portrait of lineage-specific divergence patterns in D. melanogaster and D. simulans than the analysis of the original D. simulans assembly (Begun et al. 2007). Differences in the pattern of lineage-specific divergence in two species can be interpreted through theoretical predictions of population genetic models that consider the dynamics of slightly deleterious mutations in the context of differences in Ne (Ohta 1973; Charlesworth et al. 1993; Akashi 1995; Charlesworth 2009). In particular, the fate of slightly deleterious mutations occurring in species with large Ne is predicted to be more efficiently removed by natural selection, whereas in species with smaller Ne, a larger fraction of these mutations can instead be fixed by random genetic drift. Of the two species, D. simulans is believed to have had the historically larger Ne based on comparisons of levels of nucleotide diversity and from patterns of codon usage bias (Aquadro et al. 1988; Akashi 1995; Moriyama and Powell 1996; Andolfatto 2001; Andolfatto et al. 2011b). Our finding of generally lower rates of divergence in D. simulans is broadly consistent with this view. Moreover, a difference in Ne between the two species is also supported by our finding of significant heterogeneity across site classes in the extent to which D. melanogaster evolves faster than D. simulans. Our interpretation of this pattern is that, because the distribution of fitness effects of newly arising mutations varies among annotation site classes (Eyre-Walker and Keightley 2007), we therefore expect the fraction of sites subject to nearly neutral dynamics to similarly differ across site class (with the largest fraction expected for synonymous and potentially intronFEI sites, if the latter are also nearly neutral).
This said, we have also shown that intronFEI sites, believed to be close to neutrally evolving (Halligan and Keightley 2006; Parsch et al. 2010), exhibit faster rates of divergence in the D. melanogaster lineage. One possible explanation for this pattern is a difference in mutation rate in the D. melanogaster and D. simulans lineages, perhaps as the result of a subtle difference in average generation time. However, by assessing levels of “constraint” at nonsynonymous sites using intronFEI sites as a neutral reference, we find that constraint at nonsynonymous sites is instead higher in D. melanogaster than in D. simulans. In other words, while divergence is greater in D. melanogaster for both nonsynonymous sites and intronFEI sites, the ratio of rates at nonsynonymous relative to intronFEI sites is smaller than in the D. simulans lineage. From the perspective that most of genome evolution is due to the accumulation of neutral and slightly deleterious mutations, this suggests that intronFEI sites themselves may be subject to weak purifying selection at the nucleotide level, and that the intensity of this selection is weaker in D. melanogaster. This finding is not actually inconsistent with current analyses of polymorphism data to date, which has so far been restricted to a small sample of genomic regions surveyed in D. melanogaster (Parsch et al. 2010).
An alternative, although not mutually exclusive, explanation is that a substantial fraction of lineage-specific divergence is the product of positive selection. In fact, several studies based on an analysis of polymorphisms and divergence have suggested that a large fraction of divergence in the D. melanogaster and D. simulans lineages, particularly at nonsynonymous sites, is in excess of neutral expectations (Fay et al. 2002; Smith and Eyre-Walker 2002; Haddrill et al. 2008; Andolfatto et al. 2011b; Wilson et al. 2011). If this divergence excess is the product of recurrent positive selection, we expect more rapid evolution (and correspondingly less constraint) in D. simulans if it indeed has had a larger Ne. Faster rates of nonsynonymous substitution in D. simulans, particularly on the X, may also reflect a difference in the beneficial mutation rate in the two species. Interestingly, Wilson et al. (2011) estimate that the rate of newly arising nonsynonymous mutations that are moderately to strongly beneficial is almost threefold higher in D. simulans than in D. melanogaster.
Importantly, our assembly allows for a more quantitative comparison between rates of evolution on the X chromosome versus the autosomes. In contrast to the study of Begun et al. (2007, see their Table S3), we find that the X chromosome evolves significantly faster than autosomes for most noncoding sites and significantly slower for synonymous sites in both species. Notably, we find that the X/autosomes ratio for intronFEI sites is close to 1 in both species, and synonymous sites evolve slower on the X relative to autosomes (Fig. 6). Begun et al. (2007) note that hypertranscription of the X in males may contribute to an elevated mutation rate. However, since both intronFEI and synonymous sites are transcribed on the X, the hypertranscription-associated mutation rate increase on the X explanation seems less plausible in explaining the faster-X pattern. Consequently, the faster-X pattern is more likely explained by population genetic models invoking selection. Several previous studies have interpreted the faster-X pattern as reflecting an accumulation of recessive beneficial mutations on the X relative to autosomes, due to more efficient positive selection in males (Vicoso and Charlesworth 2006). By considering the effects of Gene Ontology and sex-biased expression, we conclude that the trend toward a faster-X for nonsynonymous sites is likely to be largely explained by differences in gene composition on the X versus the autosomes. This said, GO category and sex-biased expression fail to account for the faster-X pattern observed at 3′ UTRs (or the slower-X for synonymous sites), although we have not explored all possible factors (e.g., expression level, breadth of expression, etc.).
Our results highlight the importance of genome quality on the quality of the evolutionary inferences that can be drawn from low coverage genomes. Among the 12 sequenced Drosophila genomes (Drosophila 12 Genomes Consortium et al. 2007), D. simulans had the lowest coverage (Q20 coverage 2.9); however, similar issues may plague analyses involving other low-coverage Drosophila genomes (e.g., Drosophila sechellia, Q20 coverage 4.9; and Drosophila persimilis, Q20 4.1). Our results also have implications for a large number of ongoing projects (e.g., the Genome 10K Project [http://www.genome10k.org]; the Drosophila Genetic Reference Panel [DGRP] [Mackay et al. 2012]; the Human 1000 Genomes Project [The 1000 Genomes Project Consortium 2010]; and the 1001 Genomes Project in Arabidopsis thaliana [Cao et al. 2011]) that aim to survey a large number of genomes at relatively low coverage or perform analyses comparing genomes or genomic regions that vary substantially in coverage. Our results also highlight how studies examining the evolutionary consequences of chromosomal context can depend on heterogeneity in coverage among genomic regions (in our case, X vs. autosome). Such concerns may also apply to analyses comparing high and low recombining and heterochromatic regions, if the latter are associated with lower coverage. Given that poor genome quality can both obscure interesting evolutionary patterns, as well as create spurious ones, we may stand to learn more from fewer deeply sequenced genomes than a large number of low-coverage genomes.
Methods
Sequencing and assembly
We constructed a standard Illumina paired-end genomic DNA library for D. simulans females of strain w501 following the manufacturer's instructions (http://www.illumina.com). Genomic DNA was isolated using standard protocols and sheared to a mean size of 500 bp using a Covaris sonicator. We collected 124 million paired-end 104-bp and 101-bp reads by running this library on two different sequencers (Supplemental Table 1). Before assembly, our Illumina reads were error-corrected using Quake (Kelley et al. 2010) with a k-mer of size 17. We combined these data with previously published Sanger sequence data (Begun et al. 2007) and created a de novo assembly using Velvet version 1.1.04 (Zerbino and Birney 2008). Due to limitations in Velvet, the 3-kb insert plasmid paired-end reads were run with the -longPaired option while all 40-kb insert fosmid reads were treated as single long reads (-long). Our best assembly used a k-mer of 65 (as determined by the VelvetOptimiser script) and comprised 21,613 contigs totaling 123,899,117 bp with an N50 of 150 kb (Supplemental Table 2).
Ordering and placement of Velvet contigs were determined first by MUMmer version 3.23 (nucmer and show-coords) (Kurtz et al. 2004) against a “TE-minimized” version of the D. melanogaster genome (FlyBase release r5.33), where all annotated transposable elements were excised (Supplemental Fig. 3). The reduced D. melanogaster genome totaled 113,815,635 bp across chromosomes X, 2L, 2R, 3L, 3R, and 4. The mtDNA was treated separately and assembled relative to the siII haplotype, based on similarity of Velvet contigs to each of the three D. simulans mtDNA haplotypes (GenBank accession numbers NC 005781, AF200845, AF200847) (Ballard 2000). To avoid complications with repetitive elements, nonuniquely mapping contigs and those engulfed by larger uniquely mapped contigs were set aside (unincorporated-contigs.fa). Three contigs appeared to be chimeric and were split apart and reincorporated separately. The final ordered set of 2156 contigs were stitched together with a 100-bp buffer of Ns. We visually inspected the placement and ordering of contigs, against the D. melanogaster, D. simulans, and D. yakuba reference genomes (FlyBase versions r5.33, r1.3 and r1.3) with MUMmer (Kurtz et al. 2004). Following the stitching of ordered contigs, we mapped all uncorrected reads against this initial assembly with BWA (Li et al. 2009) for the Illumina short reads and Sanger unpaired long reads and SSAHA2 version 2.5.4 (Ning et al. 2001) for the Sanger paired long reads. Inspection of the mapped reads was summarized by creating a vcf file with samtools mpileup and bcftools version 0.1.18 (Li et al. 2009). The assembly was then updated with single-nucleotide and insertion/deletion variants (Q20 for substitutions and 50 for indels) using the vcfutils.pl vcf2fq tool from SAMtools. Three iterations of assembly updating by remapping of reads resulted in minor improvements in the total number of paired-reads mapped.
Transposable elements
A total of 5142 (of 5425) annotated transposons in D. melanogaster had at least one BLAT match (tblatx) (Kent 2002) to at least one of 10,484 contigs (Supplemental Fig. 1A). The total sequence across all contigs that matched transposable elements was 6.85% of the total assembly length. Full-length transposon matches to contigs were biased toward short transposons. With respect to TE presence among contigs of varying lengths, we found that most contigs ≤500 bp fully resembled D. melanogaster transposons in comparison to larger contigs (Supplemental Fig. 1B). For the larger contigs, repetitive elements did not appear to be the only factor limiting the assembly because their presence is not biased toward the ends of contigs (Supplemental Fig. 2).
D. melanogaster–D. simulans–D. yakuba gene alignments
Because gene structures are better annotated in the D. melanogaster reference assembly, we transferred gene annotations from the D. melanogaster genome to both D. simulans and D. yakuba through multiple sequence alignments containing all three orthologs. Each protein-coding gene in D. melanogaster (FlyBase release r5.33, dmel-all-gene-r5.33.fasta) was first BLAT-ed (Kent 2002) against both D. simulans assemblies and the D. yakuba assembly (FlyBase version r1.3) to identify putative orthologs. Chromosome 4 was generally excluded from autosome analysis due to low gene content. We only examined gene alignments where all orthologs were <50,000 bp (to avoid memory complications with multiple sequence alignment programs) and spanned at least 50% of the D. melanogaster transcript. The resulting BLAT hits were filtered to identify the best and unique hit (based on longest and highest percent sequence identity).
In an effort to preserve the CDS-exon structure as dictated by the D. melanogaster annotation, we aligned the entire D. melanogaster transcript with both D. simulans and D. yakuba BLAT hits with FSA version 1.15.6 with the refalign, exonerate, and soft-masked parameters enabled (Bradley et al. 2009) followed by a profile alignment with a padded CDS sequence representing the union of coding regions across all D. melanogaster isoforms using a profile alignment with MUSCLE v3.8.31 (Edgar 2004). We converted out-of-frame deletions (with respect to the D. melanogaster annotation) whose lengths are multiples of 3 into full codon deletions by repositioning the bases corresponding to the disrupted codon relative to the first aligned codon position in the resulting multiple sequence alignment.
For our analyses, we created a set of genes for which we have higher confidence that the gene structure is the same in all three species. To do this, we ensured that alignments are free of premature stop codons and frameshifts in the D. simulans sequence. The restriction was not extended to D. yakuba since we are only interested in rates of evolution in the D. melanogaster and D. simulans branches and only rely on D. yakuba to reconstruct the ancestral state. From the resulting D. simulans–D. melanogaster–D. yakuba multiple sequence alignment, the ancestor corresponding to D. simulans–D. melanogaster was reconstructed separately for coding (codeml; RateAncestor=2, model=1) and noncoding (baseml; RateAncestor=2, model=4) regions using PAML version 4.4c (Yang 2007). The final number of protein-coding genes analyzed is reported in Supplemental Table 5.
For each protein-coding gene, we select the isoform with the highest content of protein-coding sites. For regions overlapped by other isoforms and/or genes, we classify each site according to the following hierarchy: intronFEI, intron>100, 5′ UTR, 3′ UTR, followed by CDS (highest). Thus, if a site resides in an intron>100 in one gene and CDS for another, the site is classified as CDS. For gene-based analyses, we use all sites corresponding to each site class that are within the boundaries of the gene. For window-based analyses, we exclude genes spanning multiple windows and require a minimum of 100 sites for which the ancestral state was reconstructed for all annotations analyzed with the exception of intronFEI sites, where we require a minimum of 10 sites.
Evolutionary analyses
After all sites are partitioned into the above annotation categories, all evolutionary analyses are performed with Polymorphorama (Haddrill et al. 2008). Counts of nonsynonymous (nondegenerate) and synonymous (fourfold) sites and the classification of nonsynonymous, synonymous, and P/U codon substitutions are performed with Polymorphorama. Preferred/unpreferred codons are classified based on the codon preference table from Vicario et al. (2007). To correct for multiple hits, we report divergence estimates with the Jukes–Cantor correction (Jukes and Cantor 1969). To correct for mutation biases and base composition, we correct divergences for “mutational opportunity” (Petrov and Hartl 1999) by measuring the rate of each of the 16 types of base substitution from the reconstructed ancestor observed at intronFEI sites (Supplemental Table 14). We detected significant heterogeneity between GC → AT and AT → GC substitutions in all four contexts (Fisher's exact test, P < 2.2 × 10⁻¹⁶ between D. melanogaster and D. simulans for both the X and autosomes; P = 6.872 × 10⁻⁸ between the X and autosomes for D. melanogaster; and P = 0.001889 between the X and autosomes for D. simulans) and thus generated a separate table for each context. Depending on the context, we used one of these tables as a proxy for the scaled mutation rate at a given site that depends on the inferred state (A, G, C, or T) in the reconstructed ancestor.
Gene Ontology and sex-biased expression analyses
Each annotated D. melanogaster protein-coding gene was classified by Gene Ontology according to the top-level molecular function terms of GO:0003674: GO:0001071, GO:0003824, GO:0005198, GO:0005215, GO:0005488, GO:0009055, GO:0016015, GO:0016209, GO:0016247, GO:0016530, GO:0030234, GO:0030528, GO:0031386, GO:0045182, GO:0045735, and GO:0060089. GO terms for all genes were assigned using map2slim.pl (go-perl module) according to ftp.flybase.net/releases/FB2011_01/precomputed_files/ontologies/gene_ontology.obo.zip.
Before testing for an X-effect, a stepwise regression (R function “step”) was used to identify significant GO terms for each site class, based on Akaike's Information Criterion. With respect to sex-bias classification by gene expression, we used data prepared in the Sebida database (http://www.sebida.de, sebida_melanogaster_3.0.txt) (Gnad and Parsch 2006). Only genes with false-discovery rates <0.01 were included. We compared the alternative model fits with the ANOVA function in R to test for effects by gene function, sex-biased expression, and X-linkage on divergence rates.
Data access
The raw short read data generated from this study have been submitted to the NCBI Sequence Read Archive (SRA) (http://www.ncbi.nlm.nih.gov/sra) under accession number SRA055460. The D. simulans w501 assembly is available at http://genomics.princeton.edu/AndolfattoLab/Links.html.
Acknowledgments
We thank Molly Przeworski and David Stern for useful discussions and Ying Zhen for useful comments. We also thank Stephen Wright for use of his server to run the Velvet assembly. This work was funded in part by NIH grant R01-GM085183 to K.R.T. and R01-GM083228 to P.A.
Footnotes
[Supplemental material is available for this article.]
Article published online before print. Article, supplemental material, and publication date are at http://www.genome.org/cgi/doi/10.1101/gr.141689.112.
Freely available online through the Genome Research Open Access option.
References
- The 1000 Genomes Project Consortium 2010. A map of human genome variation from population-scale sequencing. Nature 467: 1061–1073 [DOI] [PMC free article] [PubMed] [Google Scholar]
- Akashi H 1995. Inferring weak selection from patterns of polymorphism and divergence at ”silent” sites in Drosophila DNA. Genetics 139: 1067–1076 [DOI] [PMC free article] [PubMed] [Google Scholar]
- Akashi H 1996. Molecular evolution between Drosophila melanogaster and D. simulans: Reduced codon bias, faster rates of amino acid substitution, and larger proteins in D. melanogaster. Genetics 144: 1297–1307 [DOI] [PMC free article] [PubMed] [Google Scholar]
- Akashi H, Schaeffer SW 1997. Natural selection and the frequency distributions of ”silent” DNA polymorphism in Drosophila. Genetics 146: 295–307 [DOI] [PMC free article] [PubMed] [Google Scholar]
- Andolfatto P 2001. Contrasting patterns of X-linked and autosomal nucleotide variation in Drosophila melanogaster and Drosophila simulans. Mol Biol Evol 18: 279–290 [DOI] [PubMed] [Google Scholar]
- Andolfatto P 2005. Adaptive evolution of non-coding DNA in Drosophila. Nature 437: 1149–1152 [DOI] [PubMed] [Google Scholar]
- Andolfatto P, Davison D, Erezyilmaz D, Hu TT, Mast J, Sunayama-Morita T, Stern DL 2011a. Multiplexed shotgun genotyping for rapid and efficient genetic mapping. Genome Res 21: 610–617 [DOI] [PMC free article] [PubMed] [Google Scholar]
- Andolfatto P, Wong KM, Bachtrog D 2011b. Effective population size and the efficacy of selection on the X chromosomes of two closely related Drosophila species. Genome Biol Evol 3: 114–128 [DOI] [PMC free article] [PubMed] [Google Scholar]
- Aquadro CF, Lado KM, Noon WA 1988. The rosy region of Drosophila melanogaster and Drosophila simulans. I. Contrasting levels of naturally occurring DNA restriction map variation and divergence. Genetics 119: 875–888 [DOI] [PMC free article] [PubMed] [Google Scholar]
- Ballard JW 2000. Comparative genomics of mitochondrial DNA in members of the Drosophila melanogaster subgroup. J Mol Evol 51: 48–63 [DOI] [PubMed] [Google Scholar]
- Begun DJ 2001. The frequency distribution of nucleotide variation in Drosophila simulans. Mol Biol Evol 18: 1343–1352 [DOI] [PubMed] [Google Scholar]
- Begun DJ, Holloway AK, Stevens K, Hillier LW, Poh YP, Hahn MW, Nista PM, Jones CD, Kern AD, Dewey CN, et al. 2007. Population genomics: Whole-genome analysis of polymorphism and divergence in Drosophila simulans. PLoS Biol 5: e310 doi: 10.1371/journal.pbio.0050310 [DOI] [PMC free article] [PubMed] [Google Scholar]
- Bradley RK, Roberts A, Smoot M, Juvekar S, Do J, Dewey C, Holmes I, Pachter L 2009. Fast statistical alignment. PLoS Comput Biol 5: e1000392 doi: 10.1371/journal.pcbi.1000392 [DOI] [PMC free article] [PubMed] [Google Scholar]
- Callahan B, Neher RA, Bachtrog D, Andolfatto P, Shraiman BI 2011. Correlated evolution of nearby residues in Drosophilid proteins. PLoS Genet 7: e1001315 doi: 10.1371/journal.pgen.1001315 [DOI] [PMC free article] [PubMed] [Google Scholar]
- Cao J, Schneeberger K, Ossowski S, Günther T, Bender S, Fitz J, Koenig D, Lanz C, Stegle O, Lippert C, et al. 2011. Whole-genome sequencing of multiple Arabidopsis thaliana populations. Nat Genet 43: 956–963 [DOI] [PubMed] [Google Scholar]
- Charlesworth B 2009. Fundamental concepts in genetics: Effective population size and patterns of molecular evolution and variation. Nat Rev Genet 10: 195–205 [DOI] [PubMed] [Google Scholar]
- Charlesworth B 2010. Molecular population genomics: A short history. Genet Res 92: 397–411 [DOI] [PubMed] [Google Scholar]
- Charlesworth B, Coyne J, Barton NH 1987. The relative rates of evolution of sex chromosomes and autosomes. Am Nat 130: 113–146 [Google Scholar]
- Charlesworth B, Morgan MT, Charlesworth D 1993. The effect of deleterious mutations on neutral molecular variation. Genetics 134: 1289–1303 [DOI] [PMC free article] [PubMed] [Google Scholar]
- Charlesworth B, Betancourt AJ, Kaiser VB, Gordo I 2009. Genetic recombination and molecular evolution. Cold Spring Harb Symp Quant Biol 74: 177–186 [DOI] [PubMed] [Google Scholar]
- Drosophila 12 Genomes Consortium, Clark AG, Eisen MB, Smith DR, Bergman CM, Oliver B, Markow TA, Kaufman TC, Kellis M, Gelbart W, et al. 2007. Evolution of genes and genomes on the Drosophila phylogeny. Nature 450: 203–218 [DOI] [PubMed] [Google Scholar]
- Edgar RC 2004. MUSCLE: A multiple sequence alignment method with reduced time and space complexity. BMC Bioinformatics 5: 113 doi: 10.1186/1471-2105-5-113 [DOI] [PMC free article] [PubMed] [Google Scholar]
- Eyre-Walker A, Keightley PD 2007. The distribution of fitness effects of new mutations. Nat Rev Genet 8: 610–618 [DOI] [PubMed] [Google Scholar]
- Fay JC, Wyckoff GJ, Wu CI 2002. Testing the neutral theory of molecular evolution with genomic data from Drosophila. Nature 415: 1024–1026 [DOI] [PubMed] [Google Scholar]
- Gnad F, Parsch J 2006. Sebida: A database for the functional and evolutionary analysis of genes with sex-biased expression. Bioinformatics 22: 2577–2579 [DOI] [PubMed] [Google Scholar]
- Haddrill PR, Bachtrog D, Andolfatto P 2008. Positive and negative selection on noncoding DNA in Drosophila simulans. Mol Biol Evol 25: 1825–1834 [DOI] [PMC free article] [PubMed] [Google Scholar]
- Halligan DL, Keightley PD 2006. Ubiquitous selective constraints in the Drosophila genome revealed by a genome-wide interspecies comparison. Genome Res 16: 875–884 [DOI] [PMC free article] [PubMed] [Google Scholar]
- Jukes T, Cantor C 1969. Evolution of protein molecules. In Mammalian protein metabolism. III (ed. HN Munro), pp. 21–132. Academic Press, New York [Google Scholar]
- Kelley DR, Schatz MC, Salzberg SL 2010. Quake: Quality-aware detection and correction of sequencing errors. Genome Biol 11: R116 doi: 10.1186/gb-2010-11-11-r116 [DOI] [PMC free article] [PubMed] [Google Scholar]
- Kent WJ 2002. BLAT—the BLAST-like alignment tool. Genome Res 12: 656–664 [DOI] [PMC free article] [PubMed] [Google Scholar]
- Kimura M. 1983 The neutral theory of molecular evolution. Cambridge University Press, Cambridge, UK. [Google Scholar]
- Kurtz S, Phillippy A, Delcher AL, Smoot M, Shumway M, Antonescu C, Salzberg SL 2004. Versatile and open software for comparing large genomes. Genome Biol 5: R12 doi: 10.1186/gb-2004-5-2-r12 [DOI] [PMC free article] [PubMed] [Google Scholar]
- Li H, Handsaker B, Wysoker A, Fennell T, Ruan J, Homer N, Marth G, Abecasis G, Durbin R, Subgroup GPDP 2009. The Sequence Alignment/Map format and SAMtools. Bioinformatics 25: 2078–2079 [DOI] [PMC free article] [PubMed] [Google Scholar]
- Mackay TFC, Richards S, Stone EA, Barbadilla A, Ayroles JF, Zhu D, Casillas S, Han Y, Magwire MM, Cridland JM, et al. 2012. The Drosophila melanogaster Genetic Reference Panel. Nature 482: 173–178 [DOI] [PMC free article] [PubMed] [Google Scholar]
- Mank JE, Vicoso B, Berlin S, Charlesworth B 2010. Effective population size and the Faster-X effect: Empirical results and their interpretation. Evolution 64: 663–674 [DOI] [PubMed] [Google Scholar]
- McVean GA, Vieira J 2001. Inferring parameters of mutation, selection and demography from patterns of synonymous site evolution in Drosophila. Genetics 157: 245–257 [DOI] [PMC free article] [PubMed] [Google Scholar]
- Moriyama EN, Powell JR 1996. Intraspecific nuclear DNA variation in Drosophila. Mol Biol Evol 13: 261–277 [DOI] [PubMed] [Google Scholar]
- Nielsen R, Bauer DuMont VL, Hubisz MJ, Aquadro CF 2007. Maximum likelihood estimation of ancestral codon usage bias parameters in Drosophila. Mol Biol Evol 24: 228–235 [DOI] [PubMed] [Google Scholar]
- Ning Z, Cox AJ, Mullikin JC 2001. SSAHA: A fast search method for large DNA databases. Genome Res 11: 1725–1729 [DOI] [PMC free article] [PubMed] [Google Scholar]
- Ohta T 1973. Slightly deleterious mutant substitutions in evolution. Nature 246: 96–98 [DOI] [PubMed] [Google Scholar]
- Ohta T 1993. Amino acid substitution at the Adh locus of Drosophila is facilitated by small population size. Proc Natl Acad Sci 90: 4548–4551 [DOI] [PMC free article] [PubMed] [Google Scholar]
- Parsch J, Novozhilov S, Saminadin-Peter SS, Wong KM, Andolfatto P 2010. On the utility of short intron sequences as a reference for the detection of positive and negative selection in Drosophila. Mol Biol Evol 27: 1226–1234 [DOI] [PMC free article] [PubMed] [Google Scholar]
- Petrov DA, Hartl DL 1999. Patterns of nucleotide substitution in Drosophila and mammalian genomes. Proc Natl Acad Sci 96: 1475–1479 [DOI] [PMC free article] [PubMed] [Google Scholar]
- Smith NGC, Eyre-Walker A 2002. Adaptive protein evolution in Drosophila. Nature 415: 1022–1024 [DOI] [PubMed] [Google Scholar]
- Sturgill D, Zhang Y, Parisi M, Oliver B 2007. Demasculinization of X chromosomes in the Drosophila genus. Nature 450: 238–241 [DOI] [PMC free article] [PubMed] [Google Scholar]
- Treangen TJ, Salzberg SL 2012. Repetitive DNA and next-generation sequencing: Computational challenges and solutions. Nat Rev Genet 13: 36–46 [DOI] [PMC free article] [PubMed] [Google Scholar]
- Vicario S, Moriyama EN, Powell JR 2007. Codon usage in twelve species of Drosophila. BMC Evol Biol 7: 226 doi: 10.1186/1471-2148-7-226 [DOI] [PMC free article] [PubMed] [Google Scholar]
- Vicoso B, Charlesworth B 2006. Evolution on the X chromosome: Unusual patterns and processes. Nat Rev Genet 7: 645–653 [DOI] [PubMed] [Google Scholar]
- Wilson DJ, Hernandez RD, Andolfatto P, Przeworski M 2011. A population genetics–phylogenetics approach to inferring natural selection in coding sequences. PLoS Genet 7: e1002395 doi: 10.1371/journal.pgen.1002395 [DOI] [PMC free article] [PubMed] [Google Scholar]
- Wright S, Andolfatto P 2008. The impact of natural selection on the genome: Emerging patterns in Drosophila and Arabidopsis. Annu Rev Ecol Evol Syst 39: 193–213 [Google Scholar]
- Yang Z 2007. PAML 4: Phylogenetic analysis by maximum likelihood. Mol Biol Evol 24: 1586–1591 [DOI] [PubMed] [Google Scholar]
- Zerbino DR, Birney E 2008. Velvet: Algorithms for de novo short read assembly using de Bruijn graphs. Genome Res 18: 821–829 [DOI] [PMC free article] [PubMed] [Google Scholar]
- Zhang Y, Sturgill D, Parisi M, Kumar S, Oliver B 2007. Constraint and turnover in sex-biased gene expression in the genus Drosophila. Nature 450: 233–237 [DOI] [PMC free article] [PubMed] [Google Scholar]