

Abstract
Peanut (Arachis hypogaea L.) ranks fifth among the world oil crops and is widely grown in India and neighbouring countries. Due to its large and unknown genome size, studies on genomics and genetic modification of peanut are still scanty as compared to other model crops like Arabidopsis, rice, cotton and soybean. Because of its favourable cultivation in semi-arid regions, study on abiotic stress responsive genes and its regulation in peanut is very much important. Therefore, we aim to identify and annotate the abiotic stress responsive candidate genes in peanut ESTs. Expression data of drought stress responsive corresponding genes and EST sequences were screened from dot blot experiments shown as heat maps and supplementary tables, respectively as reported by Govind et al. (2009). Some of the screened genes having no information about their ESTs in above mentioned supplementary tables were retrieved from NCBI. A phylogenetic analysis was performed to find a group of utmost similar ESTs for each selected gene. Individual EST of the said group were further searched in peanut ESTs (1,78,490 whole EST sequences) using stand alone BLAST. For the prediction as well as annotation of abiotic stress responsive selected genes, various tools (like Vec-Screen, Repeat Masker, EST-Trimmer, DNA Baser, WISE2 and I-TASSER) were used. Here we report the predicted result of Contigs, domain as well as 3D structure for HSP 17.3KDa protein, DnaJ protein and Type 2 Metallothionein protein.
Keywords: Arachis hypogaea, EST, Gene annotation, Stress, Contigs
Background
Peanut (Arachis hypogaea L.) is an important source of protein and vegetable oil. Most of the species among the genus Arachis are wild and are not domesticated. Cultivated peanut (A. hypogea L.) is an allotetraploid (2n = 4x = 40) species which is widely cultivated around the world in tropical, sub-tropical and warm temperate climates [1]. Thus, peanut is an internationally important crop for human consumption and oil production. Abiotic stresses such as drought, cold, salinity and sodacity are major factors affecting the crop yield. There are many genes or gene networks are involved in response to abiotic stresses. Some of the major challenges for the breeding programs are developing abiotic stress tolerant, improved oil quality and flavoured varieties of peanut. As peanut can be cultivated in arid and semi-arid regions and drought or dehydration is most frequent stress reduced the yield. Therefore, study on drought stress responsive genes and its regulation is very much important. Use of molecular markers and marker- assisted selection for crop improvement and evolution showed little variation which resulted in limited application. Therefore, the development of transgenic peanut has enormous potential for enhanced productivity, trait improvement and identification of agronomically useful genes.
Expressed sequence tags (ESTs) are considered as most appropriate tool for discovering a gene, mapping a gene and analyzing various traits necessary for crop improvement. They are generated from large scale sequencing of clones from cDNA libraries prepared from mRNA isolated at a specific stage of cell/tissue development. Many EST libraries have been constructed and are available in sequence databases. As the functions and regulation of most of the newly identified genes are not known, but can be determined by multiple sequence alignment with known genes/ ESTs available in the databases. EST approach developed during the establishment of genomics era and in HGP (Human Genome Project) has proved to be the most high throughput technologies ever invented [2]. Use of EST maps in major crop genome projects such as Zea mays [3], Glycine max [4] and Triticum aestivum [5] have been successfully applied. Study on identification and functional validation of some drought induced genes differentially expressed during gradual water stress in peanut has been conducted [6].
In the present study, we aim to identify the drought stress responsive candidate genes in peanut ESTs available in databases. Experimental data of expression analysis of drought stress responsive genes and its corresponding EST sequences as heat maps and supplementary tables reported previously [6] were screened. Furthermore, a phylogenetic analysis was performed to find a cluster of utmost similar ESTs for each selected gene. Individual EST of the mentioned cluster were further searched in peanut ESTs (1, 78,490) using stand alone BLAST. To predict as well as annotate abiotic stress responsive selected genes various tools like Vecscreen (a system that is developed by NCBI for quickly identifying and removing segments of a nucleic acid sequence that may be of vector origin and act as contaminant, before sequence analysis), RepeatMasker (a program that screens DNA sequences for interspersed repeats and low complexity DNA sequences), EST trimmer (a tool used for trimming EST sequences concerning ambiguous sequences, removing of distal oligoN series from either the 5' or 3' end and size cut off), DNA Baser (that allows to assemble a set of contiguous sequences, contigs) and WISE2 (that compares a protein sequence to a genomic DNA sequence, allowing for introns and frameshifting errors) were used. Here we report six best putative candidate genes belonging to three different gene families for drought stress response in peanut. Further, Predicted result of contigs, domain as well as 3D structure for HSP 17.3KDa protein, DnaJ protein and Type 2 Metallothionein protein were also discussed.
Methodology
Screening of Peanut ESTs:
Experimental data for expression analysis of drought stress responsive genes shown in the heat map and supplementary table [6] were downloaded. Depending upon the higher expression during drought five gene families was selected. Total twenty two ESTs were screened from the above selected five different gene families. With the efforts of Peanut Genome Initiative (PGI), out of 2, 52,832 ESTs reported from the genus Arachis at NCBI, 1, 78,490 ESTs were belongs to cultivated peanut A. hypogaea. Total ESTs sequences of A. hypogaea and above twenty two screened ESTs sequences were retrieved from the NCBI database.
Phylogenetic Analysis:
To find relationship between ESTs of individual gene family with representative genes, phylogenetic analysis was performed using MEGA 5.1 Beta (a unified tool for showing automatic and manual sequence alignment, concluding phylogenetic trees, estimating rates of molecular evolution, mining web-based databases, inferring inherited sequences, and testing evolutionary hypotheses) software available at http://www.megasoftware.net. It is used for phylogenetic analysis in various research fields [7].
Standalone BLAST:
The standalone BLAST wasperformed against whole peanut ESTs and using screened ESTs as query sequences. BLAST analysis was done on the basis of their highest bit score and lowest e-value.
Data Normalization:
After BLAST analysis, the shortlisted ESTs were further checked for the presence of vector sequences, polyA tail, interspersed repeats and low complexity regions in the DNA followed by their removal by using different online available software's like VecScreen [available at www.ncbi.nlm.nih.gov/VecScreen/VecScreen.html and was used for the identification of a nucleic acid sequence that may contain a vector origin. A hash search algorithm was used to remove contaminating sequences [8]. The algorithm initially uses a hash lookup, followed by a gapless hit extension. Finally, ESTs that passed the filters but possessed an unmasked sequence were discarded], EST trimmer (available at http://imed.med.ucm.es/EMBOSS/runs/tmp.0.xuYbpD/inde x.html) and can recognize one or more nucleotide sequences with any 3' poly-A tail (or, optionally, 5' poly-T tail) in the input sequences that are at least the specified minimum length [8] and Repeat Masker available at www.repeatmasker.org/and is a program that curtains DNA sequences for interspersed repeats and low complexity DNA sequences. The output of the database is a detailed explanation of the repeats that are contemporary in the query sequence as well as a modified version of the query sequence in which all the annotated repeats have been masked. In various contig assemblies, repeat masker has been used [9].
EST Assembly:
EST assembly was performed using DNABaser (www.dnabaser.com/) software. Data filtering and assembly of EST sequences were accomplished with the help of DNABaser (v3.5.3), which incorporates quality filtering, clustering, and assembly into one distinct pipeline. The filtering step includes masking of vector sequence and low-quality regions and annotation of low-complexity regions, repeats, and poly (A) regions. The final assembled ESTs were named as contigs.
Identification of putative candidate genes:
The contigs of individual gene families were subjected to BLAST analysis with the whole genome of Arabidopsis available in TAIR10 (www.arabidopsis.org/) database. The putative candidate gene was identified by WISE2 (www.ebi.ac.uk/Tools/Wise2/) analysis on the basis of lowest e-value and highest WISE2 score (in bits). Wise2 help to perform the comparison of a protein sequence to a genomic DNA sequence which allows understanding of the errors in intron and frame shifting using Gene Wise algorithm [10]. It helped to select the putative candidate genes with known functions.
Three dimensional structure prediction of identified domains:
3D structure of the identified domains of the protein sequences were predicted using I-TASSER (http://zhanglab.ccmb.med.umich.edu/I-TASSER/). I-TASSER (The iterative threading assembly refinement) server determines 3D structures of protein based on the sequence-tostructure- to-function paradigm algorithm. It predicts secondary structure, tertiary structure and functional annotations on ligand-binding sites, enzyme commission numbers and gene ontology terms. The accuracy of prediction is based on the confidence score of the modelling [11, 12].
Discussion
Peanut (A. hypogaea) is an important oilseed crop having major nutritional as well as economic value. It is the third major oilseed crop in the world next to soybean and cotton. Production of peanut at global level plays a significant role as far as nutrition, fuel and energy, sustainable agriculture and enhanced productivity is concerned. To enhance crop production, genetic improvement through genomic research is more beneficial [2]. Numerous applications and recent developments from the EST concept have been made after it was proposed by Adams et al [13]. EST sequencing was aimed to clone the full length sequences of genes with agronomic value. Large-scale EST sequencing offers an access into the genome of an organism. The ESTs gave significant evidence about its coding content and expression patterns in different tissues of plants in different environmental conditions. The EST resource of A. hypogaea will play major role for genome sequencing and gene expression analysis in different abiotic stresses. Therefore, to get necessary information about genes involved in abiotic stresses, ESTs were selected which currently encompass more entries in the public databases than any other form of sequence data. Thus, EST datasets provide a vast resource for gene identification and expression profiling. By doing EST assembly, researchers will be able to learn about tissue specificity and expression profiling of peanut genes [14]. From introduction of Peanut Genome Initiative, till March 2012, the peanut research community has deposited 2, 52,832 ESTs in the public NCBI database [2]. Out of total ESTs of peanut, 1, 78, 490 ESTs belongs to cultivated peanut (A. hypogaea) only.
For identifying drought stress responsive putative genes in peanut (A. hypogaea) ESTs, five drought stress responsive gene families and its corresponding EST sequences were shortlisted from the experimental data of the heat map [6]. For each shortlisted gene family, their corresponding ESTs were selected. Total 22 ESTs belonging to five drought stress responsive gene families were selected from the supplementary data described by Govind et al [6] and shown in Table 1 (see supplementary material). The whole ESTs of A. hypogaea (1, 78,490 ESTs) including 22 ESTs screened during this study were downloaded from the public NCBI database. For the identification of similar ESTs of each screened 22 ESTs in whole peanut ESTs, Standalone BLAST (2.2.26) analysis was performed. The screened ESTs were taken as a query sequence and the whole peanut ESTs as a database. Similar EST sequences were shortlisted on the basis of lowest e-value and highest bit score. We found that total of 3073 ESTs in which 826, 286, 17, 66 and 1878 ESTs belongs to Hsp17.3 KDa, Desiccation protective protein LEA5, DnaJ heat shock protein, Hsp70-60 KDa chaperonin and Type 2 metallothionein, respectively (Table 1).
Phylogenetic analysis was performed to find the appropriate evolutionary relationship between ESTs of individual gene family with representative genes. Our phylogenetic result showed that individual gene family has close relation with respect to their representative genes. We noticed that HSP 17.6 KDa family, out of 8 ESTs, one EST (gi|108954762) is closely related with gi|350534973 of Solanum lycopersicon. In desiccation protective protein family, out of 4 ESTs, two ESTs (gi|108954830 and gi|108954989) are closely related with gi|388503839 of Lotus japonicus. In Type 2 metallothionein family, out of 6 ESTs, three ESTs (gi|108954648, gi|108954669 and gi|108955131) are closely related with gi|71040682 of A. hypogaea itself. Similarly in Hsp70-60 KDa chaperonin family, out of 3 ESTs, one EST (gi|108955006) is closely related with gi|297722722 of Oryza sativa (Figure 1a, 1b, 1c and 1d).
Figure 1.
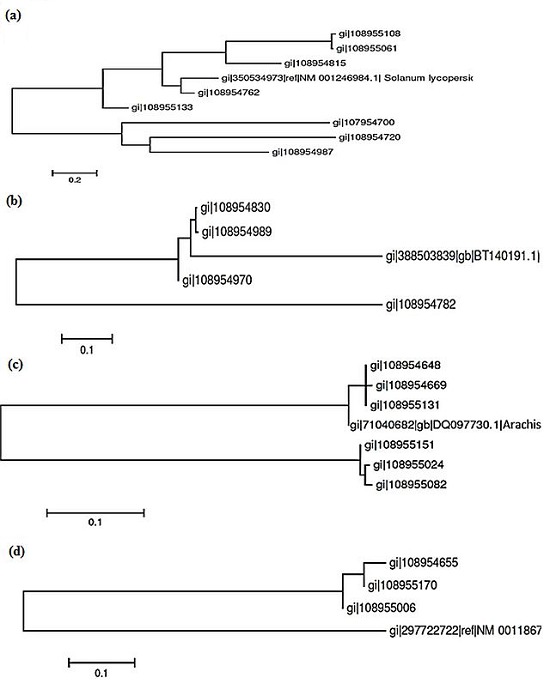
(a) Dendrogram depicting phylogenetic relationship between screened ESTs of 17.3 KDa class I HSP and representative gene of Solanum lycopersicon (gi|350534973|ref|NM 001246984.1). The evolutionary relationship is analysed by using MEGA 5.1. The phylogenetic tree represented the nearest gene with respect to reference gene is gi|108954762; (b) Dendrogram depicting phylogenetic relationship between screened ESTs of desiccation protective protein and representative gene of Lotus japonicu (gi|388503839|gb|BT140191.1). The phylogenetic relationship is analysed by using MEGA 5.1. The phylogenetic tree represented the nearest gene with respect to reference gene is gi|108954989; (c) Dendrogram depicting phylogenetic relationship between screened ESTs of type 2 metallothionein and representative gene of A. hypogaea (gi|71040682|gb|DQ097730.1). The evolutionary relationship is analysed by using MEGA 5.1. The phylogenetic tree represented the nearest gene with respect to reference gene is gi|108955131; (d) Dendrogram depicting phylogenetic relationship between screened ESTs Hsp70-60 KDa chaperonin and representative gene of Oryza sativa (gi|297722722|ref|NM 0011867). The phylogenetic relationship is analysed by using MEGA 5.1. The phylogenetic tree represented the nearest gene with respect to reference gene is gi|108955006.
The shortlisted ESTs were further normalized by removing vector sequences, Poly-A tail and masking of low complexity region using different online available software's. We found that out of 3073 ESTs, 2931 EST sequences did not contain vector sequences were used for further analysis. As reported by Joshua et al [15], a number of quality features are evaluated for EST assembly such as: (a) the occurrence of chimeric contigs; (b) the constancy of mate-pairs in the same contig; (c) phylogenetic analysis using known genes and their relationships; and (d) the extent of redundancy among the assembly's contigs and singletons. In an ideal assembly, for the generation of a single contig, ESTs transcribed from a single gene are conjoined together. A phylogenic approach was also used to assess EST assembly quality [16]. After normalization, EST sequences were assembled for finding the contigs using DNABaser (v3.5.3) (Figure 2). These contigs were further BLAST (v2.2.8) with Arabidopsis Whole Genome (TAIR v10) Table 2 (see supplementary material). On the basis of lowest e-value, out of five, three gene families (i.e. 17KDa Class II Heat Shock Protein, DnaJ protein and Type 2 Metallothionein) were selected. WISE2 (v 2.1.20) was performed to select putative candidate genes with known functions as well as intron and exon identifications [17, 18]. Based on highest WISE2 score (in bits) six putative candidate genes were found and their respective families with their roles are mentioned (Table 2).
Figure 2.
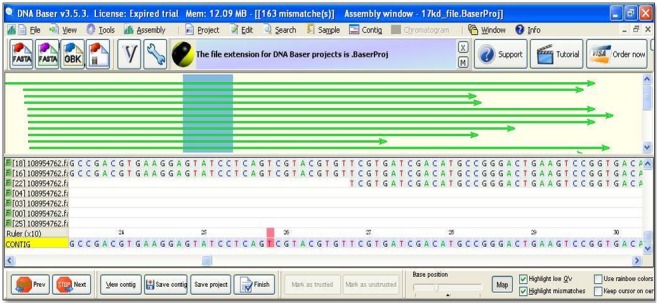
Result showing snapshot of assembled contig map of a gene family analyzed by DNA Baser (v3.5.3). The green arrows represent the aligned EST sequences which were used for EST assembly. The pink color indicated the mismatch in final contig sequence. The side bar indicating the list of input sequences with file extension .fasta (“GI number”.fasta).
The functional characterization of protein depends upon their 3D structure, therefore from the resulting assembled contig sequences, conserved protein domains were assessed from InterProScan (http://www.ebi.ac.uk/Tools/pfa/iprscan) [19] which allows to scan protein sequence for matches against the InterPro collection of protein signature databases. The different combinations of domains give rise to the diverse range of proteins found in nature. The identification of domains that occur within proteins can thus provide insights into their function. We also predicted the possible domains in three protein sequences of HSP17.3KDa protein (Figure 3a), DnaJ protein (Figure 3b) and Type 2 Metallothionein protein (Figure 3c) by using InterProScan. InterProScan of HSP17.3KDa protein has Alpha crystallin/HSP20 domain (IPR002068) as well as HSP20-like Chaperone and other unassigned HSP20 domains (Figure 3a). Likewise, DnaJ protein showed N-terminal HSP domain (IPRO01623), C-terminal HSP domain (IPRO02939) and others (Figure 3b). Again, metallothionein type 2 has entirely a single domain of metallothionein family-15 type 2 domains (IPRO00347) (Figure 3c).Earlier it was reported that Small heat shock proteins (sHSPs) varies from 15–42 kDa [20] that play a significant role in providing resistance to variety of abiotic stresses such as drought, salt, cold and oxidants besides high temperature [21, 22]. Tzi et al [23] reported that DnaJ protein plays an important role in various stress response mechanism. Clement et al [24] reported that DnaJ protein interacts with Hsp70 that might also be involved with ABA signalling. Metallothioneins are associated in metal detoxification, homeostasis, and protection during oxidative damage [25]. It was reported that metallothionein transcripts were present in both cultivated peanut and wild species [26, 1].
Figure 3.
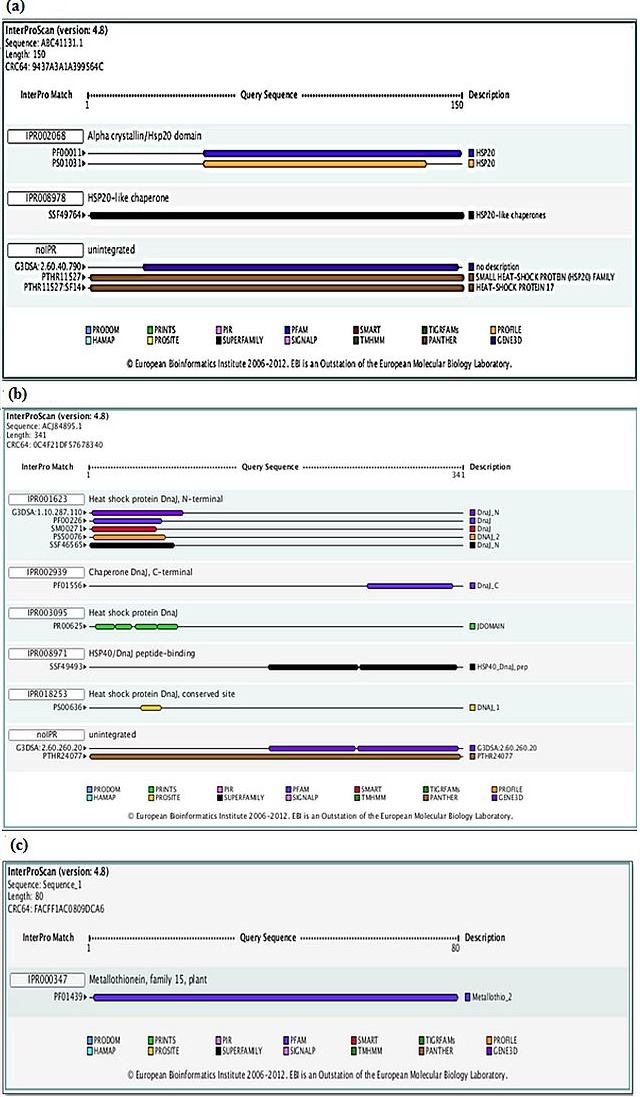
(a): Result of HSP 17.3KDa protein for domain prediction/identification by InterProScan. The blue colour bar is showing the Alpha crystalline/HSP20 domain having interpro ID PF00011 (IPR002068). The sequences of HSP 17.3KDa protein contain the highly similar domain with Alpha crystalline/HSP20 domain. The black bar is representing the HSP20 like chaperone (i.e. IPR008978 from SUPERFAMILY). These sequences also contain the unintegrated domain (i.e. noIPR). In unintegrated domain the blue bar is from GENE3D with no description, the next brown bar (PTHR11527) is for SMALL HEAT SHOCK PROTEIN FAMILY and the last brown bar is for HEAT SHOCK PROTEIN 1.7 (these brown bars from PANTHER); (b) Result of DnaJ protein for domain prediction/identification by InterProScan. In IPR001623 it represents the Heat shock protein Dnaj, N-terminal. The violet, blue, red, orange and black bar is representing the domain of Dnaj_N, Dnaj (PF00226 i.e. from PFAM), Dnaj (SM00271 i.e. from SMART), DNAJ_2 (i.e. from PROFILE) and Dnaj_N (SSF46565 i.e. from SUPERFAMILY) respectively. The next blue bar is for Dnaj_C i.e. Chaperone Dnaj, C-terminal (IPR002939) from PFAM. The green bar is for Heat shock protein Dnaj from PRINTS. The Dnaj peptide binding domain is represented from black bar (i.e. IPR008971 from SUPERFAMILY). The Heat shock protein Dnaj conserved site represented by yellow bar (i.e. IPR018253 from PROSITE). The unintegrated domain is containing two bars of different colour, the violet one is from GENE3D and the brown one is from PANTHER; (c) Result of Type 2 Metallothionein protein for domain prediction/identification by InterProScan. The blue colour bar is showing Type 2 Metallothionein domain of PFAM. It has no unintegrated region in its domain part. It only contains the unique PFAM domain.
Simultaneously, we predicted the 3D structure of corresponding protein sequences of contigs HSP17.3KD protein (Figure 4a), DnaJ protein (Figure 4b) and Type 2 Metallothionein protein (Figure 4c) by using I-TASSER. Biological role of above three proteins were also noted from ITASSER result. The quality of the generated models are estimated based on a confidence score (C-score), ranges from -5 to 2 where a high value signifies a model with a high confidence and vice-versa. C-score is highly correlated with TM-score and RMSD thus, TM-score and RMSD are known standards to measure the accuracy of structure modelling thereby measuring structural similarity between two protein structures. RMSD is an average distance of all residue pairs in two structures and is sensitive to local errors (i.e., a misorientation of the tail) which occurs inspite of the correct global topology hence, TM-score must be used for solving these errors. A TM-score >0.5 indicates a model of correct topology. Therefore, the best predicted model is selected on the basis of confidence score; TM-Score as well as RMSD value Table 3 (see supplementary material). I-TASSER server predicts and displays various features in different sections for best model studies. We are considering the prediction and generation of the best model based on C-Score, their structural analogs and binding sites. The C-Score value for the best predicted model HSP17.3KD, DnaJ protein and Type 2 Metallothionein protein (0.3), (-3.18) and (-2.98) respectively and furthermore, highly similar structures in PDB (as identified by TM-align) of HSP17.3KD, DnaJ and Type 2 metallothionein were identified and listed in Table 4 (see supplementary material). Template proteins with similar binding sites for HSP, DnaJ and Type 2 metallothionein were listed in Table 5 (see supplementary material). The best binding site is predicted on the basis of CscoreLB (Range = 0-1) and BS-Score (>1) values. A higher score CscoreLB indicates a more reliable ligand-binding site prediction and BS-score reflects a significant local match between the predicted and template binding site (Table 5) [11, 12].
Figure 4.
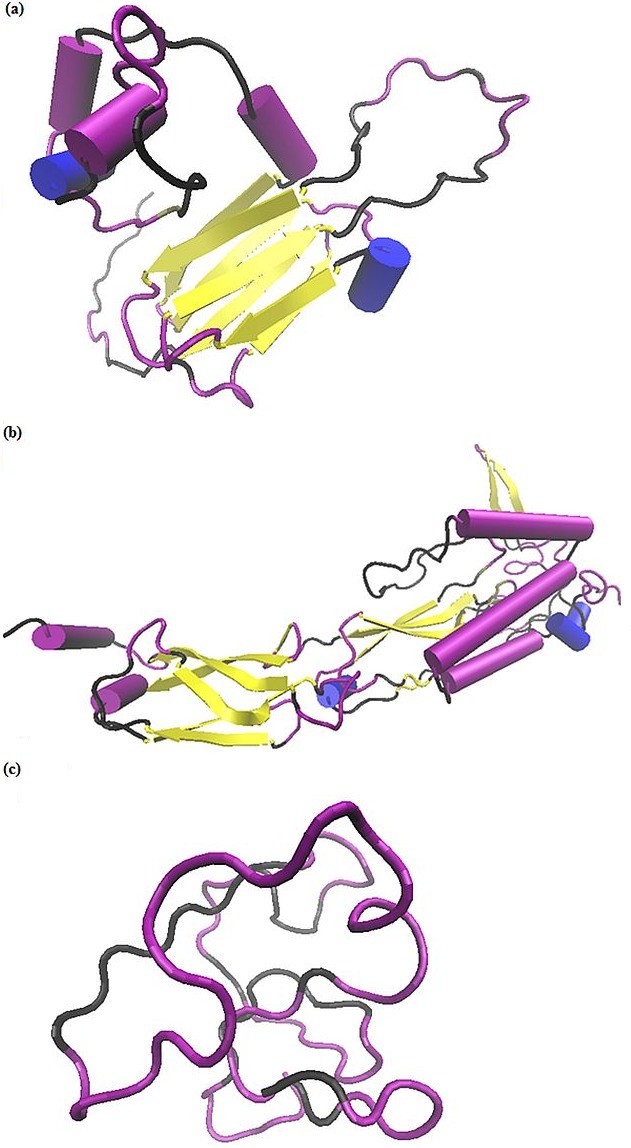
(a) Result showing 3D structure of HSP17.3KDa protein predicted by I-TASSER. The coloring method is based on secondary structure. The cartoon shaped structure representing α helix and the yellow colored arrow representing β-sheets. The black color part of ribbon representing coil and the purple color representing turn in this 3D structure; (b) Result showing 3D structure of DnaJ protein predicted by ITASSER. The colouring method is based on secondary structure. The cartoon shaped structure representing α helix and the yellow colored arrow representing β-sheets. The black colour part of ribbon representing coil and the purple colour representing turn in this 3D structure; (c) Result showing 3D structure of Type 2 Metallothionein protein predicted by ITASSER. This structure is not containing any α helix and β- sheets. But it is completely made up of only coil (black colour part of ribbon) and turns (in purple colour).
We found that HSP 17.1 KDa has important role in some molecular function (GO: 0005212) that contributes in the structural integrity of the cell and less role in creating protein oligomers (GO: 0051260). Similarly DnaJ interact selectively and non-covalently with unfolded proteins (GO: 0051082) and is involved in assisting the covalent and non-covalent assembly of single chain polypeptides or multi-subunit complexes into the correct tertiary structure (GO: 0006457). On the other hand, type 2 Metallothionein interact selectively and non-covalently with an adenyl-ribonucleotide, any compound consisting of adenosine esterified with (ortho) phosphate or an oligophosphate at any hydroxyl group on the ribose moiety (GO:0032559) and is thus involved in the chemical reactions and pathways involving the phosphate group, the anion or salt of any phosphoric acid (GO:0006796). Govind et al [6] described that for cellular mechanisms, groups of gene products are involved that act in coordination in response to stimuli of water withhold.
Conclusion
The present in silico study allowed identification of six best putative candidate genes belonging to three different gene families for drought stress response in peanut. Contigs, domains as well as 3D structure of HSP 17.3KDa protein, DnaJ protein and Type 2 Metallothionein protein were also predicted. Thus, EST approach play key role in providing an excellent resource for novel gene discovery and its annotation for drought stresses.
Supplementary material
Acknowledgments
Birla Institute of Technology, Mesra, Ranchi, Jharkhand, India is greatly acknowledged for providing Institute Fellowships to Mr. Ashutosh Kumar and Ms. Archana Kumari. UGC, New Delhi, India is also acknowledged for providing Fellowship to Mr. Gopal Kr. Prajapati. DBT, New Delhi, India is greatly acknowledged for providing Bioinformatics Facility at our Institute.
Footnotes
Citation:Kumari et al, Bioinformation 8(24): 1211-1219 (2012)
References
- 1.M Luo, et al. Crop Sci. 2005;45:346. [Google Scholar]
- 2.S Feng, et al. Comp Funct Genomics. 2012 [Google Scholar]
- 3.X Gai, et al. Nucleic Acids Res. 2000;28:94. doi: 10.1093/nar/28.1.94. [DOI] [PMC free article] [PubMed] [Google Scholar]
- 4.R Shoemaker, et al. Genome. 2002;45:329. [Google Scholar]
- 5.GR Lazo, et al. Biotechniques. 2001;30:1300. doi: 10.2144/01306bc03. [DOI] [PubMed] [Google Scholar]
- 6.G Govind, et al. Mol Genet Genomics. 2009;281:591. doi: 10.1007/s00438-009-0432-z. [DOI] [PMC free article] [PubMed] [Google Scholar]
- 7.A Trebichalský, et al. Journal of Microbiology, Biotechnology and Food Sciences. 2012;1:711. [Google Scholar]
- 8.Q Dong, et al. Plant Physiol. 2005;139:610. doi: 10.1104/pp.104.059212. [DOI] [PMC free article] [PubMed] [Google Scholar]
- 9.D Cheng, et al. Science China. 2012;55:452. [Google Scholar]
- 10.E Birney, et al. Genome Res. 2004;14:988. doi: 10.1101/gr.1865504. [DOI] [PMC free article] [PubMed] [Google Scholar]
- 11.Y Zhang, et al. BMC Bioinformatics. 2008;9:40. [Google Scholar]
- 12.A Roy, et al. Nature Protocols. 2010;5:725. doi: 10.1038/nprot.2010.5. [DOI] [PMC free article] [PubMed] [Google Scholar]
- 13.MD Adams, et al. Science. 1991;252:1651. [Google Scholar]
- 14.BS Siddanna, et al. American Journal of Plant Sciences. 2012;3:1169. [Google Scholar]
- 15.AU Joshua, et al. Genome Res. 2006;16:441. doi: 10.1101/gr.4602906. [DOI] [PMC free article] [PubMed] [Google Scholar]
- 16.TJ Close, et al. Plant Physiol. 2004;134:960. doi: 10.1104/pp.103.034462. [DOI] [PMC free article] [PubMed] [Google Scholar]
- 17.M Tamura, H Tachida. Mol Genet Genomics. 2011;285:393. doi: 10.1007/s00438-011-0615-2. [DOI] [PubMed] [Google Scholar]
- 18.A Kumar, et al. Int J Bioinform Res Appl. 2011;7:376. doi: 10.1504/IJBRA.2011.043769. [DOI] [PubMed] [Google Scholar]
- 19.E Quevillon, et al. Nucleic Acids Res. 2005;33:W116. [Google Scholar]
- 20.E Vierling, et al. Acta Physiol Plant. 1997;19:539. [Google Scholar]
- 21.N Banzet, et al. Plant J. 1998;13:519. [Google Scholar]
- 22.Y Sato, et al. Plant Cell Rep. 2008;27:329. doi: 10.1007/s00299-007-0470-0. [DOI] [PubMed] [Google Scholar]
- 23.BN Tzi, et al. Biopolymers. 2012;98:268. doi: 10.1002/bip.22098. [DOI] [PubMed] [Google Scholar]
- 24.M Cle´ment, et al. Plant Physiol. 2011;156:1481. doi: 10.1104/pp.111.174425. [DOI] [PMC free article] [PubMed] [Google Scholar]
- 25.K Akashi, et al. Biochem Biophys Res Commun. 2004;323:72. doi: 10.1016/j.bbrc.2004.08.056. [DOI] [PubMed] [Google Scholar]
- 26.K Proite, et al. BMC Plant Biol. 2007;7:1. doi: 10.1186/1471-2229-7-1. [DOI] [PMC free article] [PubMed] [Google Scholar]
Associated Data
This section collects any data citations, data availability statements, or supplementary materials included in this article.