Abstract
The use of high-throughput array technology is omnipresent in diverse areas specifically, early diagnosis of disease, discovery of infectious agents, search for biological markers and screening of potential drug candidates. Here, we integrated gene expression data with the network-based approach to identify novel genes that were playing central role in the network through interconnecting to a number of differentially expressed breast cancer genes. The 62 cancerous genes retrieved from the Breast Cancer Gene Database (BCGD) were mapped in the normalized data accessed from Stanford Microarray Database (SMD) to analyze their pattern. Interaction networks for each gene were constructed to understand the biology of the metastasis at systems level. The individual networks were fused together for the detection of interacting hubs, 38 novel genes were found to be deeply intermingled with the central hub node. Gene Ontology studies were made to depict the biology of the hub nodes not alone through gene ranking but by applying the Hyper geometric test with the Benjamini Hochberg False Discovery Rate (FDR) correction method at a significance level of 0.05. Analyzing p-values from the statistical test indicated that most of the novel genes were involved in the same biological function as the disordered genes like signal transducer, transcription regulator, enzyme binding, molecular transducer and receptor signaling protein activity and same pathway as MAPK signaling, Apoptosis, Wnt Signaling, ErbB signaling and Cell Cycle. Lastly, we identified 3 novel genes CHUK, INSR and CREBBP showing high connections with the 12 novel genes reported in literatures as well with the perturbed genes. As a result, these genes can be considered as significant finding in revealing the basis and pathways responsible for breast cancer.
Keywords: Microarray, Breast cancer gene database (BCGD), Estrogen receptors (ER), Tamoxifen, Expression pattern, Molecular interaction networks, Novel genes
Background
Carcinoma of the breast is the most widespread malignancy among women and is the second leading cause of deaths after lung cancer. It is a highly heterogeneous pathology involving disproportionate propagation and inadequate apoptosis of cellular differentiation that induces the mutant cells to accumulate [1]. Estrogens play a key role in the etiology of mammary carcinoma. Women's having breast cancer that test positive for estrogen receptors (ER+) suggest that estrogen promotes the growth of cancer cells. The anti-estrogen drug tamoxifen block the receptor and hence slows or stops the growth of cancerous cells [2]. The extensively used high density oligonucleotide microarray technology is playing a crucial role in biomedical research in the identification of disease markers. The technique measures the expression intensity of thousands of genes concurrently allowing the investigation of differentially expressed genes under diverse conditions of disease state or treatment [3].
A range of studies showed that microarray analysis is a reliable tool for the improvement of diagnosis. Molecular profiling of breast cancer has classified the tumor into various subtypes based on their gene expression pattern to better understand the biology of multifaceted disease [4]. The expansion of highthroughput technologies and the exponential propagation of data generated by these methods led to the emergence of systems biology that analyze a problem applying computational and mathematical tools to sum up massive amounts of information in a biological perception which later helps to understand multifarious biological systems [5–6].
In our present study, a systems biology approach is aimed to examine the association of diseased-genes with other genes involved in the carcinoma. We first analyzed the expression pattern of genes involved in breast cancer through high throughput expression information and subsequently constructed a network of Gene Interaction Map (GIP) from the differentially expressed and non-cancerous genes. Furthermore, Gene Ontology was performed on both cancerous and noncancerous genes to examine their functions and pathways.
Methodology
The in-silico investigation of the expression pattern of genes accountable for Breast Cancer was retrieved from Stanford Microarray Database (SMD). The data comprises of two experimental conditions when the cell line (MCF-7) was supplemented with Estrogen Receptors after making it deprived for many hours and when they were treated with an anti-cancerous drug, Tamoxifen.
Normalization:
Prior to the analysis the data was made comparable to locate the actual biological changes by processing it with the techniques of normalization. It is an imperative step in the analysis and helps to eradicate the differences in RNA qualities and the fluctuations generated by the technique so that the intensity level may not vary from one replicate to other [7].
The gene expression median ratio values (log2 values) were processed by following the neutral method [8]. An in-house program was developed to remove the experimental bias via following steps: (a) Calculating the row-wise mean and standard deviation for each gene in the data files. (b) Averaging the replicates. (c) Replacing the missing (empty) columns with the average values across the row.
Clustering:
Clustering is a vital step in microarray data analysis to infer group of data and locate co-regulated and functionally related groups. It was first applied in the late 1990s and has become an important device to elucidate patterns hidden in the expression data for an enhanced understanding of functional genomics. It reveals internal structures and identifies patterns in a data set applying an unsupervised learning approach [9].
The k-means clustering of the normalized dataset was carried for further investigation value of K was set 10% of the total number of genes present in both experimental conditions. The method resulted in a variety of clusters comprising genes having similar functions. Hierarchical clustering was further performed for both the conditions to assure whether both these clustering methods contain clusters with similar genes. The cancerous genes retrieved from the Breast Cancer gene database [10] were mapped in the clusters.
Differentially Expressed Genes (DEGs):
Differentially expressed genes with significantly different expression levels in the two conditions were identified [11]. These genes are relevant to identify potential drug targets and biomarkers. The expression pattern of genes in each cluster were plotted to explore their differential expression (Figure 1 & Figure 2).
Figure 1.
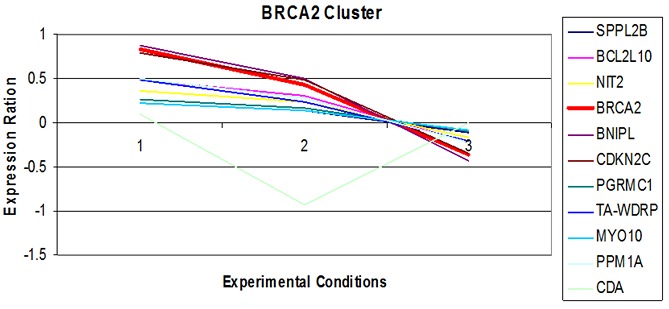
Expression pattern of BRCA2 in ER starved data files.
Figure 2.
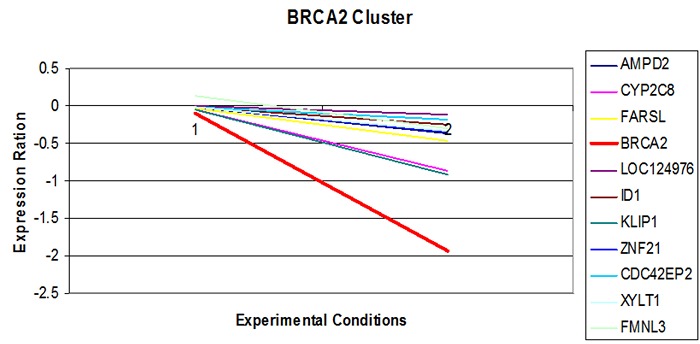
Expression pattern of BRCA2 in Tamoxifen treated data files.
Gene Interaction Map (GIP):
Interaction maps of differentially expressed genes were constructed with Cytoscape 2.8.0 [12], software for network analysis and visualization. Union of the networks was performed to end up with a vastly connected interactome of cancerous and non-cancerous genes forming an extremely linked hub.
Gene ontology studies:
The understanding of the complex biological process from differential expression of genes was obtained through a computational approach that determines the Gene Ontology (GO) terms for the categories biological process, cellular component and molecular function. The method takes a list of differentially expressed genes and uses a statistical measure to identify the GO terms that are over or under represented [13]. Functional characterization of the novel genes with their Gene Ontology was identified through BiNGO [14], a plug-in of cytoscape. BiNGO does a hyper geometric test using the Benjamini Hochberg False Discovery Rate (FDR) correction method to analyze the over representation of the GO categories. The test yields p-values indicating significant genes.
Results and Discussion
The proposed methodology is illustrated on a subset of a microarray study of Breast Cancer data.
Analysis of Expression Pattern of Genes:
The K-mean clustering resulted in clusters containing the genes having similar or related functions. The expression of the genes were analyzed by setting the criterion that one cluster must share at most 4 to 15 genes. The analysis came up with the number of genes that have been up and down regulated simultaneously Table 1 (see supplementary material). Such a group of genes which follows the similar expression pattern are referred to as co-expressed. Applying the expression values of genes and experimental conditions for a particular cluster, a gene expression plot (Figure 1 & Figure 2) have been created which shows the expression pattern of the genes belonging to that cluster, Y-axis of this plot shows the variation in gene expression level (Expression ratio), X-axis shows the ID of different experiments which were performed at different experimental conditions. These plots shows that according to time period and provided experimental conditions, the expression level of gene changes and this change becomes observable. This fluctuation seems to be same for most of the genes that are in same cluster and are known as co-expressed genes. Analysis of expression profiles from psoriasis patients discovered various novel targets based on their topological properties and suggests the development of network-based approach for the treatment of wide range of diseases [15].
Figure 1 shows the expression pattern of gene, BRCA2, responsible for Breast Cancer in Estrogen-Receptor Starved data with other co-expressed genes. It was observed that the gene is over-expressed when the cells are starved of Estrogen Receptors for 48 hours and after that are supplemented with the Receptors. Other genes are also showing the same pattern accept the gene CDA which is under-expressed. Figure 2 shows the expression pattern of gene BRCA2, responsible for Breast Cancer, in Tamoxifen treated data with other co-expressed genes. It was observed that the gene is highly under-expressed when the cells are treated with different concentration of drug; other genes are also showing the same pattern. Expression and network based studies has revealed perturbation in the four novel significant pathways in type 2 diabetes [16].
Analysis of Gene Interaction Map:
The approach of reductionism has influenced science over the past two centuries and has furnished insights about the components of the living organisms but has failed to explain the complex interactions of these components. The substitute of the divide and conquer method that has gained recent attention known as systems biology uses an integrative approach that combines high throughput tools, computational and mathematical models to solve a problem [17]. Rapid advances in the tools of network theory have increased the focus on the study of molecular interactions to better understand the dynamics of a cell. Protein interaction networks were used to identify potential drug targets in the resistant strains of Mycobacterium Tuberculosis. Incorporation of such concepts into medicine may enhance its therapeutic potential [18].
Biological networks are scale free that is they follow a power law distribution [19]. A Gene Interaction Map is an undirected graph G (N, E), which constitutes of number of nodes N and edges E. The degree of a node is the total number of nodes adjacent to a given node. The network of the 62 differentially expressed cancerous genes was constructed where the reference gene is centered by all other genes. Figure 3(a) shows interaction network of the gene AKT2, the circles and lines indicates the nodes and edges. An edge is drawn if both genes, say A and B, participate in an interaction and the reaction is undirected. Figure 3(b) shows interaction network of the gene PTP1B. These interaction networks were further merged and the common genes, the genes that interact with all other Breast Cancer Genes but are not responsible for the disease, were located by performing the union. Figure 3(c) shows the merged network of the genes AKT2 and PTP1B; both the networks are linked with three nodes shown by yellow color. The two nodes represent the genes ESR1, AKT1 which are responsible for Cancer and the third node represent the gene GSK3RB which interacts with both the genes in some process but is not responsible for the disease. Therefore any alteration in this gene or the pathway in which it interacts with other genes can make it a cause for the disease. All the genes are merged in the same manner and the common genes were found out. Total of 38 genes (Figure 4) were determined that interact with the Breast Cancer genes and these genes can be considered as biomarkers for Cancer.
Figure 3.
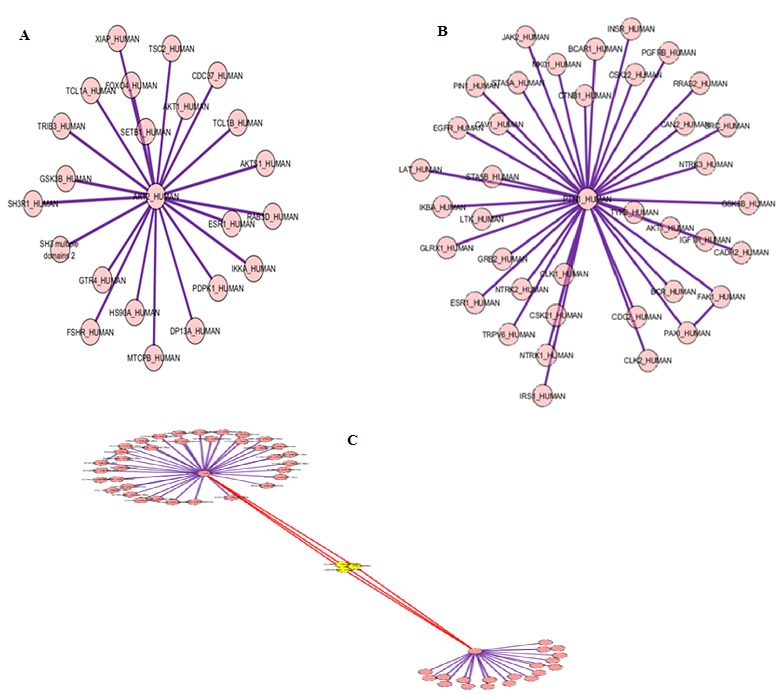
(A) Interaction network of cancerous gene AKT2; (B) Interaction network of cancerous gene PTPIB; (C) Merged network of cancerous AKT2 and PTP1B.
Figure 4.
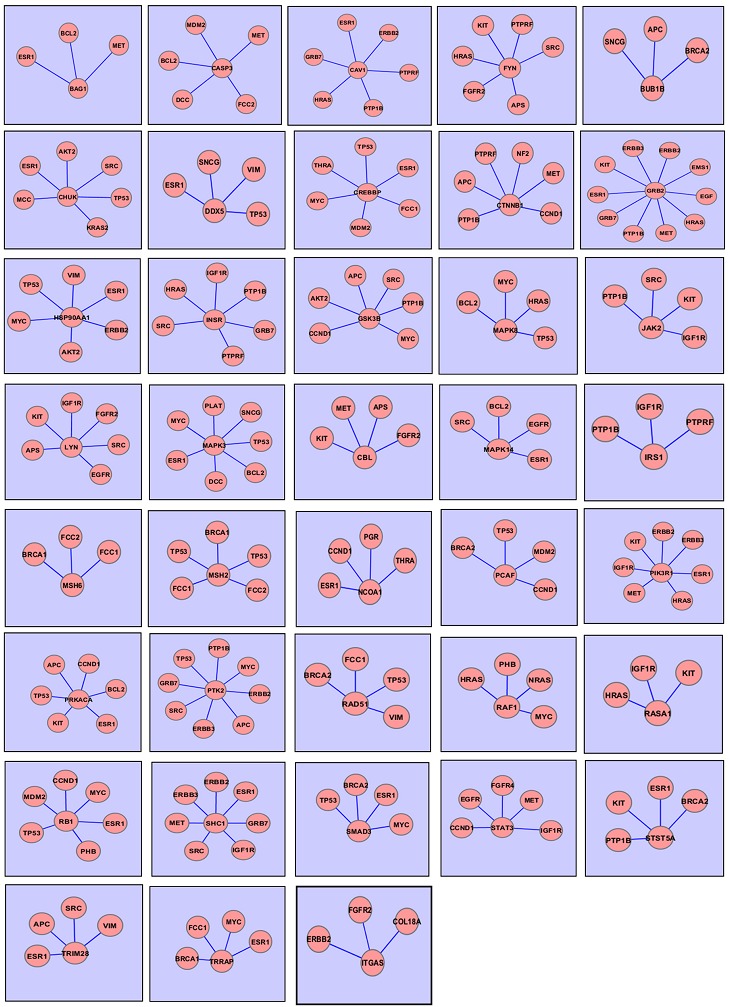
Union of interaction networks showing cancerous gene as the central node
Analysis of Interaction Network of Cancerous and Non-Cancerous Genes:
The integration of high throughput expression profiles and clinical data leads to the development of diseased networks that allows an extensive knowledge of the disease and its pathways [20]. The network comprises of total 83 genes (Figure 5) of which 12 more genes were verified as cancerous from curated literature based information, 45 consisted of the Breast Cancer Genes and 26 were novel genes that were correlated with cancerous genes. When the interaction network of the Breast Cancer and Novel Genes was analyzed it was observed that most of the Breast Cancer genes like TP53, SRC, ERBB2, ESR1, BCL2, IGF1R, KIT, PTP1B, MET, HRAS, MYC are extremely interacting with the reported genes PIK3R1, GRB2, HSP90AA1, MAPK3, IRS1, NCOA1, CAC1, PTK2 and with the novel genes MAPK14, CASP3, INSR, CREBBP, STAT3, STST5A and CHUK.
Figure 5.
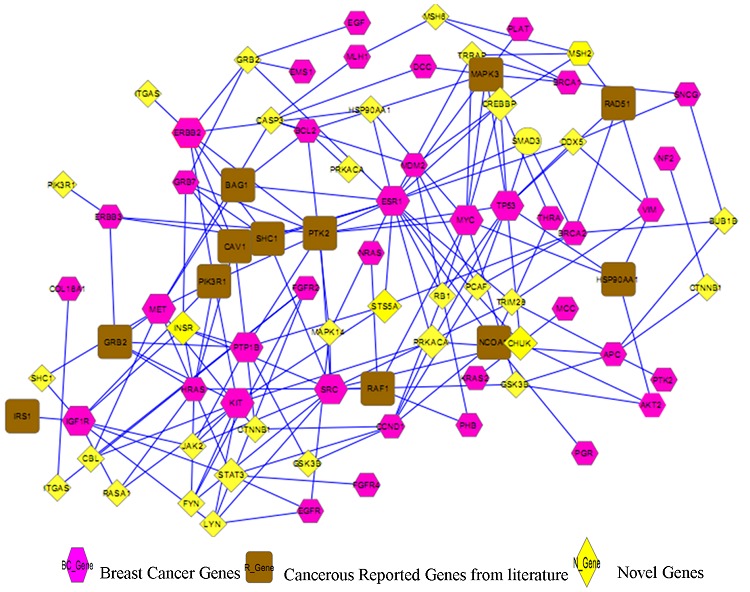
Gene Interaction Map of cancerous and non-cancerous genes.
The idea of Gene Ontology (GO) has been utilized to examine breast cancer datasets (Draghici, 2003). The categories that are significantly overrepresented in the GIP comprising differentially expressed cancerous genes connected with the non-cancerous were obtained by statistical analysis employing hyper geometric test. The test calculates the significance value i.e., p-value for each category Table 2 (see supplementary material). The p-value indicates the probability that a gene is significant not by chance keeping the value of FDR at the significance level of 0.05. It was found out that majority of the Breast Cancer genes were involved in 5 main functions particularly enzyme binding, receptor signaling protein activity, signal transducer, molecular transducer and transcription regulator activity. Further it was determined that the 12 novel but reported genes are also involved in the same function as the cancerous genes with some other significant functions that is to say nucleotide binding, phosphotransferase activity, alcohol group as acceptor, transcription cofactor activity.
Also, examining the functions and pathways of the novel genes, we found that the 3 novel genes INSR, CREBBP and CHUK are also involved in the same function as Breast Cancer and Reported Genes. Thus, we may conclude that our novel genes INSR, CREBBP and CHUK can also be said to be responsible for the disease. The gene STS5A is highly interacting with the cancerous genes ESR1, KIT, PTP1B, and BRCA2. But, till now no functions and pathways are clearly determined for this gene, which can further be understood with animal model studies of knocking in and out.
Conclusion
An important goal in cancer research is the mapping of pathways that are responsible for the emergence and progression of the disease. The analysis of expression pattern of genes involved in a disease using microarray data analysis is of paramount importance as it imparts a snap-shot of global expression pattern of the genes and the approach is used for the identification of cancer biomarkers and therapeutic targets. We can also figure out which cellular systems, (signaling) pathways and/or cellular compartments are targeted by a set of genes, i.e. the identification of processes in the cell that are deregulated or altered in consequence of differentially expressed genes. The application of network-based approach identifies makers as sub networks taking into account the information of other interacting partners that are not differentially expressed. Analysis of the GIP suggests that the genes INSR, CREBBP and CHUK were found to be highly interacting with the breast cancer genes TP53, SRC, ERBB2, ESR1, BCL2, IGF1R, KIT, PTP1B, MET, HRAS, MYC and were also involved in the same pathway and function hence, these genes can also be responsible for the cancer. The gene STS5A is found to be interacting with the breast cancer genes for which no function and pathway has been known yet. Hence, integration of genome wide expression data and the properties of systems biology may have an impact on the future of medicine.
Supplementary material
Footnotes
Citation:Chand & Alam, Bioinformation 8(23): 1132-1138 (2012)
References
- 1.A Amin. Int J Cancer Res. 2009;5:12. [Google Scholar]
- 2.T Itoh, et al. Mol Cancer Res. 2005;33:203. [Google Scholar]
- 3.TR Golub, et al. Science. 1999;286:531. [Google Scholar]
- 4.DM Reif, et al. Cancer Inform. 2007;5:19. [PMC free article] [PubMed] [Google Scholar]
- 5.M Hecker, et al. Biosystems. 2009;97:86. [Google Scholar]
- 6.AC Ahn, et al. PLoS Med. 2006;3:e208. [Google Scholar]
- 7.BM Bolstad, et al. Bioinformatics. 2003;19:185. [Google Scholar]
- 8.AA Alizadeh, et al. Nature. 2000;403:503. [Google Scholar]
- 9.MB Eisen, et al. Proc Natl Acad Sci. 1998;95:14863. [Google Scholar]
- 10.RA Baasiri, et al. Oncogene. 1999;18:7958. doi: 10.1038/sj.onc.1203335. [DOI] [PubMed] [Google Scholar]
- 11.C Wei, et al. BMC Genomics. 2004;8:5. [Google Scholar]
- 12.MS Cline, et al. Nat Protoc. 2007;2:2366. doi: 10.1038/nprot.2007.324. [DOI] [PMC free article] [PubMed] [Google Scholar]
- 13.S Draghici, et al. Genome Res. 2007;17:1537. doi: 10.1101/gr.6202607. [DOI] [PMC free article] [PubMed] [Google Scholar]
- 14.S Maere, et al. Bioinformatics. 2005;21:3448. [Google Scholar]
- 15.Z Dezso, et al. BMC Syst Biol. 2009;23:3. doi: 10.1186/1752-0509-3-23. [DOI] [PMC free article] [PubMed] [Google Scholar]
- 16.U Sengupta, et al. PLoS ONE. 2009;4:e8100. doi: 10.1371/journal.pone.0008100. [DOI] [PMC free article] [PubMed] [Google Scholar]
- 17.AL Barabasi, ZN Oltvai. Nat Rev Genet. 2004;5:101. doi: 10.1038/nrg1272. [DOI] [PubMed] [Google Scholar]
- 18.MP Raman, et al. Bioinformation. 2012;8:403. [Google Scholar]
- 19.PK Kreeger, DA Lauffenburger. Carcinogenesis. 2010;31:2. [Google Scholar]
- 20.S Draghici, et al. Genomics. 2003;81:98. [Google Scholar]
Associated Data
This section collects any data citations, data availability statements, or supplementary materials included in this article.


