

Abstract
How did geographic and occupational mobility after the Civil War differ between Union Army veterans and nonveterans? By 1880, Union veterans were more likely to migrate to a different state or region than nonveterans. The higher geographic mobility of veterans is likely attributable to their experience of traveling away from their hometowns while in service. Union veterans who held unskilled jobs prior to enlistment were more likely to move up to white-collar or farming jobs by 1880 than unskilled nonveterans. In contrast, unskilled veterans were less likely to become artisans than nonveterans. The differences in occupational mobility by veteran status might be explained by the effects of military experiences such as learning from comrades in the company.
Keywords: migration, occupational mobility, Union Army, veteran, training, peer effect
1. Introduction
How did the American Civil War affect the lives of men who served in the military and survived the conflict? More specifically, how did Civil War veterans perform in the labor market compared to nonveterans? This article studies the geographic and occupational mobility of Union Army veterans and nonveterans who are linked in samples that span 1860 to 1880. Wartime military service could have affected post-war outcomes in several ways. A few survivors returned home enfeebled by the damage to their physical and mental health, which would have hampered their economic progress. Interruptions of human capital accumulation in the family, schools, or civilian jobs due to military service would have also adversely affected the productivity of veterans. On the other hand, some veterans might have had opportunities to acquire valuable information, knowledge, and skills while in service which they could not have been able to obtain in civilian society at the time.
Although the Civil War has drawn a great deal of scholarly attention, perhaps more than any other event in American history, the answer to the question raised above is not apparent. As a prominent social historian lamented, “Very little has been published on civilian life in the North or the South during the war years, and almost nothing is available on the postwar life course of Civil War veterans” (Vinovskis 1990, pp. 1–2). Descriptive sources such as letters from and diaries of Civil War soldiers provide some useful hints about their lives prior to and after the war, but drawing a general picture from various anecdotes is difficult.
Much more has been learned over the last decade about the wartime experiences and civilian lives of Civil War soldiers as micro longitudinal data on Union Army (UA, hereafter) veterans became available. A number of recent studies have suggested that particular types of events while in service significantly influenced the veteran’s labor-market outcomes after service, based largely on studying the veterans with heterogeneous wartime military experiences. For example, wartime wounds and diseases strongly lowered post-service wealth accumulation and geographic mobility of the veterans; the distance of military deployment while in service was positively related to geographic mobility after the war; and higher-ranked servicemen and those who served on particular military duties were more likely to enter white-collar occupations after they were discharged from the service. Based on these works, however, it is difficult to determine how the post-war outcomes of the veterans as a whole differed from those of the nonveterans.
The most serious difficulty confronted by studies on the effect of veteran status is the potential selection bias problem arising from the fact that entrants to the military could differ from the rest in unobservable characteristics. This study tackles this selectivity issue by looking into the experiences of the UA soldiers who were not much different from men who did not serve during the war in particular aspects of military experiences, such as traveling away from home and learning from peers formerly employed in elite occupations. These soldiers were perhaps similar to nonveterans in terms of the impact of military service even though they were selected into the military just like other veterans. If these veterans who were least affected by military service were similar to nonveterans in terms of postwar mobility, then the socioeconomic differences by veteran status likely arose through the effects of military experiences rather than selections. This paper is distinct from the recent studies based solely on samples of Civil War soldiers (Costa and Kahn 2008; Lee 2005, 2007, 2008) in that it explicitly compares various measures of postwar economic mobility between veterans and nonveterans.
The results of the present study suggest that, by 1880, Union veterans were more likely to migrate to a different state or region than nonveterans. The higher geographic mobility of veterans is probably attributable to their experience of traveling from their hometowns while in service. Union soldiers who held unskilled jobs prior to enlistment were also more likely than unskilled nonveterans to become white-collar workers and farmers by 1880. On the other hand, unskilled Union veterans were less likely than nonveterans to enter artisanal jobs. The differences in occupational mobility by veteran status can be explained by the effects of military experiences such as learning from comrades in the company, rather than an outcome of selective recruitment of soldiers.
2. Background and Motivations
This study is related to the literature on the extent of and long-term trends in economic mobility in the United States. Recent studies have suggested that 19th-century America was an exceptionally mobile society. Ferrie (2005) and Ferrie and Long (2007) suggested that measures of geographic mobility and intergenerational changes in occupation in 19th-century America were higher than those of the United Kingdom at the time and of the US today. The high social mobility in the US attracted a great mass of immigrants from the Old World during the era of mass migration and is believed to have contributed to rapid economic growth.
The effect of major wars on U.S. economic mobility is not fully understood despite abundant literature on the subject. Some consequences of a war, such as physical and human losses, military mobilization, disruptions of economic activities, and various distortions due to wartime controls, could influence individual decisions about investment in human capital in the forms of migration and occupation change. A war could also affect the course of economic mobility of individuals who serve in the military, as explained above, by adversely affecting their health, interrupting the process of their human capital accumulation in a civilian society, and exposing them to events that could only be experienced while in service.
A number of recent studies suggest that wartime experiences radically changed the course of veterans’ lives. Wounds and diseases suffered by UA veterans while in service diminished their wealth accumulation and geographic mobility, perhaps by lowering their physical productivity (Lee 2005, 2008). The wartime experience of being deployed to distant regions increased veterans’ post-service geographic mobility, probably by offering them more information about other places and reducing psychological resistance to moving to a new territory (Lee 2008). Among the recruits who were unskilled workers at the time of enlistment, commissioned and non-commissioned officers were much more likely to move up to a white-collar job by 1880 (Lee 2007). Similarly, unskilled recruits assigned to white-collar military duties were more likely to enter a white-collar occupation by 1880 (Lee 2007). Deserters, especially those from pro-war communities, were more likely to move out of their home states than non-deserters, perhaps because of shame and ostracism (Costa and Kahn 2008).
Learning from peers and accumulation of social capital in the course of military service affected post-service socioeconomic outcomes, too. Military service during the Civil War was generally beneficial for the civilian careers of ex-slaves because they gained new skills in regimental schools and a wider knowledge of the world in army service (Berlin, Reidy, and Rowland 1998). In particular, the war experience of serving with a more heterogeneous group of peers had a favorable effect on the economic mobility of black UA soldiers after the war (Costa and Kahn 2008). Social connections with former Civil War comrades led Union veterans to live close to one another (Burton 2009). Laschever (2009) found that the employment of World War I veterans in 1930 was positively affected by the postwar employment of their peers who served in the same company.
The current paper is distinct from the recent studies on the topic introduced above in that it explicitly compares various measures of economic mobility after the war between veterans and nonveterans. To the best of my knowledge, this is the very first attempt at making such a comparison. The existing studies are all based on samples of veterans, examining whether the post-service outcomes of veterans with a particular type of wartime experience differed from those with no such experience. Thus, based on these works, it is difficult to determine how the experiences of the veterans as a whole differed from those of the nonveterans. For this reason, the present study is expected to offer new evidence as to how military service changed the lives of individuals who would have had a different life course had it not been for the war.
The present study is also related to the extensive literature on the economic effects of veteran status in the labor market. The major focus of studies on this issue produced so far has been to estimate the differences in employment and earnings between veterans and nonveterans.1 The most serious difficulty confronted by studies on this issue is the potential selection bias problem arising from the fact that entrants to the military could differ from the rest in unobservable characteristics such as health. Many of the studies introduced above have employed various methods to correct the potential selection bias arising from the fact that veterans are both self-selected and screened by the military.2
The data on Civil War veterans offer a unique opportunity to examine the effect of military service on economic status while mitigating this kind of selection bias for the following reasons. First, the bias arising from selective enlistment should be less serious during the Civil War than in recent wars, such as the Vietnam War, because nearly 40% of men of military age joined the armed forces during the Civil War and most of them volunteered out of patriotism. More importantly, the data used in this study provide rich information on the military careers of Union soldiers, such as rank, military duty, and wartime wounds and illnesses. The characteristics of each unit (such as the occupational composition of each company) and the detailed descriptions of the military events the Union soldiers experienced can also be drawn from the data. Thanks to the richness of the data, which will be discussed in detail below, it is possible to identify the UA soldiers who were not much different from the men who did not serve during the war in particular aspects of military experiences. These soldiers were perhaps similar to nonveterans in terms of the impact of military service even though they were selected into the military just like other veterans. These unique features of the data enable me to tackle the selectivity issue by looking into the experiences of the veterans least affected by their military service. The data used in this study also provide a chance to address not only the question of how economic mobility differed between veterans and nonveterans, but also the issue of what produced the differences in economic status by veteran status.
3. Data and Methods
3.1. Framework for Estimation and Data
For this research, longitudinal data on veterans and nonveterans providing information about their economic mobility shortly after the war are desired. A longitudinal sample of UA veterans linked across the 1860 and 1880 censuses can be used to estimate measures of mobility for veterans (referred to as the “veteran sample”).3 However, currently available random samples linked across the 1860 and 1880 censuses, where veterans and nonveterans are mixed, do not allow us to identify veteran status. Thus, measures of economic mobility of nonveterans are estimated based on the method explained below, utilizing a random sample of white young males linked across the 1860 and 1880 censuses constructed by Joseph Ferrie (the “random sample,” hereafter)4 along with the veteran sample. The UA veteran and random samples linked across the 1860 and 1880 censuses are comparable because they were constructed in a similar manner.5
A measure of economic mobility (e.g., the probability of migration) of a cohort of the northern male population between 1860 and 1880, denoted as PUS, can be written as a weighted average of the measures of mobility of UA veterans (PUA) and nonveterans (PNV), as given below.
| (1) |
PUS and PUA can be computed, respectively, from the random and veteran samples. The proportion of UA veterans (the weight denoted as ωUA) can be estimated from published records on population and military enrolment as well as micro samples of the 1860 census and of UA soldiers, as explained in the appendix. The estimated value of the UA weight is 0.552 for ages 15 to 24 years. In the balance of this paper, this number will be applied to the analyses as the weight of UA veterans. The mobility measures of nonveterans (PNV) can be estimated by solving the above equation.
3.2. Sample Selection
According to the rules related to war mobilization during the Civil War, military service age was between 18 and 40 years. Thus, in principle, males aged 13 to 45 years in 1860 were at risk of serving in the UA. In this study, the random sample used includes individuals aged 25 years or younger. Thus, males aged 13 to 25 years would make the largest possible sample that can be utilized for comparing veterans and nonveterans. In the analysis, a sample of white males aged 15 to 24 years in 1860 (according to the age reported in the 1860 census) was selected to make the sample comparable to the entire white male population reported in the published census for each five-year age interval. With the vast majority of Union soldiers having enlisted at ages 18 to 25 years, this age interval includes a large fraction (57.3%) of the veterans in the entire sample.
For proper comparison, the random sample was limited to the persons who resided in the northern and border states that furnished men to Union troops, including California, Connecticut, Delaware, District of Columbia, Illinois, Indiana, Iowa, Kansas, Kentucky, Maine, Maryland, Massachusetts, Michigan, Minnesota, Missouri, New Hampshire, New Jersey, New Mexico, New York, Ohio, Pennsylvania, Vermont, West Virginia, and Wisconsin. Although Rhode Island was a Union state, it was excluded from the sample because the current veteran sample does not include any company from there.
As a consequence, 4,382 northern white males aged 15 to 24 years in 1860 linked across the 1860 and 1880 censuses were selected into the sample to be used in the study. Of them, 2,636 men were drawn from the random sample and 1,746 from the veteran sample.
3.3. Military Experiences versus Selection
The final element of this paper’s method is related to the strategy to determine whether any differences between veterans and nonveterans resulted from “treatments” of military service or from selective entry of individuals into the military. The first hypothesis (which will be referred to as military experience hypothesis) states that wartime events, which could only be experienced while in service, differentiated veterans from the rest. An alternative hypothesis (the selection hypothesis, hereafter) suggests that different people were selected to join the UA.
The strategy for testing these two hypotheses employed in this paper can be illustrated as follows. Let M denote the index of military service (1 if selected into the military, 0 if otherwise). I select a particular type of military experience (denoted as T, 1 if treated, 0 if otherwise) that strongly affects a given measure of post-service socioeconomic mobility (denoted as P), which not all servicemen have experienced while in service. This index of military experience (T) should be uncorrelated with unobservable individual characteristics related to selection into the military (T is orthogonal to M).
Suppose that the measure of socioeconomic mobility turns out to be greater for veterans than for nonveterans (P[M=1] > P[M=0, T=0]). If the military service hypothesis is true, veterans without treatment should be similar to nonveterans in terms of mobility (P[M=1, T=0] = P[M=0, T=0]). If the selection hypothesis is true, on the other hand, veterans without treatment should be similar to veterans with treatment in terms of mobility (P[M=1, T=0] = P[M=1, T=1]).
In the regression framework employed in the balance of this paper, the UA veterans are actually compared with the individuals drawn from the random sample, about half of whom are veterans themselves, and not directly with the nonveterans. Even with this limitation, the direction of the effect of veteran status can be determined easily. If men from the veteran sample were more mobile than men from the random sample, for example, veterans should be more mobile than nonveterans. Even the magnitude of the difference between veterans and nonveterans can be calculated by solving Equation 1 as explained above, where a simple dummy variable indicating a person was drawn from the veteran sample and was included in regression. However, the statistical significance of the difference in the measure of mobility between veterans and nonveterans cannot be determined. If the veterans’ mobility was significantly different from that of men drawn from the random sample (including both veterans and nonveterans), the estimated difference between veterans and nonveterans is also likely to be statistically significant. On the other hand, if the difference in a measure of mobility between men drawn from the two samples is statistically insignificant, whether the difference between veterans and nonveterans is statistically significant cannot be determined.
4. Geographic Mobility
4.1. Veteran Status and Geographic Mobility
Migration may be viewed as a type of investment that entails cost but produces a stream of returns (Sjaastad 1962; Mincer 1978). According to the human capital theory of migration, the extent and patterns of geographic mobility are determined by the elements of the expected costs and benefits of migration. Wartime military service could affect these migration decisions by exposing the soldiers to some experiences that they would not have gone through if they did not enlist. However, it is unknown whether Civil War military service significantly changed the geographic mobility of servicemen, and if so, what the direction of the effect was.
I begin with a simple comparison of geographic mobility from 1860 to 1880 by veteran status. The measured rates of migration will depend heavily on the size of the geographic units used; hence, three measures of geographic mobility between 1860 and 1880 are used, namely, the probabilities of inter-county, inter-state, and inter-region migrations. These measures of mobility between nonveterans (denoted “Nonveterans”) and veterans (denoted “Veteran 1”) are compared in the first two vertical bars in Figure 1, where the probability of migration for nonveterans is normalized to 100. Veterans were revealed to be about 40% more likely to move to a different state and 32% more likely to migrate to a different region between 1860 and 1880 than nonveterans. 6 The result remains little changed even if personal characteristics such as age, occupation, nativity, and household wealth are held constant, as presented by the last vertical bar labeled “Veteran 2.” In sum, UA veterans were more likely to migrate to a different state or region by 1880 than nonveterans, and the magnitude of the difference by veteran status was substantial.
Fig. 1. Measures of Geographic Mobility between 1860 and 1880: Comparison between Union Army veterans and Nonveterans.
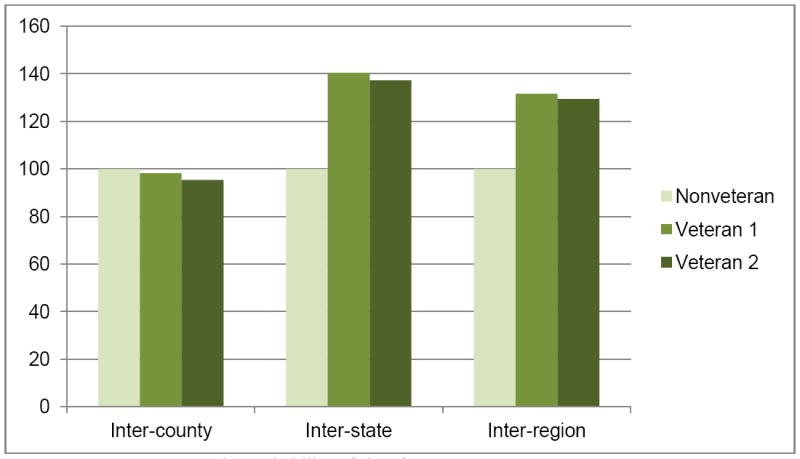
Note. “Veteran 1” denotes the probability of the given type of migration of UA veterans relative to that of nonveterans (=100); “Veteran 2” denotes the same relative probability that was estimated with personal characteristics (age, nativity, family wealth, and occupation) held constant.
4.2. Military Experience versus Selection: Wartime Geographic Transfers as an Index of Treatment
Why were veterans geographically more mobile than nonveterans after the war ended? This could perhaps be explained in two different ways. First, wartime experiences made the veterans more mobile (“military service effect”), and second, more mobile persons were selected into the UA (“selection effect”). An example of the military service effect is the greater knowledge and information about other places and migration itself that wartime geographic moves provided the veterans (Lee 2008). Civil war military service was an eye-opening experience for many recruits who had never been away from their hometowns. In the course of their journey to the front by train and moving to the battlefields on foot, servicemen had opportunities to gather first-hand information about other cities and knowledge about major routes and transportation systems. The highly mobile and precarious wartime military life could have changed soldiers’ preference for migration by making them more accustomed to the hardships that frequently confronted migrants at the time.7
An alternative explanation for the geographic mobility was due to the unobservable heterogeneity resulting from selective recruitment of the UA. For example, healthier individuals based on the results of medical examinations were more likely to be selected into the UA while less healthy men were rejected.8 Fearless men might also have been more likely to volunteer for the service than more risk-averse peers.
Determining how much of the differences in geographic mobility between veterans and nonveterans were attributable to unobservable individual heterogeneity is difficult. However, it is possible to gauge which of the two hypotheses given above is more plausible by exploiting the fact that the military experiences of Union veterans were greatly heterogeneous across soldiers. There were a few Union soldiers whose military experiences in a particular aspect were similar to nonveterans. Thus, it may be possible to identify veterans for whom the selection effect exists but whose military service had relatively small effects.
In this study, geographic transfer of veterans while in service is considered as an index of military service effect on post-service migration decisions. The distance and patterns of geographic moves while in service differed greatly from regiment to regiment. A unique feature of the geographic mobility of soldiers, which is useful for the purpose of this analysis, is that it was determined largely by the orders of higher-ranking officers, unrelated to the soldier’s decision. Most recruits did not choose their military units because they were normally enlisted in a regiment organized near where they lived along with other men from their community. The enlisted men were sent to the place where their regiments were ordered to go. Thus, it is likely that geographic transfers while in service largely capture the military service effect, uncorrelated with unobservable individual characteristics.9 The measure of geographic mobility while in service considered in this study is based on how far the veteran ever moved from his place of origin.10 The underlying rationale for using the measure is that the distance traveled can influence the mover’s cognition of other places, general knowledge about the passage, attitude toward risk, and preference for relocation (Lee 2008).
A simple comparison of men in the random sample and subgroups of UA veterans classified by the distance travelled while in service strongly supports the military service hypothesis over the selection hypothesis. For example, the UA veterans who remained in the state where they were enlisted throughout their service were remarkably similar to nonveterans in terms of the probabilities of inter-state and inter-region migrations. In contrast, veterans who were particularly mobile while in service (veterans who belong to the top 20% of the distribution in terms of how far they moved) were 68% more likely to migrate to a different state and 62% more likely to migrate to a different region by 1880 than nonveterans.
Logistic regressions were performed to examine the effect of wartime geographic transfers on the probabilities of migration of UA veterans compared to men drawn from the random sample. A dummy variable on the UA sample (1 if drawn from the UA sample, and 0 otherwise) as well as the interaction term of the UA sample dummy and the log of the distance traveled while in service plus one are included in the regressions along with variables on personal characteristics (age, nativity, family wealth, and occupation).11 The distance of geographic transfer while in service could be correlated to the place of origin; thus, dummy variables pertaining to the state of residence in 1860 were also added. The estimated marginal effect of the UA sample dummy shows the magnitude of a counterfactual difference in post-service geographic mobility between the UA sample and the random sample if all UA veterans had remained in the state where they were enlisted (thus gaining no knowledge or information regarding geographic relocation). This coefficient plus the coefficient for the interaction term times the distance traveled while in service provides the magnitude of the advantage of a veteran who traveled a certain distance over the white male military-age population at large.
The results presented in Table 1 confirm the argument that the higher geographic mobility of Union veterans is explained better by the influences of wartime experience, and not by the differences in observable or unobservable individual characteristics. Among all three measures of post-service geographic mobility, the geographic transfers while in service strongly increased the probability of migration after service. As suggested by the significant and negative coefficient on the UA sample dummy variable, the veterans who stayed in the state of enlistment (UA sample dummy = 1 and the interaction term = 0) were less likely to migrate than men in the random sample.
Table 1.
Logistic Regressions: Military Experiences and the Probabilities of Migration between 1860 and 1880
| Independent Variable | Mean | (1) Probability of Inter-County Migration (Mean = 0.594) |
(2) Probability of Inter-State Migration (Mean = 0.356) |
(3) Probability of Inter-Region Migration (Mean = 0.261) |
|||
|---|---|---|---|---|---|---|---|
|
| |||||||
| ∂P/∂x | P-value | ∂P/∂x | P-value | ∂P/∂x | P-value | ||
| UA sample | 0.412 | -0.0999 | 0.0008 | -0.0957 | 0.0017 | -0.0791 | 0.0077 |
|
| |||||||
| UA sample*Log(distance+1) | 1.622 | 0.0171 | 0.0086 | 0.0244 | 0.0002 | 0.0201 | 0.0013 |
|
| |||||||
| 1860 Age | 18.653 | -0.0125 | 0.7654 | 0.0214 | 0.5926 | 0.0485 | 0.1958 |
|
| |||||||
| 1860 Age squared /100 | 3.552 | 0.0171 | 0.8748 | -0.0749 | 0.4698 | -0.1391 | 0.1530 |
|
| |||||||
| Natives | 0.886 | -0.1463 | <.0001 | -0.2253 | <.0001 | -0.1588 | <.0001 |
|
| |||||||
| Log(family wealth) | 6.574 | -0.0206 | <.0001 | -0.0173 | <.0001 | -0.0128 | <.0001 |
|
| |||||||
| Farmer | 0.123 | -0.0189 | 0.4432 | -0.0004 | 0.9879 | 0.0107 | 0.6245 |
|
| |||||||
| Skilled | 0.103 | 0.0580 | 0.0375 | 0.0299 | 0.2536 | 0.0111 | 0.6513 |
|
| |||||||
| Unskilled | 0.318 | 0.0043 | 0.8137 | 0.0045 | 0.7958 | 0.0083 | 00.6028 |
|
| |||||||
| State Dummy | Yes | Yes | Yes | ||||
|
| |||||||
| -2Log L with intercept: | 5837.390 | 5618.052 | 4944.800 | ||||
| -2Log L with intercept and covariates: | 5697.694 | 5194.699 | 4661.098 | ||||
| Chi-Square: | 186.065 | 353.888 | 265.473 | ||||
| P-value: | <.0001 | <.0001 | <.0001 | ||||
Note. Source is the pooled sample of U.S. white males and white Union Army soldiers linked across the 1860 and 1880 censuses. The number of observations used in the regression is 4,317. Omitted occupation category is “occupation not reported.”
This result suggests that without the opportunity for traveling to distant places, wartime military service would have diminished the geographic mobility of veterans. The loss of the opportunity to pursue a civilian career during the period of military service should be damaging to geographic mobility. Only the veterans who had travelled farther than a minimum distance were more likely to migrate than the men drawn from the random sample. If the estimated marginal effects reported in Table 1 are applied, the threshold distance in log miles is calculated as 5.842 (344.5 miles), 3.922 (50.5 miles), and 3.935 (51.2 miles), respectively, for inter-county, inter-state, and inter-region migration. About 68% of the veterans in the sample had moved more than 51.5 miles, whereas only 7% had travelled more than 344.5 miles.12 The results indicate that if the probability of long-distance migration is concerned, the positive effect of travelling while in service outweighs the negative effect of serving in the UA for the majority of UA veterans. On the other hand, in cases of short-distance migration, the advantages of travelling during the service were too weak to offset the disadvantages of military service itself. The benefits of wartime geographic transfer, such as learning added information about other places or passage, may not have offered stronger advantages in migrations within the state of origin of which both veterans and nonveterans had similar knowledge.
Military medical events could explain some of the negative effects of military service on geographic mobility. One out of three Union soldiers was wounded while in service, and two thirds of them succumbed to disease at least once (Lee 2003). It has been documented that wartime wounds and illnesses significantly diminished the geographic mobility of veterans after the war (Lee 2008). If only the “healthy” veterans who had not been wounded while in service were included in the regressions, the absolute magnitude of the negative coefficient on the UA sample dummy diminished substantially for inter-state and inter-regional migrations. These findings are consistent with the conjecture that the disadvantage of UA veterans in case of no wartime geographic mobility could be explained in part by the adverse impact of military service on health.13 However, the probabilities of the three types of migration were still lower for the veterans who remained in the state of enlistment than for the men drawn from the random sample. Even for “healthier” veterans, the effect of military service on geographic mobility could have been negative had there been no gains from the opportunities to travel to distant places while in service.
This study assumed that the geographic transfers of soldiers while in service were exogenously determined, not related to their choices or characteristics. However, if the earlier enlistees differed from those enlisted later in the war, and the former tended to travel more while in service than the latter, then the measures of wartime geographic mobility used in this study might, in part, capture some unobservable personal characteristics related to migration decisions. There is some evidence suggesting that white soldiers who enlisted in 1861 and 1862 differed from the later enlistees in terms of their motives for service and personal characteristics.14 Since the 1861 and 1862 recruits served longer than the men mustered in later, the former perhaps had more chances to be sent away from the place where they were enlisted. To examine whether these features of the UA drove the results obtained above, the 1861 and 1862 recruits drawn from the veteran sample (instead of the full veteran sample) and the men from the random sample were compared by employing similar regression analyses. The new results provide practically similar implications: Union veterans were more likely to migrate to a different state or region by 1880; veterans who remained in the state where they were enlisted were no more mobile than nonveterans; and the further the veteran traveled while in service, the higher the probabilities of his inter-state and inter-regional migrations. The magnitudes of the positive effect of wartime geographic transfers on post-service mobility were also similar if only the 1861 and 1862 enlistees were included.15
Geographic mobility while in service is employed in this study as an index of the military service effect based on the belief that post-service migrations were influenced strongly by the wartime experience of the same type. However, it is possible that geographic mobility after service was affected more by general military experiences and that geographic moves while in service were correlated with them. To evaluate this possibility, additional regression analyses similar to those presented in Table 1 are conducted wherein the length of military service was included along with the measures of wartime geographic transfers. The results show a strong positive relationship between the wartime geographic mobility and the post-service probabilities of migration even with controlled years of service.16 The estimated coefficients for the years of service are positive, but statistically insignificant.
5. Occupational Mobility
5.1. Veteran Status and Occupational Mobility
Clearly, the military would offer different types and qualities of training to a recruit compared to a civilian job had he not enlisted. The armed forces in the 19th century, such as the UA during the Civil War, were probably much less sophisticated in terms of technology and organization than the military today. 17 However, military service during the Civil War could have significantly influenced the servicemen’s accumulation of human capital. For example, the military provided servicemen, especially those appointed as officers and those assigned to white-collar military duties, with general white-collar skills (Lee 2007). A large fraction of UA recruits was composed of young men from small towns or isolated farms. Many of the UA recruits had never left their hometown before they were enlisted. Once mustered in, they were assigned to a company composed of about a hundred men, many of whom they had never met. All new enlistees had to adapt themselves to a military organization that was perhaps stricter and more hierarchical than any civilian organization. Soldiers of all ranks must be properly trained to follow military rules, communicate with other soldiers, and perform their duties. For many recruits, therefore, the UA was perhaps the biggest, most formal, and most hierarchical community they had ever been part of. Hence, military service during the Civil War could have served as a basic training course for human relations or management. Moreover, by joining a much larger and more heterogeneous community than the ones they belonged to prior to enlistment, the enlisted, especially the young and inexperienced, would have opportunities to learn from their peers in the same company.
To examine if wartime military service significantly affected the servicemen’s human capital accumulation, measures of occupational mobility between 1860 and 1880 are compared between veterans and nonveterans. Occupational change may be modeled as a type of investment in human capital to increase the present value of lifetime earnings. The chances that a person will switch occupations will depend on the difference between the anticipated rise in lifetime income (or social status) and the cost accrued to retraining. The cost and benefits of occupational change is hypothesized to differ between veterans and nonveterans because the former could be influenced by military service. The measure of occupational mobility employed in the present analysis is the probability that unskilled workers in 1860 (including tenant farmers) moved up to white-collar, farming (excluding tenant farming), and artisanal occupations by 1880.18
These measures of occupational mobility between nonveterans (denoted “Nonveterans”) and veterans (“Veteran 1”) are compared in the first two vertical bars in Figure 2, where the probability of occupation change for nonveterans is normalized to 100.19 The results suggest that unskilled UA veterans were 41% more likely to move up to white-collar occupations than unskilled nonveterans. Unskilled males with a military career were 20% more likely than nonveterans to become farmers. On the other hand, military service diminished the chances that an unskilled young man could acquire an artisanal job. The overall result does not change significantly even if personal characteristics such as age, nativity, and household wealth are held constant, as presented by the last vertical bar denoted as “Veteran 2.”20
Fig. 2. Measures of Occupational Mobility of Unskilled Workers between 1860 and 1880: Comparison between Union Army veterans and Nonveterans.
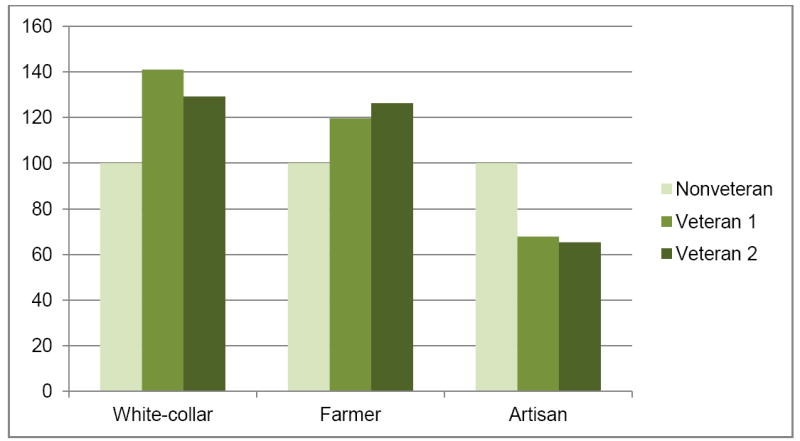
Note. “Veteran 1” denotes the probability of occupational mobility of unskilled UA veterans into the given category relative to that of unskilled nonveterans (=100); “Veteran 2” denotes the same relative probability that was estimated with personal characteristics (age, nativity, and family wealth) held constant.
5.2. Military Experience versus Selection: Peer Effect in the Military as an Index of Treatment
A possible pathway through which military service influenced occupational mobility of the Union veterans is the acquisition of knowledge from comrades in the same company. Frequent and casual contact with company men of diverse ages and professional careers could have provided young and inexperienced soldiers with knowledge and information regarding higher occupations. Costa and Kahn (2008) found that black Union soldiers from a company composed of men from more diverse backgrounds were more likely to migrate and to learn reading and writing after the service because of more learning opportunities from their peers.
In the current paper, the strength of peer effect is measured by the percentage of men who were formerly employed in a particular occupational category (white-collar workers, farmers, and craftsmen). The rationale for employing this measure is that more frequent contacts with peers from a particular civilian job increase the chances of gaining knowledge or skills that are useful for acquiring that occupation.
A simple comparison of men in the random sample and the subgroups of UA veterans classified by the percentage of men formerly employed in a particular occupation strongly suggests that learning in the military played a major role in the differences in postwar occupational mobility between veterans and nonveterans. For all three occupations, unskilled men who served alongside more peers who held a particular occupation were much more likely to move up to that occupation by 1880 than those who served in a company having fewer men from the profession. In particular, unskilled veterans in the companies belonging to the top 20% of the distribution in terms of the measure of peer effect were more likely to become farmers or artisans than nonveterans. However, the chances of moving up to farmers or craftsmen among veterans who served in the bottom 20% of companies were much lower than those of nonveterans.
Logistic regressions were conducted to investigate how the percentage of men in each company who were formerly engaged in a particular occupation affected the probability that the unskilled in the company moved up to the occupation by 1880 (see Table 2). A dummy variable on the UA sample (1 if drawn from the UA sample, and 0 otherwise) as well as the interaction term of the UA sample dummy and the percentage of a particular occupation are included in the regressions along with variables on personal characteristics. In addition, measures of occupational composition in the 1860 state (percentages of white-collar workers, farmers, and artisans) and regional dummy variables are included. The possibility that the percentage of peers formerly employed in a particular occupation for UA soldiers could merely reflect the occupational composition of the community they came from is considered. The estimated marginal effect of the UA sample dummy shows the magnitude of a counterfactual difference in occupational mobility between the UA sample and the random sample had there been no men in a given company who had held the occupation prior to the war (thus no learning pertaining to the occupation while in service). This coefficient plus the coefficient on the interaction term times the percentage of men with a particular occupation in a company gives the magnitude of an advantage (or disadvantage) veterans had over the white male population at large.
Table 2.
Logistic Regressions: Occupational Composition of the Company and the Probability of Occupational Change between 1860 and 1880 for the Unskilled
| Independent Variable | Mean | (1) White-collar (Mean = 0.130) |
(2) Farmer (Mean = 0.412) |
(2) Artisan (Mean = 0.122) |
|||
|---|---|---|---|---|---|---|---|
|
| |||||||
| ∂P/∂x | P-value | ∂P/∂x | P-value | ∂P/∂x | P-value | ||
| UA sample | 0.389 | 0.0087 | 0.7168 | -0.1391 | 0.0189 | -0.0851 | 0.0140 |
|
| |||||||
| UA*(% White-collar) | 2.603 | 0.0019 | 0.2977 | ||||
|
| |||||||
| UA*(% Farmer) | 21.537 | 0.0026 | 0.0067 | ||||
|
| |||||||
| UA*(% Artisan) | 7.317 | 0.0032 | 0.0105 | ||||
|
| |||||||
| 1860 Age | 19.171 | -0.0807 | 0.1616 | -0.0100 | 0.9031 | -0.0126 | 0.8292 |
|
| |||||||
| 1860 Age squared /100 | 3.735 | 0.1912 | 0.1964 | 0.0537 | 0.7980 | 0.0214 | 0.8867 |
|
| |||||||
| Natives | 0.859 | -0.0149 | 0.5611 | 0.0879 | 0.0225 | 0.0107 | 0.6788 |
|
| |||||||
| Log(family wealth) | 6.246 | -0.0007 | 0.8323 | 0.0163 | 0.0003 | 0.0001 | 0.9715 |
|
| |||||||
| % White-collar in 1860 state | 8.540 | -0.0089 | 0.3548 | ||||
|
| |||||||
| % Farmers in 1860 state | 31.381 | 0.0082 | <.0001 | ||||
|
| |||||||
| % Artisans in 1860 state | 15.289 | 0.0050 | 0.1919 | ||||
|
| |||||||
| Region Dummy | Yes | Yes | Yes | ||||
|
| |||||||
| -2Log L with intercept: | 1089.634 | 1906.217 | 1045.052 | ||||
| -2Log L with intercept and covariates: | 1094.726 | 1762.934 | 1031.341 | ||||
| Chi-Square: | 14.662 | 125.543 | 13.427 | ||||
| P-value: | 0.1449 | <.0001 | <.2008 | ||||
Note. Source is the pooled sample of U.S. white males and white Union Army soldiers linked across the 1860 and 1880 censuses who were unskilled workers in 1860. The number of observations used in the regression is 1,407. The occupational composition of each state was computed from the IPUMS of the 1860 census. White-collar workers include professionals, managers, officials, proprietors, and clerical workers; Tenant farmers and farm laborers are not counted as farmers.
For each of the three measures of post-service occupational mobility, the coefficient for peer effect (the interaction term) is positive, although statistically insignificant, for “White-collar” jobs. This result confirms that unskilled soldiers perhaps learned something from peer soldiers who had been employed in more elite occupations prior to enlistment, especially farming or craft jobs.21 For “Farmer” and “Artisan” (columns 2 and 3 of Table 2, respectively), the regression coefficient for the UA sample dummy is negative. This result suggests that, without learning from peers, the effect of military service on the probability of becoming a farmer would have been negative, and the disadvantage of veterans in the chances of entering an artisanal job would have been even worse. As in the case of geographic mobility, loss of opportunities for human capital accumulation as a civilian should have adverse effects on occupational mobility.22
The regression results show that only the unskilled veterans for whom learning from peers was strong enough to compensate for the negative effect of military service had higher chances of entering farming or craft jobs than the nonveterans. The threshold percentage of peers formerly employed in an elite occupation is 53.5% for farmers and 26.6% for artisans. These values were computed utilizing the estimated marginal effects reported in Table 2. About 57% of UA veterans in the sample served in a company in which the fraction of former farmers exceeded the threshold. In sharp contrast, only 19% of UA veterans were enlisted into a unit where former artisans accounted for more than 26.6%.23 This result offers an explanation for why unskilled UA veterans were less likely to enter a craft job than nonveterans, whereas they were more likely to become farmers. In the case of artisanal jobs, opportunities for learning from peers were perhaps too weak to offset the negative effect of military service such as the discontinuation of professional career and lost chances of taking apprenticeship.
The result for white-collar occupations is not consistent with the others. The peer effect represented by the coefficient for the interaction term is statistically insignificant. White-collar skills were perhaps too sophisticated to be transferred across soldiers through personal contacts in the military. There is also a possibility that the percentage of former white-collar workers in the company is a poor measure of peer effect because white-collar skills are more heterogeneous than those required in farming or artisanal jobs. Given that unskilled UA veterans as a whole were more likely to become white-collar workers after the service than nonveterans, it is possible that UA veterans received white-collar type training while in service through different ways. A possible example is serving in the military as a commissioned or non-commissioned officer, which may have offered good opportunities to develop communication, management, coordination, and decision-making skills while carrying out military responsibilities. Correspondingly, formerly unskilled enlistees assigned to military duties similar to white-collar civilian jobs could have mastered new skills while in the service.
Military rank or duty is not a good index of military treatment because military positions were not randomly assigned (Lee 1999). However, the results of analyses based on employing these indices (not reported in this paper) are at least suggestive. Unskilled Union soldiers who served on either a high rank or a white-collar/skilled military duty were much more likely to have a white-collar job in 1880 than average males. However, the majority of veterans who served in low military positions were no different from men belonging to the random sample in terms of the chances of having a white-collar occupation. Although not entirely convincing because of the potential selection bias problem explained above, the results suggest that the observed higher probability of moving up to white-collar jobs for veterans compared to nonveterans was attributable to the very strong advantages enjoyed by the minority of veterans holding higher military positions, and not by the positive selection in enlistment.
6. Conclusions
How did Civil War veterans perform in the labor market compared to nonveterans after they were discharged from the service? The geographic mobility of UA veterans, measured by the probabilities of inter-state and inter-regional migrations between 1860 and 1880, was significantly higher than that of nonveterans. Unskilled UA veterans were more likely to become white-collar workers or farmers than nonveterans. On the other hand, the probability of entering an artisanal job was lower for UA veterans than for nonveterans.
These differences by veteran status likely resulted from the impact of military experiences such as travelling away from their hometown and learning from peers in the company, rather than from the potential selections done in forming the army. This claim is supported by the facts that post-service mobility of veterans was strongly related to the distance traveled while in service, and that soldiers who had remained in the state where they enlisted were actually less mobile than nonveterans after the service. Similarly, a higher percentage of peers in the company formerly employed in a particular elite occupation was related positively to a higher mobility into the occupation of unskilled veterans.
Military service itself diminished the economic mobility of veterans, probably because it prevented them from pursuing a civilian career during the period of service. UA veterans outperformed nonveterans in a particular measure of economic mobility only if the positive effect of their military experiences was strong enough to dominate the negative effect of serving in the military.
Did UA veterans fare better than nonveterans in terms of economic mobility if they survived the war? The answer to this question depends on the measure of mobility. As far as the average is concerned, UA veterans, indeed, fared better than nonveterans for long-distance geographic mobility and occupational mobility of the unskilled to white-collar and farming occupations. However, for the unskilled who wished to enter skilled occupations, there were disadvantages associated with veteran status. Although not touched upon in this paper, the wealth mobility shortly after the war was likely lower for veterans than for nonveterans. Lee (2005) suggested that wounds, diseases, and wartime stress strongly diminished the wealth accumulation of UA veterans between 1860 and 1870, even after the differences in occupational changes and geographic relocations were taken into account. Nonveterans would have advantages in wealth mobility because they would largely be free from those physical and mental damages caused by wartime military service. Higher geographic and/or occupational mobility of veterans was likely to have reduced their savings at least in the short run because of the costs of relocation and retraining.
The average measures of mobility of UA veterans compared to nonveterans tend to mask their highly heterogeneous fates. Many surviving veterans returned home seriously wounded or weakened by diseases they suffered while in service. These health problems could dominate potential gains from wartime experiences for a few survivors because men who were physically unfit would be unable to migrate or to choose more demanding occupations. This paper also suggests that some UA soldiers did not have the types of experiences while in service that would enhance their economic mobility, and that the measures of economic mobility of these veterans were actually lower than those of nonveterans on the average. Therefore, considering the effects of a veteran’s particular military experiences as well as those of veteran status is crucial in investigating the labor-market impact of military service.
Highlights.
Union veterans were more likely to migrate to a different state or region by 1880 than nonveterans.
Unskilled Union veterans were more likely to move up to white-collar or farming jobs by 1880 than nonveterans.
Unskilled Union veterans were less likely to become artisans by 1880 than nonveterans.
The differences in mobility by veteran status can be explained by the effects of military experiences rather than selective recruitment.
Acknowledgments
I thank Bill Collins, Dora Costa, Naomi Lamoreaux, Jean-Laurent Rosenthal, Peter Zeitz, the seminar participants at University of Chicago, Columbia University, and UCLA, and two anonymous referees for their helpful comments. I also thank Joseph Ferrie for kindly providing the sample of northern white males linked to the 1860 and 1880 censuses used in this paper. Financial and institutional support received from the Korea Research Foundation Grant funded by the Korean Government (KRF-2009-013-B00010), from the National Institute of Aging, National Institutes of Health (PO1 AG1020), and from the UCLA Center for Economic History is gratefully acknowledged.
Appendix: Estimation of the Proportion of Union Veterans (ωUA)
This study compares the measures of economic mobility of UA veterans and nonveterans who lived in particular states in 1860 and who belonged to a particular age group. In addition, the analyses given below use the samples linked across the 1860 and 1880 censuses. For the purpose of this study, it would be appropriate to define the weight to be assigned to UA veterans as follows: the number of white UA soldiers aged 15 to 24 years who lived in the selected northern states and who survived the war (denoted as SUA), divided by the number of white male population aged 15 to 24 years who lived in the selected northern states and who survived the war (denoted as SWM).
This ratio is not readily available from existing published sources. The strategy employed in this study is to estimate SUA and SWM for each state by applying some parameters (e.g., the proportions of the white male population and UA veterans of particular ages) drawn from micro data [such as the Integrated Public Use Micro Sample (IPUMS) of the 1860 census and the UA sample] to aggregate statistics on age-specific population by state and the number of enlisted men in the Union Troops (Carter et al. 2006, 180–379; Fry 1866; Hart 1965).24 The number of Union soldiers killed while in service by state was drawn from the Civil War Home Page (http://www.civil-war.net/pages/troops_furnished_losses). To be more specific, the proportion of Union veterans is calculated separately for the two age groups, 15 to 19 years and 20 to 24 years, in the following manner:
| (2) |
Superscript a and subscript j denote age group and state, respectively
SUA: the number of white males (as of 1860) who enlisted in the UA who survived the war
SWM: the number of white males (as of 1860) who survived the war
UA: the number of white males (as of 1860) who enlisted in the UA
WM: the number of white males (as of 1860)
D: the number of UA soldiers who were killed while in service
Φa: the proportion of UA soldiers aged a
θa: the proportion of D (UA soldiers killed while in service) aged a
λa: the proportion of the white male population age a
As for the ages 20 to 24 years, the 1860 census provides the male population for a broader age category, namely, ages 20 to 29 years (M20–29). Thus, the male population aged 20 to 24 years (M20–24) was calculated by multiplying M20–29 by the ratio of M20–24 to M20–29 (estimated from the IPUMS of the 1860 census). All statistics and parameters as well as methods used in this estimation can be obtained from the author upon request. The result of the estimation suggests that the majority of white males aged 15 to 24 years in 1860 joined the Union troops. The estimated value of the UA weight is 0.552 for ages 15 to 24 years, 0.628 for ages 15 to 19 years, and 0.471 for ages 20 to 24 years.
Footnotes
A majority of studies that compare the earnings of volunteers with those of nonveterans have reported higher earnings for veterans (Bryant, Samaranayake, and Wilhite 1993; Magnum and Ball 1989; Philips, Andrisani, Daymont, and Gilroy 1992). However, there are some contradicting results (Stafford 1991; Angrist 1998), and studies that focus on the effects of compulsory military service on earnings provide mixed results as well (Cutright 1974; Laurence, Ramsberger, and Gribben 1989; Angrist 1990; Angrist and Krueger 1994).
For instance, Angrist (1990) and Angrist and Krueger (1994) estimated the effects of military service in the Vietnam and World War II eras after correcting for selection bias by using instrumental variables that affected the likelihood of military service. To take another example, Angrist (1998) identified the effects of voluntary military service on earnings and employment by comparing applicants who enlisted with applicants who did not enlist, and by using instrumental variables generated by an error in the scoring of screening exams for military applicants.
See Costa and Kahn (2008) and Lee (2007, 2008) for more detailed explanations of the features of this longitudinal sample. For introductions of the Union Army project and data produced by it, see Fogel (1993, 2000a, 2000b, 2001) and Wimmer (2003).
For detailed characteristics of the source, see Ferrie (2004, 2005) and Ferrie and Long (2007) who utilize the data for comparing measures of economic mobility across times and countries. Ferrie (1996) offers detailed explanations of how a similar longitudinal sample for the period between 1850 and 1860 was constructed.
As for the veteran sample, 20,315 Union veterans still alive before the 1880 census was enumerated (including those whose subsequent death dates were unknown) were searched and linked to the 1880 census, utilizing information on name and date and place of birth. As a result of the linkage process, 7,229 veterans (36% of all men searched for) were successfully linked to the 1880 census (Costa and Kahn 2008, p. 231). This linked sample is largely similar to the entire Union Army in terms of personal characteristics and wartime medical experiences. In the case of the random sample, men drawn from the Integrated Public Use Micro Sample (IPUMS) of the 1860 census, who were aged 5 to 25 years in 1860, were searched in the complete-count file for the 1880 census, utilizing information on name, age, state of birth, race, and parents’ birth place (Ferrie 2004, p. 7). Joseph Ferrie’s longitudinal sample is more comparable to the Union Army sample than the random sample linked across 1860 and 1880 by IPUMS. The former was linked forward based on the random sample of the 1860 census, whereas the latter was linked backward using the list of individuals found in the 1880 census. Given that the Union Army sample was linked to the 1880 census based on the information available at the time of enlistment, using Joseph Ferrie’s data provides advantages in avoiding a potential survivorship bias problem and in making the composition of Union veterans prior to service more comparable between the Union and random samples.
The probabilities of inter-county, inter-state, and inter-region migration of veterans computed from the veteran sample are 57.9%, 38.3%, and 27.7%, respectively. By applying the probabilities of migration for the UA and random samples and the weight for Union veterans to Equation 1, three measures of geographic mobility were computed for nonveterans. The estimated probabilities of inter-county, interstate, and inter-region migration of nonveterans are 60.7%, 27.9%, and 21.4%, respectively.
See Lee (2008) for some descriptive evidence of these influences of military service among Union soldiers.
Of men who were born between 1837 and 1845 and who were examined for military service, one of five was rejected as unfit (Costa and Kahn 2008, p. 53)
Consistent with this conjecture, observable personal characteristics, such as age, nativity, family wealth, and occupation, were not significantly correlated with the distance travelled while in service if the state of enlistment is controlled for.
The regimental history records usually do not provide the names of the county or town where the given military event took place. Accordingly, the distance between the county of enlistment and the capitol of the state the given veteran entered was used in measuring the mobility while in service.
An alternative specification was also employed in which dummy variables for each quartile of the distribution of distance travelled are included in place of log(distance+1). The results are generally consistent with those reported in Table1. The probability of long-distance migration is positively related to the distance travelled, although the coefficient for the top quartile is slightly smaller than that for the third quartile; and only the veterans who belonged to the upper half were more likely to migrate than the men drawn from the random sample.
Log(distance+1) of the UA sample ranges from 0 to 7.963 (2872.7 miles) with a median value of 4.162. A total 13.2% of the sample had remained in the state of enlistment throughout their period of military service.
The estimated marginal effects (p-value) of the UA sample dummy and the interaction term are -0.0648 (0.0668) and 0.0163 (0.0326) for inter-state migration, and -0.0455 (0.1788) and 0.0116 (0.1076) for inter-regional migration, respectively, about two thirds of the estimates obtained from the full sample in terms of absolute magnitude.
During the second half of the Civil War, as the sense of patriotism gradually diminished as a spur to volunteer enlistment, bounties and the threat of conscription had a combined influence on volunteering, and the percentage of draftees increased over time (Geary 1991). The volunteers of 1861 and 1862 were, all else being equal, richer, taller, less likely to be laborers, less likely to be married, and more likely to be born in the United States, Germany, or Ireland than in Britain or other countries (Costa and Kahn 2008).
The estimated marginal effects (p-value) of the interaction term of the UA sample dummy and the log of distance moved on the probabilities of inter-state and inter-regional migrations were 0.0258 (0.0005) and 0.0188 (0.0085), respectively. The estimated marginal effects of the same variables obtained from the full sample were 0.0244 and 0.0201, respectively.
Controlling for the year of service, veterans who remained in the state of enlistment were significantly less likely to migrate than men in the random sample. The estimated marginal effect (p-value) of the interaction term of the UA sample dummy and the log of distance moved on the probabilities of inter-state and inter-regional migrations were, respectively, 0.0242 (0.0003) and 0.0196 (0.0020).
The vast majority of the force strength in the past was involved in “people-killing” that only required such simple training as physical drills and handling of a rifle. Most non-combat duties were manual jobs such as guard, teamster, and cook. In the Union Army, enlisted men who served on white-collar, non-manual, or skilled military duty accounted for only 8% of the entire force (Lee 2007). The percentage of enlisted men in the U.S. Armed Forces assigned to a military-type occupation while in service was 86.6% in the Spanish–American War, 34.1% in World War I, 38.8% in World War II, and 30.3% in the Korean War (Weinstein 1969, p. 328).
The probability of occupational improvement among the unskilled is a widely used measure of economic mobility in the 19th century (Thernstrom 1964, 1973; Ferrie 2005). Unskilled workers include farm laborers, operatives, and low-level service workers; and white-collar workers include professionals, managers, officials, proprietors, and clerical workers.
These three measures of occupational mobility for unskilled UA veterans are 14.1% (white-collar worker), 43.1% (farmer), and 10.8% (artisan). Again, by utilizing the weight for UA veterans, the same measures of occupational mobility are computed for nonveterans. The estimated probabilities of entering white-collar, farming, and craft jobs by 1880 are 10.0%, 36.0%, and 15.9%, respectively.
The logistic regression result reveals that the differences in occupational mobility between men from the veteran and random samples are statistically insignificant. The p-values of the coefficients for UA sample dummy are 0.4414, 0.1309, and 0.1827 for the probabilities of moving up to white-collar, farming, and craft occupations, respectively. However, this finding does not mean that the differences between veterans and nonveterans are statistically insignificant. Given the estimated magnitudes, the measures of occupational mobility could significantly differ between veterans and nonveterans, although it is impossible to test with available data.
The author’s unpublished analyses based on the UA sample suggest that the percentages of former farmers and white-collar workers in each company were positively related to the probability that the unskilled at the time of enlistment transferred to farming and white-collar jobs by 1880. The presence of older peers formerly employed in higher occupations had a more powerful positive effect on the occupational mobility of the unskilled than that of the same-age peers.
A possible source of suspicion about the result is that some of the men in the sample whose occupations were described as unskilled could have actually been engaged in a higher occupation. In particular, it is possible that census takers misreported the occupations of some enlistees who actually worked in their fathers’ trades in the household. To consider this possibility, regressions were conducted based on samples from which unskilled men living with their fathers who were employed in a particular occupation (white-collar workers, farmers, and artisans) were excluded. However, the results based on these subsamples offer very similar implications as the ones based on the full sample of the unskilled men.
The percentage of farmers in each company where the UA veterans in the sample served ranges from 2.47% to 99.4% with a median value of 60.3%. The percentage of craftsmen ranges from 0 to 66.0% with a median value of 18.0%.
Age-specific non-military mortality rates between 1860 and 1880 are assumed to be the same for veterans and nonveterans. Thus, a common survival rate for UA soldiers (the numerator of Equation 2) and for all white males (the denominator of Equation 2) is cancelled out. Union veterans might be healthier than nonveterans at the time of enlistment, but their health would be adversely influenced by wartime experiences. Determining which of the two forces is stronger is difficult; hence, it is implicitly assumed here that they offset each other.
Publisher's Disclaimer: This is a PDF file of an unedited manuscript that has been accepted for publication. As a service to our customers we are providing this early version of the manuscript. The manuscript will undergo copyediting, typesetting, and review of the resulting proof before it is published in its final citable form. Please note that during the production process errors may be discovered which could affect the content, and all legal disclaimers that apply to the journal pertain.
References
- Angrist Joshua. Lifetime Earnings and the Vietnam Era Draft Lottery: Evidence from Social Security Administrative Records. American Economic Review. 1990;80(3):313–336. [Google Scholar]
- Angrist Joshua. Estimating the Labor Market Impact of Voluntary Military Service Using Social Security Data on Military Applications. Econometrica. 1998;66(2):249–288. [Google Scholar]
- Angrist Joshua, Krueger Alan B. Why Do World War II Veterans Earn More Than Non-veterans? Journal of Labor Economics. 1994;12(1):74–97. [Google Scholar]
- Berlin Ira, Joseph P Reidy, Rowland Leslie S., editors. Freedom’s Soldiers: The Black Military Experience in the Civil War. New York: Cambridge University Press; 1998. [Google Scholar]
- Burton Joseph. The Long-Term Persistence of Social Capital: Residential Clustering among Union Army Veterans. Center for Population Economics Working Paper; 2009. [Google Scholar]
- Bryant RB, Samaranayake VA, Wilhite A. The Effect of Military Service on the Subsequent Civilian Wage of the Post-Vietnam Veterans. Quarterly Review of Economics and Finance. 1993;74:15–30. [Google Scholar]
- Carter Susan B, Gartner Scott Sigmund, Haines Michael R, Olmstead Alan L, Sutch Richard, Wright Gavin., editors. Historical Statistics of the United States: Millennial Edition (Online Version) New York: Cambridge University Press; 2006. [Google Scholar]
- Costa Dora L, Kahn Matthew E. Heroes and Cowards. Princeton University Press; 2008. [Google Scholar]
- Cutright Phillips. The Civilian Earnings of White and Black Draftees and Nonveterans. American Sociological Review. 1974;39:317–327. [Google Scholar]
- Ferrie Joseph. A New Sample of Americans Linked from the 1850 Public Use Micro Sample of the Federal Census of Population to the 1860 Federal Census Manuscript Schedules. Historical Methods. 1996 Fall;29:141–156. [Google Scholar]
- Ferrie Joseph. Longitudinal Data for the Analysis of Mobility in the U S, 1850-1910. Northwestern University; 2004. Working Paper. [Google Scholar]
- Ferrie Joseph. History Lessons: The End of American Exceptionalism? Mobility in the United States Since 1850. Journal of Economic Perspectives. 2005;19(3):199–215. [Google Scholar]
- Ferrie Joseph, Long Jason. The Path to Convergence: Intergeneration Occupational Mobility in Britain and the US in Three Eras. Economic Journal. 2007 Mar;117:C61–71. [Google Scholar]
- Fogel Robert W. New Sources and New Techniques for the Study of Secular Trends in Nutritional Status, Health, Mortality, and the Process of Aging. Historical Methods. 1993;26(1):5–43. [Google Scholar]
- Fogel Robert W. Public Use Tape on the Aging of Veterans of the Union Army. Data User’s Manual. Military, Pension, and Medical Records 1820-1940. Version M-5. Center for Population Economics, University of Chicago Graduate School of Business and Department of Economics, Brigham Young University; 2000a. [Google Scholar]
- Fogel Robert W. Public Use Tape on the Aging of Veterans of the Union Army. Data User’s Manual. U S Federal Census Records 1850, 1860, 1900, 1910. Version C-3. Center for Population Economics, University of Chicago Graduate School of Business and Department of Economics, Brigham Young University; 2000b. [Google Scholar]
- Fogel Robert W. Public Use Tape on the Aging of Veterans of the Union Army. Data User’s Manual. Surgeon’s Certificates 1862-1940. Version S-1 Standardized. Center for Population Economics, University of Chicago Graduate School of Business and Department of Economics, Brigham Young University; 2001. [Google Scholar]
- Fry James B. Report of the Provost Marshal General. Washington DC: GPO; 1866. [Google Scholar]
- Geary James W. We Need Men: The Union Draft in the Civil War. Dekalb: Northern Illinois University Press; 1991. [Google Scholar]
- Goldin Claudia D, Lewis Frank D. The Economic Cost of the American Civil War: Estimates and Implications. Journal of Economic History. 1975;35(2):299–326. [Google Scholar]
- Hart Herbert M. Old Forts of the Far West. Seattle WA: Bonanza Books; 1965. [Google Scholar]
- Laurence JH, Ramsberger PF, Gribben MA. Effects of Military Experience on the Post-Service Lives of Low-Aptitude Recruits: Project 100,000 and the ASVAB Misnorming. Human Resources Research Organization; Alexandria, VA: 1989. FR-PRD-89-29. [Google Scholar]
- Laschever Ron. The Doughboys Network: Social Interactions and the Employment of World War I Veterans. Mimeo: University of Illinois at Urbana-Champaign; 2009. [Google Scholar]
- Lee Chulhee. Selective Assignment of Military Positions in the Union Army: Implications for the Impact of the Civil War. Social Science History. 1999;23(1):67–97. [Google Scholar]
- Lee Chulhee. Prior Exposure to Disease, and Later Health and Mortality: Evidence from Civil War Medical Records. In: Costa DL, editor. Health and Labor Force Participation over the Life Cycle: Evidence from the Past. Chicago: University of Chicago Press; 2003. pp. 51–88. [Google Scholar]
- Lee Chulhee. Wealth Accumulation and the Health of Union Army Veterans, 1860-1870. Journal of Economic History. 2005;65(2):352–385. doi: 10.1017/S0022050705000124. [DOI] [PMC free article] [PubMed] [Google Scholar]
- Lee Chulhee. Military Positions and Post-Service Occupational Mobility of Union Army Veterans, 1861-1880. Explorations in Economic History. 2007;44:680–698. doi: 10.1016/j.eeh.2006.09.001. [DOI] [PMC free article] [PubMed] [Google Scholar]
- Lee Chulhee. Health, Information, and Migration: Post-Service Geographic Mobility of Union Army Veterans, 1860-1880. Journal of Economic History. 2008;65:352–385. doi: 10.1017/S0022050708000661. [DOI] [PMC free article] [PubMed] [Google Scholar]
- Magnum SL, Ball DE. The Transferability of Military-Provided Occupational Training in the Post-Draft Era. Industrial and Labor Relations Review. 1989;42:230–245. [Google Scholar]
- Mincer Jacob. Family migration decisions. Journal of Political Economy. 1978;86:749–773. [Google Scholar]
- Murdock Eugene C. Was It A Poor Man’s Fight? Civil War History. 1964;10:241–45. [Google Scholar]
- Phillips RL, Andrisani PJ, Daymount TN, Gilroy CL. The Economic Returns to Military Service: Race-Ethnic Differences. Social Science Quarterly. 1992;73:340–359. [Google Scholar]
- Sjaastad Larry A. The Costs and Returns of Human Migration. Journal of Political Economy. 1962 Oct;70(5, Part 2):80–93. [Google Scholar]
- Stafford FP. Partial Careers: Civilian Earnings and the Optimal Duration of an Army Career. In: Gilroy C, Horne D, Smith DA, editors. Military Compensation Policies and Personal Relation: Models and Evidence. Ch 7 Alexandria, VA: US Army Research Institute for the Behavioral and Social Sciences; 1991. [Google Scholar]
- Thernstrom Stephan. Poverty and Progress. Cambridge: Harvard University Press; 1964. [Google Scholar]
- Thernstrom Stephan. The Other Bostonians. Cambridge: Harvard University Press; 1973. [Google Scholar]
- Vinovskis Maris A. Have Social Historians Lost the Civil War? Some Preliminary Demographic Speculations. In: Vinovskis MA, editor. Toward A Social History of the American Civil War. New York: Cambridge Univ. Press; 1990. pp. 1–30. [Google Scholar]
- Weinstein Paul A. Occupational Convergence and the Role of the Military in Economic Development. Explorations in Economic History. 1969;7:325–346. [Google Scholar]
- Wimmer Larry T. Reflections on the Early Indicators Project: A Partial History. In: Costa DL, editor. Health and Labor Force Participation over the Life Cycle: Evidence from the Past. Chicago: University of Chicago Press; 2003. pp. 1–10. [Google Scholar]