

Abstract
Motivation: The comparison of diverse genomic datasets is fundamental to understand genome biology. Researchers must explore many large datasets of genome intervals (e.g. genes, sequence alignments) to place their experimental results in a broader context and to make new discoveries. Relationships between genomic datasets are typically measured by identifying intervals that intersect, that is, they overlap and thus share a common genome interval. Given the continued advances in DNA sequencing technologies, efficient methods for measuring statistically significant relationships between many sets of genomic features are crucial for future discovery.
Results: We introduce the Binary Interval Search (BITS) algorithm, a novel and scalable approach to interval set intersection. We demonstrate that BITS outperforms existing methods at counting interval intersections. Moreover, we show that BITS is intrinsically suited to parallel computing architectures, such as graphics processing units by illustrating its utility for efficient Monte Carlo simulations measuring the significance of relationships between sets of genomic intervals.
Availability: https://github.com/arq5x/bits.
Contact: arq5x@virginia.edu
Supplementary information: Supplementary data are available at Bioinformatics online.
1 INTRODUCTION
Searching for intersecting intervals in multiple sets of genomic features is crucial to nearly all genomic analyses. For example, interval intersection is used to compare ChIP enrichment between experiments and cell types, identify potential regulatory targets and compare genetic variation among many individuals. Interval intersection is the fundamental operation in a broader class of ‘genome arithmetic’ techniques, and as such, it underlies the functionality found in many genome analysis software packages (Giardine et al., 2005; Kent et al., 2002; Li et al., 2009; Quinlan and Hall, 2011).
As high-throughput sequencing technologies have become the de facto molecular tool for genome biology, there is an acute need for efficient approaches to interval intersection. Microarray techniques for measuring gene expression and chromatin states have been largely supplanted by sequencing-based techniques, and whole-exome and whole-genome experiments are now routine. Consequently, most genomics laboratories now conduct analyses including datasets with billions of genome intervals. Experiments of this size require substantial computation time per pairwise comparison. Moreover, typical analyses require comparisons with many large sets of genomic features (where set size refers to the number of intervals in the set). Existing approaches scale poorly and are already reaching their performance limits. We, therefore, argue the need for new scalable algorithms to allow discovery to keep pace with the scale and complexity of modern datasets.
In this manuscript, we introduce the Binary Interval Search (BITS) algorithm as a novel and scalable solution to the fundamental problem of counting the number of intersections between two sets of genomic intervals. BITS uses two binary searches (one each for start and end coordinates) to identify intersecting intervals. As such, our algorithm executes in  time, where N is the number of intervals, which can be shown to be optimal for the interval intersection counting problem by a straightforward reduction to element uniqueness (known to be
  (Mirsa and Gries, 1982). In contrast, counting intersections by enumeration is less efficient, as enumerating intervals requires time
  , where M is the number of intersections that can be quadratic to the input size. We illustrate that a sequential version of BITS outperforms existing approaches and show that BITS is intrinsically suited to parallel architectures. The parallel version performs the same amount of work as the sequential version (i.e. there is no overhead), which means the algorithm is work efficient, and because each parallel thread performs equivalent work, BITS has little thread divergence. Although thread divergence degrades performance on any architecture (finished threads must wait for overburdened threads to complete), the impact is particularity acute for graphics processing units (GPUs) where threads share a program counter and any divergent instruction must be executed on every thread.
1.1 The interval set intersection problem
We begin by reviewing some basic definitions. A genomic interval is a continuous stretch of a genome with a chromosomal start and end location (e.g. a gene), and a genomic interval set is a collection of genomic intervals (e.g. all known genes). Two intervals a and b intersect when  and
and  . The intersection of two interval sets
  and
and  is the set of interval pairs:
Intervals within a set can intersect, but self-intersections are not included in  . There are four natural sub-problems for interval set intersection: (i) decision—does there exist at least one interval in A that intersects an interval in B?; (ii) counting—how many total intersections exist between sets A and B?; (iii) per-interval counting—how many intervals in B intersect each interval in A?; (iv) enumeration—what is the set of each pairwise interval intersections between A an B? Although BITS solves all four sub-problems, it is designed to efficiently count the number of intersections between two sets, and as such, it excels at the decision, counting and per-interval counting problems.
1.2 Limits to parallelization
Interval intersection has many applications in genomics, and several algorithms have been developed that, in general, are either based on trees (Alekseyenko and Lee, 2007; Kent et al., 2002) or linear sweeps of pre-sorted intervals (Richardson, 2006).
The UCSC Genome Browser introduced a widely used scheme based on R-trees. This approach partitions intervals from one dataset into hierarchical ‘bins’. Intervals from a second dataset are then compared with matching bins (not the entire dataset) to narrow the search for intersections to a focused portion of the genome. Although this approach is used by the UCSC Genome Browser, BEDTools (Quinlan and Hall, 2011) and SAMTOOLS (Li et al., 2009), the algorithm is inefficient for counting intersections, as all intervals in each candidate bin must be enumerated to count the intersections. As the number of intersections is at most quadratic, any enumeration-based algorithm is O(N2).
Moreover, these existing approaches are poor candidates for parallelization. Thread divergence can be a significant problem for hierarchical binning methods. If intervals are not uniformly distributed (e.g. exome sequencing or RNA-seq), then a small number of bins will contain many intervals, whereas most other bins are empty. Consequently, threads searching full bins will take substantially longer than threads searching empty bins. In contrast, BITS counts intersections directly without enumerating intersecting intervals; therefore, the underlying interval distribution does not impact the relative workload of each thread.
Recent versions of BEDTools and BEDOPS (Neph et al., 2012) conduct a linear ‘sweep’ through pre-sorted datasets while maintaining an auxiliary data structure to track intersections as they are encountered. Although the complexity of such sequential sweep algorithms is theoretically optimal, the amount of parallelism that exists is limited, and some overhead is required to guarantee correctness. Any linear sweep algorithm must maintain the ‘sweep invariant’ (McKenney and McGuire, 2009), which states that all segment starts and ends, and intersections behind the sweep must be known. A parallel sweep algorithm must either partition the input space such that each section can be swept in parallel without violating the invariant or threads must communicate about intervals that span partitions. In the first case, parallelism is limited to the number of partitions that can be created, and threads can diverge when the number of intervals in each partition is unbalanced. In the second case, the communication overhead between threads prevents work efficiency and can have significant performance implications. In BITS, the amount of parallelism depends only on the number of intervals and not on the distribution of intervals within the input space, and there is no communication between threads.
2 METHODS
A seemingly facile method for finding the intersection of A and B would be to treat one set, A, as a ‘query’ set, and the other, B, as a ‘database’. If all of the intervals in the database were sorted by their starting coordinates, it would seem that binary searches could be used for each query to identify all intersecting database intervals.
However, this apparently straightforward searching algorithm is complicated by a subtle, yet vexing detail. If the intervals in B are sorted by their starting positions, then a binary search of B for the query interval end position  will return the interval
  , where bj is the last interval in B that starts before interval ai ends (e.g. interval e in Fig. 1A). This would seem to imply that if bj does not intersect ai, then no intervals in B intersect ai, and if bj does intersect ai, then other intersecting intervals in B could be found by scanning the intervals starting before bj in decreasing order, stopping at the first interval that does not intersect ai. However, this technique is complicated by the possibility of intervals that are wholly contained inside other intervals (e.g. interval c in Fig. 1B).
Fig. 1.

Comparing a naïve binary search for interval intersection to the BITS approach. (A) Binary searches of intervals sorted by start coordinate will occasionally identify overlapping intervals. However, contained intervals prevent knowing how far one must scan the database to identify all intersections. (B) Contained intervals also cause single binary searches to falsely conclude that no intersections exist for a given query interval. (C) To overcome these limitations, BITS uses two binary searches of the database intervals: one into a sorted list of end coordinates and the other into a sorted list of start coordinates. Each search excludes database intervals that cannot intersect the query, leaving solely the intervals that must intersect the query
An interval  is ‘contained’ if there exists an interval
  where
where  and
and  . Considering such intervals, if the interval found in the previous binary search bj does not intersect the query interval ai, we cannot conclude that no interval in B intersects ai because there may exist an interval
  where
where  . Furthermore, if bj does intersect ai, then the subsequent scan for other intersecting intervals cannot stop at the first interval that does not intersect ai; it is possible that some earlier containing interval intersects ai. Therefore, the scan is forced to continue until it reaches the beginning of the list. As contained intervals are typical in genomic datasets, a naïve binary search solution is inviable.
2.1 Binary Interval Search algorithm
We now introduce our new Binary Interval Search (BITS) algorithm for solving the interval set intersection problem. This algorithm uses two binary searches to identify interval intersections while avoiding the aforementioned complexities caused by contained intervals. The key observation underlying BITS is that the size of the intersection between two sets can be determined without enumerating each intersection. For each interval in the query set, two binary searches are performed to determine the number of intervals in the database that intersect the query interval. Each pair of searches is independent of all others, and thus all searches can be performed in parallel.
Existing methods define the intersection set based on inclusion, that is, the set of intervals in the interval database B that end after the query interval ai begins, and which begin before ai ends. However, we have seen that contained intervals make it difficult to find this set directly with a single binary search.
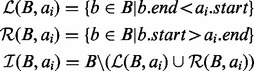
Our algorithm uses a different, but equivalent, definition of interval intersection based on exclusion, that is, by identifying the set of intervals in B that cannot intersect ai, we can infer how many intervals must intersect ai. Formally, we define the set of intervals  that intersect query interval
  to be the intervals in B that are neither in the set of intervals ending before (‘left of’, set
  below) ai begins nor in the set of intervals starting after (‘right of’, set
  below) ai ends. That is:
 |
Finding the intervals in  for each
  by taking the difference of B and the union of
  and
and  is not efficient. However, we can quickly find the size of
  and the size
  and then infer the size of
  . With the size of
  , we can directly answer the decision problem, the counting problem and the per-interval counting problems. The size of
  also serves as the termination condition for enumerating intersections that were missing in the naïve binary search solution.
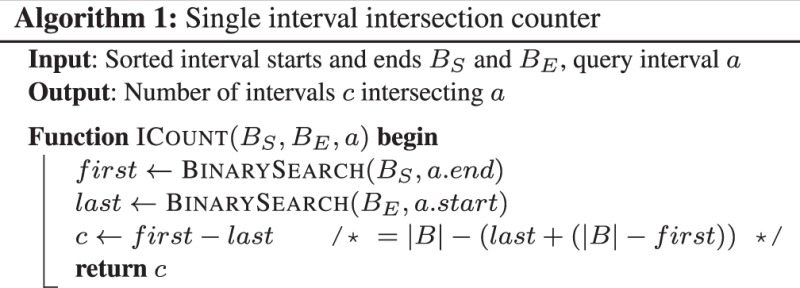
The BITS algorithm is based on one fundamental function, ICount (Algorithm 1), which determines the number of intervals in the database B that intersect query interval ai. As shown in Figure 1C, the database B is split into two integer lists
  and
and 
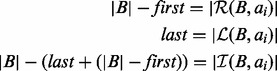
 , which are each sorted numerically in ascending order. Next, two binary searches are performed,
  and
and  . As BE is a sorted list of each interval end coordinate in B, the elements with indices less than or equal to last in BE correspond to the set of intervals in B that end before ai starts (i.e. to the ‘left’ of ai). Similarly, the elements with indices greater than or equal to first in BS correspond to the set of intervals in B that start after ai ends (i.e. to the ‘right’ of ai). From these two values, we can directly infer the size of the intersection set
  (i.e. the count of intersections in B for ai):
 |
Using the subroutine  all four interval set intersection problem variants can be solved. Pseudocode for the decision, per-interval counting and enumeration sub-problems can be found in the Supplementary Material.
2.1.1 The BITS solution to the counting problem
As BITS operates on arrays of generic intervals ( ), and input files are typically chromosomal intervals (
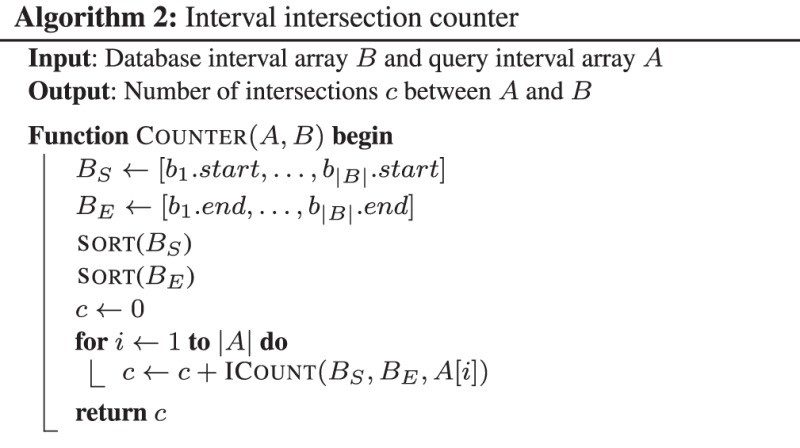
 ), the intervals in each dataset are first projected down to a 1D generic interval. This is a straightforward process that adds an offset associated with the size of each chromosome to the start and end of each interval. The resulting interval arrays A and B are input to the Counter (Algorithm 2) that sets the accumulator variable c to zero; then for each
  , accumulates
  . The total count c is returned.
2.2 Time complexity analysis
The time complexity of BITS is  which can be shown to be optimal by a straightforward reduction to element uniqueness (known to be
  (Mirsa and Gries, 1982). To compute
  for each ai in A, the interval set B is first split into two sorted integer lists BS and BE, which requires
  time. Next, each instance of
  searches both BS and BE, which consumes
  time. For the counting problems, combining the results of all
  instances into a final result can be accomplished in
  time.
time.
2.3 Parallel BITS
Performing a single operation independently on many different inputs is a classic parallelization scenario. When based on the sub-routine  , which is independent of all
  for intervals x in the query set where
  , counting interval intersections is a pleasingly parallelizable problem that easily maps to a number of parallel architectures.
NVIDIA’s CUDA is a single instruction multiple data (SIMD) architecture that provides a general interface to a large number of parallel GPUs. The GPU is organized into multiple SIMD processing units, and the processors within a unit operate in lock-step. The BITS algorithm is especially well suited for this architecture for a number of reasons. First, CUDA is optimized to handle large numbers of threads. By assigning each thread, one instance of  , the number of threads will be proportional to the input size. CUDA threads also execute in lock-step and any divergence between threads will cause reduced thread utilization. Although there is some divergence in the depth of each binary search performed by
  , it has an upper bound of
  . Outside of this divergence,
  is a classic SIMD operation (Kirk and Hwu, 2010). Finally, the only data structure required for this algorithm are a sorted array, and thanks to years of research in this area, current GPU sorting algorithms can sort billions of integers within seconds (Merrill and Grimshaw, 2011; Satish et al., 2009).
3 RESULTS
3.1 Comparing BITS to extant sequential approaches
We implemented a sequential version of the BITS algorithm (‘BITS-SEQ’) as a stand-alone C++ utility. Here, we assess the performance of this implementation relative to BEDTools intersect and UCSC Genome Browser’s (‘UCSC’) (Kent et al., 2002) bedIntersect utilities (see Supplementary Material for details). We compare the performance of each tool for counting the total number of observed intersections between sets of intervals of varying sizes (Fig. 2). The comparisons presented are based on sequence alignments for the CEU individual NA12878 by the 1000 Genomes Project (The 1000 Genomes Project Consortium, 2010), as well as RefSeq exons. Owing to the different data structures used by each algorithm, the relative performance of each approach may depend on the genomic distribution of intervals within the sets. As discussed previously, tree-based solutions that place intervals into hierarchical bins may perform poorly when intervals are unevenly distributed among the bins. We tested the impact of differing interval distributions on algorithm performance by randomly sampling 1 and 10 million alignment intervals from both whole-genome and exome-capture datasets for NA12878 (see Supplementary Material). Each algorithm was evaluated considering three different interval intersection scenarios. First, we tested intervals from different distributions by comparing the intersection between exome-capture alignments and whole-genome alignments. As each set has a large number of intervals and a different genomic distribution, we expect a small (relative to the set size) number of intersections. We also tested a uniform distribution by counting intersections between Refseq exons and whole-genome sequencing alignments. Here, each interval set is, for the most part, evenly distributed throughout the genome; thus, we expect each exon to intersect roughly the same number of sequencing intervals, and a large number of sequencing intervals will not intersect an exon. Finally, we assessed a biased intersection distribution between exons and exome-capture alignments. By design, exome sequencing experiments intentionally focus collected DNA sequences to the coding exons. Thus, the vast majority of sequence intervals will align in exonic regions. In contrast to the previous scenario, nearly every exon interval will have a large number of sequence interval intersections, and nearly all sequencing intervals will intersect an exon.
Fig. 2.

Run times for counting intersections with BITS, BEDTools and UCSC ‘Kent source’. (A) Run times for databases of 1 million alignment intervals from each interval distribution. (B) Run times for databases of 10 million alignment intervals from each interval distribution. Bars reflect the mean run time from five independent experiments, and error bars describe the standard deviation. Gray bars reflect the run time consumed by data structure construction, whereas white bars are the time spent counting intersections. Above each BITS execution time, we note the speed increase relative to BEDTools and ‘Kent source’, respectively. ‘Exons’ represents 400 351 RefSeq exons (autosomal and X, Y) for the human genome (build 37). BED = BEDTools; UCSC = ‘Kent source’
3.1.1 BITS excels at counting intersections
In all three interval distribution scenarios, the sequential version of BITS had superior runtime performance for counting intersections. BITS was between 11.2 and 27.9 times faster than BEDTools and between 1.2 and 5.2 times faster than UCSC (Fig. 2). This behaviour is expected, whereas the BEDTools and UCSC tree-based algorithms must enumerate intersections to derive the count, BITS infers the intersection count by exclusion without enumeration.
3.1.2 BITS excels at large intersections and biased distributions
The relative performance gains of the BITS approach are enhanced for large datasets (Fig. 2B). As tree-based methods have a fixed number of bins, and searches require a linear scan of each associated bin, the number of intervals searched grows linearly with respect to the input size. In the worst-case where all intervals are in a single bin, a search would scan the entire input set. In contrast, BITS uses binary searches; hence, the number of operations is proportional to loglog of the input size, regardless of the input distribution.
Similarly, exome-capture experiments yield biased distributions of intervals among the UCSC bins. Consequently, most bins in tree-based methods will contain no intervals, whereas a small fraction contain many intervals. When the query intervals have the same bias, the overhead of the UCSC algorithm is more onerous, as a small number of bins are queried and each queried bin contains many intersecting intervals that must be enumerated to count overlaps. As the BITS algorithm is agnostic to the interval distributions, it will outperform the UCSC algorithm (Fig. 2A and B) for common genomic analyses, such as ChIP-seq and RNA-seq, especially given the massive size of these datasets.
3.2 Applications for Monte Carlo simulations
Identifying statistically significant relationships between sets of genome intervals is fundamental to genomic research. However, owing to our complex evolutionary history, different classes of genomic features have distinct genomic distributions, and as such, testing for significance can be challenging. One widely used, yet computationally intensive, alternative solution is the use of Monte Carlo (MC) simulations that compare observed interval relationships to an expectation based on randomization. All aspects of the BITS algorithm are particularly well suited for MC simulations measuring relationships between interval sets. As described, all intersection algorithms begin detecting intersections between two interval sets by setting up their underlying data structures (e.g. trees or arrays). The BITS set-up process involves mapping each interval from the 2D chromosomal interval space (i.e. chromosome and start/end coordinates) to a 1D integer interval space (i.e. start/end coordinates ranging from 1 to the total genome size). Once the intervals are mapped, arrays are sorted by either start or end coordinates. In contrast, the UCSC set-up places each interval into a hash table. As shown in Figure 2, data structure set-up is a significant portion of the runtime for all approaches.
However, in the case of many MC simulation rounds, where a uniformly distributed random interval set is generated and placed into the associated data structure, the set-up step is faster in BITS, whereas the set-up time remains constant in each simulation round for UCSC. For BITS, the mapping step is skipped in all but the first round, and in each simulation round, only an array of random starts must be generated. The result is a 6× speed-up for MC rounds over the cost of the initial intersection set-up. For UCSC, both the chromosome and the interval start position must be generated and then placed into the hash table with no change in execution time.
This speed-up in BITS is extended on parallel platforms, where the independence of each intersection is combined with efficient parallel random number generation algorithms (Tzeng and Wei, 2008) and parallel sorting algorithms (Merrill and Grimshaw, 2011; Satish et al., 2009). MC simulations have obvious task parallelism, as each round is independent. BITS running on CUDA (‘BITS-CUDA’) goes a step further and exposes fine-grain parallelism in both the set-up step, with parallel random number generation and parallel sorting, and the intersection step where hundreds of intersections execute in parallel. The improvement is modest for a single intersection (only parallel sorting can be applied to the set-up step) where BITS-CUDA is 4× faster than sequential BITS and 40× faster than sequential UCSC. However, as the number of MC rounds grows, performance improves dramatically. At 10 000 MC rounds and 1e7 intervals, BITS-CUDA is 267× faster than sequential BITS and 3414× faster than sequential UCSC. An improvement of this scale allows MC analyses for thousands of experiments (e.g. 25 281 pairwise comparisons in Section 3.3).
We demonstrate the improved performance of BITS over UCSC for MC simulations for measuring the significance of the overlaps between interval sets in Table 1. As both the number of MC rounds and the size of the dataset grows, the speed-up of both sequential BITS and BITS-CUDA increases over UCSC. For the largest comparison (1e7 intervals and 10 000 iterations), BITS-SEQ is 12× faster than UCSC, and BITS-CUDA is 267× faster than BITS-SEQ and 3414× faster than sequential UCSC.
Table 1.
Runtime (seconds) comparison for MC simulationsa
| Number of MC iterations |
|||||
|---|---|---|---|---|---|
| Size | Tool | 1 | 100 | 1000 | 10 000 |
| 1e5 | BITS-CUDA | 0.73 | 1 | 4 | 28 |
| BITS-SEQ | 0.41 | 7 | 68 | 680 | |
| UCSC | 0.17 | 14 | 138 | 1381 | |
| 1e6 | BITS-CUDA | 2 | 3 | 1 | 103 |
| BITS-SEQ | 5 | 120 | 1200 | 12 000 | |
| UCSC | 6 | 878 | 8780 | 87 800 | |
| 1e7 | BITS-CUDA | 14 | 22 | 97 | 835 |
| BITS-SEQ | 66 | 2235 | 22 350 | 223 500 | |
| UCSC | 568 | 28 508 | 285 080 | 2 850 800 | |
aTimings in italics were extrapolated owing to long run times.
3.3 Uncovering novel genomic relationships
The efficiency of BITS for MC applications on GPU architectures provides a scalable platform for identifying novel relationships between large-scale genomic datasets. To illustrate BITS-CUDA’s potential for large-scale data mining experiments, we conducted a screen for significant genomic co-localization among 159 genome annotation tracks using MC simulation (see Supplementary Material). This analysis was based on functional annotations from the ENCODE project (ENCODE Project Consortium, 2007) for the GM12878, H1-hESC and K562 cell lines, including assays for 24 transcriptions factors (often with replicates), 8 histone modifications, open chromatin and DNA methylation. We also included diverse genome annotations from the UCSC genome browser (e.g. repeats, genes and conserved regions).
Using BITS-CUDA, we measured the log2 ratio of the observed and expected number of intersections for each of the 25 281 (i.e. 159* 159) pairwise dataset relationships using 1e4 MC simulations (Fig. 3). As expected, this analysis revealed that (i) the genomic locations for the same functional element are largely consistent across replicates and cell types; (ii) methylated and semi-methylated regions are similar across cell types; and (iii) most functional assays were anti-correlated with genomic repeats (e.g. microsatellites) owing to sequence alignment strategies that exclude repetitive genomic regions. Perhaps not surprisingly, this unbiased screen also revealed intriguing patterns. First, the strong enrichment among all transcription factors (TF) assays suggests that a subset of TF binding sites is shared among all factors. This observation is consistent with previous descriptions of ‘hot regions’ (Gerstein et al., 2010). In addition, there is a significant, specific and unexplained enrichment among the Six5 TF and segmental duplications.
Fig. 3.

BITS-CUDA measurements of spatial correlations among 159 genome features from the ENCODE project and from the UCSC Genome Browser. For each comparison, we show an enrichment score reflecting the log2 ratio of the observed count of intersections over the median count of intersections from 10 000 MC simulations. Each set of three labels on the x and y axes correspond to three consecutive rows or columns, respectively. Assays from the GM12878 cell line are in green, H1-hESC in blue and K562 in red. Annotation tracks from the UCSC Genome Browser are in black
Pursuing the biology of these relationships is beyond the scope of the current manuscript; however, we emphasize that the ability to efficiently conduct such large-scale screens facilitates novel insights into genome biology. This analysis presented a tremendous computational burden made feasible by the facility with which the BITS algorithm could be applied to GPU architectures. Indeed, each iteration of our MC simulation was tested for intersections among 4 billion intervals among the 25 000 datasets, yielding >44 trillion comparisons for the entire simulation. Although this simulation took 9069 min on a single computer with one GPU card, we estimate that it would take at least 112 traditional processors to conduct the same analysis using standard approaches, such as the UCSC tools or BEDTools.
4 CONCLUSION
We have developed a novel algorithm for interval intersection that is uniquely suited to scalable computing architectures, such as GPUs. Our algorithm takes a new approach to counting intersections: unlike existing methods that must enumerate intersections to derive a count, BITS uses two binary searches to directly infer the count by excluding intervals that cannot intersect one another.
We have demonstrated that a sequential implementation of BITS outperforms existing tools and illustrated that BITS is task efficient and highly parallelizable. BITS is also memory efficient: our MC simulation required 217 Mb of random access memory and the sequential implementation consumed 412 Mb of random access memory, versus 790 Mb for UCSC and 3588 Mb for BEDTools. We show that a GPU implementation of BITS is, therefore, a superior solution for MC analyses of statistical relationships between genome intervals sets.
Given the efficiency with which the BITS algorithm counts intersections, it is also well suited to other genomic analyses, including RNA-seq transcript quantification, ChIP-seq peak detection and searches for copy-number and structural variation. Moreover, the functional and regulatory data produced by projects, such as ENCODE, have led to new approaches (Favorov et al., 2012) for measuring relationships among genomic features. We recognize the importance of scalable approaches for detecting such relationships, and we anticipate that our new algorithm will foster new genome mining tools for the genomics community.
Supplementary Material
ACKNOWLEDGEMENTS
The authors are grateful to Anindya Dutta for helpful discussions throughout the preparation of the manuscript and to Ryan Dale for providing scripts that aided in the analysis and interpretation of our results.
Funding: NHGRI (NIH 1R01HG006693-01 to A.Q.).
Conflict of Interest: none declared.
ReFERENCES
- Alekseyenko AV, Lee CJ. Nested containment list (NCList): a new algorithm for accelerating interval query of genome alignment and interval databases. Bioinformatics. 2007;23:1386–1393. doi: 10.1093/bioinformatics/btl647. [DOI] [PubMed] [Google Scholar]
- ENCODE Project Consortium (2007) Identification and analysis of functional elements in 1% of the human genome by the ENCODE pilot project. Nature. 447:799–816. doi: 10.1038/nature05874. [DOI] [PMC free article] [PubMed] [Google Scholar]
- Favorov A, et al. Exploring massive, genome scale datasets with the GenometriCorr package. PLoS Comput. Biol. 2012;8:e1002529. doi: 10.1371/journal.pcbi.1002529. [DOI] [PMC free article] [PubMed] [Google Scholar]
- Gerstein MB, et al. Integrative analysis of the Caenorhabditis elegans genome by the modENCODE project. Science. 2010;330:1775–1787. doi: 10.1126/science.1196914. [DOI] [PMC free article] [PubMed] [Google Scholar]
- Giardine B, et al. Galaxy: a platform for interactive large-scale genome analysis. Genome Res. 2005;15:1451–1455. doi: 10.1101/gr.4086505. [DOI] [PMC free article] [PubMed] [Google Scholar]
- Kent WJ, et al. The human genome browser at UCSC. Genome Res. 2002;12:996–1006. doi: 10.1101/gr.229102. [DOI] [PMC free article] [PubMed] [Google Scholar]
- Kirk D, Hwu W. Programming Massively Parallel Processors: A Hands-On Approach. Burlington, MA: Elsevier; 2010. [Google Scholar]
- Li H, et al. The sequence alignment/map (SAM) format and SAMtools. Bioinformatics. 2009;25:2078–2049. doi: 10.1093/bioinformatics/btp352. [DOI] [PMC free article] [PubMed] [Google Scholar]
- McKenney M, McGuire T. Proceedings of the 17th ACM SIGSPATIAL International Conference on Advances in Geographic Information Systems. 2009. A parallel plane sweep algorithm for multi-core systems. GIS ’09, pp. 392–395. ACM, New York, NY, USA. [Google Scholar]
- Merrill D, Grimshaw A. High performance and scalable radix sorting: a case study of implementing dynamic parallelism for GPU computing. Parallel Process. Lett. 2011;21:245–272. [Google Scholar]
- Mirsa J, Gries D. Finding repeated elements. Sci. Comput. Progr. 1982;2:143–152. [Google Scholar]
- Neph S, et al. BEDOPS: high performance genomic feature operations. Bioinformatics. 2012;28:1919–1920. doi: 10.1093/bioinformatics/bts277. [DOI] [PMC free article] [PubMed] [Google Scholar]
- Quinlan AR, Hall IM. BEDTools: a flexible suite of utilities for comparing genomic features. Bioinformatics. 2011;26:841–842. doi: 10.1093/bioinformatics/btq033. [DOI] [PMC free article] [PubMed] [Google Scholar]
- Richardson JE. fjoin: simple and efficient computation of feature overlaps. J. Computat. Biol. 2006;13:1457–1464. doi: 10.1089/cmb.2006.13.1457. [DOI] [PubMed] [Google Scholar]
- Satish N, et al. International Symposium on Parallel and Distributed Processing, 2009. 2009. Designing efficient sorting algorithms for manycore GPUs. IPDPS ’09, pp. 1–10. IEEE. [Google Scholar]
- The 1000 Genomes Project Consortium (2010) A map of human genome variation from population-scale sequencing. Nature. 467:1061–1073. doi: 10.1038/nature09534. [DOI] [PMC free article] [PubMed] [Google Scholar]
- Tzeng S, Wei LY. Proceedings of the 2008 Symposium on Interactive 3D Graphics and Games. 2008. Parallel white noise generation on a GPU via cryptographic hash. I3D ’08, pp. 79–87. ACM, New York, NY, USA. [Google Scholar]
Associated Data
This section collects any data citations, data availability statements, or supplementary materials included in this article.