

Abstract
During the secondary injury period after traumatic brain injury (TBI), depolarization of neurons mediated by voltage-gated sodium channels (VGSCs) leads to cellular abnormalities and neurological dysfunction. Alterations in expression of different α subunits of VGSCs can affect early brain pathology following TBI. This study detected the expression of Nav1.3 mRNA and protein in the rat cortex post-TBI. Adult male Sprague–Dawley rats were randomly assigned to sham-TBI, mild-TBI (mTBI), or severe-TBI (sTBI) groups. TBI was induced using a fluid percussion device at magnitudes of 1.5–1.6 atm (mTBI) and 2.9–3.0 atm (sTBI). Nav1.3 mRNA and protein levels in the ipsilateral-injured cortex were examined at 2 h, 12 h, 24 h, and 72 h post-TBI by real-time reverse transcriptase quantitative polymerase chain reaction and Western blot. Brains were collected at 24 h, 72 h, and 7 days post-TBI for TUNEL staining and cell count analysis. Immunofluorescence was performed to localize expression of Nav1.3 protein in the ipsilateral-injured cortex. Expression of Nav1.3 mRNA and protein were significantly upregulated in mTBI and sTBI groups when compared with the sham-TBI group at 2 h and 12 h post-TBI. Nav1.3 mRNA and protein levels in the sTBI group were much higher than in the mTBI group at 12 h post-TBI. TUNEL-positive cell numbers were significantly higher in the sTBI group than in the mTBI at 24 h, 72 h, and 7 days post-TBI. Expression of Nav1.3 was observed predominantly in neurons of the cortex. These findings indicated significant upregulation in the expression of Nav1.3 mRNA and protein in the rat ipsilateral-injured cortex at the very early stage post-TBI, and were also correlated with TBI severity.
Key words: Nav1.3, rat, sodium channel, TBI
Introduction
Traumatic brain injury (TBI) is a prominent worldwide health problem that causes chronic disability and death.1,2 Secondary brain injury, as a result of the primary mechanical insult, involves complex physiological and biochemical cascades that are not yet completely understood.3 It is generally well accepted that secondary brain injury includes, but is not limited to, cerebral ischemia/hypoxia, disrupted blood–brain barrier (BBB), dysfunction of ionic channels, vasogenic and cytotoxic edema, and inflammation.4–6 Studies have shown that high levels of expression of voltage-gated sodium channels (VGSCs) play an important role during brain edema. Uncontrolled brain edema is strongly associated with disability and mortality in TBI.7–9
VGSCs consist of α and β subunits. Nine Nav1 α subunit genes (Nav1.1–9), which contain the ion-selective pore and act as a voltage sensor within the cell membrane, have been identified in mammals.10 VGSCs α subunits play an important role in different tissues. For example, Kang and coworkers11 reported that VGSCs in the cortex were a major route for Na+ influx during hypoxia and ischemia. Peripheral nerve injury caused by trauma or surgery may upregulate Nav1.3 and downregulate Nav1.8 in injured dorsal root ganglia, and intrathecal lidocaine pretreatment alleviates neuropathic pain by modulating Nav1.3 expression and decreasing spinal microglial activation.12 Altered concentration of mRNA and protein of Nav1.1, Nav1.2, Nav1.3, and Nav1.6 have been reported in acquired epilepsy in mammals.13–15
Nav1.1, Nav1.2, and Nav1.6 are abundant in the central nervous system (CNS), whereas Nav1.3 is mostly present during embryonic development.16 To our knowledge, there is no report about the expression of Nav1.3 in the CNS post-TBI. We aimed to gain a better understanding of Nav1.3 with respect to its underlying role associated with secondary brain injury following TBI.
Methods
Animal preparation
Because of the different mortality in each group, 170 male Sprague–Dawley rats (280–310 g) were randomized into three groups: sham TBI (n=45), mTBI (n=49), and sTBI (n=76). All animal protocols followed the Principles of Laboratory Animal Care formulated by National Committee of Medical Research, and the Guide for the Use of Laboratory Animals issued by Institute of Laboratory Animal Resources of China, and were approved by the Shanghai Jiao Tong University School of Medicine Research Animal Care and Use Committee. Rats were housed in individual cages in a temperature (22–25°C) and humidity-controlled (50% relative) animal facility with 12 h light/ dark cycle. Rats were housed in the animal facility for at least 7 days prior to surgery, and they had free access to food and water.
Experimental design
All groups were subjected to surgery 1 day prior to lateral fluid percussion injury (LFPI). On the injury day, rats in the mTBI and sTBI groups were injured at 1.5–1.6 atm and 2.9–3.0 atm, respectively. Rats in the sham-TBI group underwent all the surgical procedures without TBI.
In study 1, expressions of mRNA and protein for Nav1.3 in the ipsilateral-injured cortex were examined in rats of all groups at 2 h, 12 h, 24 h, and 72 h post-TBI by real-time reverse transcriptase quantitative polymerase chain reaction (RT-qPCR) and Western blot (n=6 per group at each time point). In study 2, brains from all groups were collected at 24 h, 72 h, and 7 days post-TBI, and sections were stained with TUNEL for degenerating neurons (n=6 per group at each time point). In study 3, brains in sham TBI and mTBI group were removed at 2 h post-TBI for cryosections (n=3 per group). Double labeling with Nav1.3 antibody and neuronal nuclei-specific antibody (NeuN) was performed to verify that immunoreactivity was observed in neurons.
Surgical procedure
One day prior to TBI, animals were anesthetized by 0.4% sodium pentobarbital (40 mg/kg, i.p.) and mounted in a stereotaxic frame. A midline scalp incision was made between the eyes and ears, and a craniectomy (4.8 mm) was performed on the left parietal bone (midway between bregma and lambda). A rigid plastic injury tube (modified 22 gauge needle hub, 2.6 mm inside diameter) was placed on the exposed, intact dura. Two stainless steel screws (1.5 mm diameter, 5.5 mm length) were placed 1 mm rostral to bregma and 1 mm caudal to lambda. The injury tube was secured to the skull with dental cement. Bone wax was used to cover the open needle hub connector after the dental cement hardened (5 min). The scalp was sutured closed, and animals were returned to their cages for recovery.
Lateral fluid percussion brain injury
Rats were subjected to TBI 24 h after the surgical preparation, in order to minimize possible confounding effects of surgical trauma. The fluid percussion injury device (VCU Biomedical Engineering, Richmond, VA) has been described previously by Dixon and coworkers17 and McIntosh and coworkers.18 In brief, the device consists of a plexiglas cylindrical reservoir filled with 37°C isotonic saline. One end of the reservoir has a rubber-covered plexiglas piston mounted on o-rings, and the opposite end has a pressure transducer housing with a 2.6 mm inside diameter male needle hub opening. Injury was induced by the descent of a metal pendulum striking the piston, thereby injecting a small volume of saline epidurally into the closed cranial cavity and producing a brief displacement and deformation of neural tissue. The resulting pressure pulse was measured in atm by an extracranial transducer (Statham PA 85-100; Gould, Oxnard, CA) and recorded on a storage oscilloscope (Tektronix 5111; Tektronix, Beaverton, OR).
On TBI day, rats were anesthetized with 2% isoflurane in a 2:1 nitrous oxide/ oxygen mixture, intubated, and maintained on a ventilator (ALC-V8S, Shanghai Alcott Biotech Ltd., Shanghai, China). Rectal temperature (37±0.4°C) was continuously monitored and maintained by a feedback temperature controlled pad. Brain temperature (36±0.4°C) was directly measured by insertion of a 29 gauge needle probe between the temporalis muscle and skull. The suture was opened and bone wax was removed. Rats were disconnected from the ventilator, and the injury tube was connected to the fluid percussion cylinder. Then a fluid pressure pulse was applied for ∼10 ms directly onto the exposed dura producing mTBI (1.5–1.6 atm) or sTBI (2.9–3.0 atm). The injury was delivered within 10 sec after disconnecting from the ventilator.
Immediately after fluid percussion injury, rats were observed for apneic occurrence. After the initial observation, rats were ventilated with a 2:1 nitrous oxide/oxygen mixture without isoflurane, and the rectal and temporalis muscle temperature were recorded. Then the needle hub, screws, and dental cement were removed from the skull and the scalp was sutured closed. As soon as spontaneous breathing was observed, apneic duration was recorded, and rats were extubated and placed in a supine position. Assessment of the righting reflex began at regular intervals (∼20 sec) to test the rat`s ability to spontaneously recover to prone position. The duration of suppression of the righting reflex was recorded as the righting time. Sham TBI group rats were subjected to all anesthetic and surgical procedures but without injury.
Tissue collection and sectioning
Rats were anesthetized deeply by sodium pentobarbital (100 mg/kg, i.p.). For Nav1.3 mRNA and protein analysis, rats were perfused transcardially with 200 mL of 4°C normal saline, and the sample cortex surrounding the contusion area (or surrounding the parietal craniotomy in the sham TBI group) were collected (Fig. 1). The obtained tissue samples were frozen in liquid nitrogen, and kept at −80°C for RT-qPCR and Western blot.
FIG. 1.
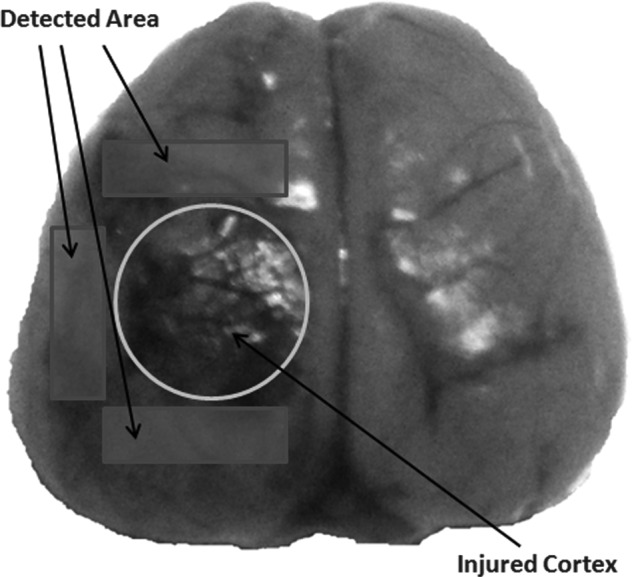
Schematic representation of the cortical contusion and the region of interest. The cortical contusion area was depicted by the circle, and the pericontusional areas were depicted by the rectangles, used for Nav1.3 mRNA, protein analysis.
For TUNEL staining and immunostaining, rats were perfused transcardially with 200 mL of 4°C normal saline, followed by 250 mL of ice cold 4% paraformaldehyde (PFA; pH=7.4). Brains were removed and post-fixed for 4 h in 4% PFA at 4°C, then cryoprotected overnight in 20% sucrose solution followed by 1 day in a 30% sucrose solution. Paraffin-embedded brain tissue sections were used for TUNEL analysis, and cryosections were used for immunostaining. Serial coronal sections (25 μm) were collected between −1.80 mm bregma and −4.80 mm bregma. Every fifth section for a total of 24 sections was selected for staining.
RT-qPCR
Total RNA was extracted with TRIZOL Reagent (Invitrogen Ltd., Life Technologies, Paisley, Scotland) according to the manufacturer`s instructions. The cDNA synthesis from the isolated RNA was performed using a reverse transcriptional system (total 15 μL) consisting of 2 μg of RNA, 1 μL of oligo (dT)15 primer (Shanghai Sangon Biological Engineering Technology and Service Co., Ltd., Shanghai, China). The tube was heated to 70°C for 5 min, and then cooled on ice for 2 min. A volume of 5 μL of 5×M-MLV Reaction Buffer, 1.25 μL of 10 mmol/L each of dATP, dCTP, dGTP, and dTTP, 25 U of RNasin Rnase Inhibitor, and 200 U of M-MLV RT Rnase H- (Promega Biotech CO., Ltd., Beijing, China) were added to the reagent to give a total reaction volume of 25 μL. Then the tube was incubated at 42°C for 60 min and kept at −20°C. The cDNA was amplified by PCR using specific oligonucleotide primers. Follow as Nav1.3: forward and reverse primers were 5′-CCCAACTACGGCTACACAAGC-3′, 5′-CCTGAGTCATGAGTCGAAACAGG-3′; glyceraldehyde-3-phosphate dehydrogenase (GAPDH) forward and reverse primers were 5′-ATCACTGCCACTCAGAAGAC-3′ and 5′-AAGTCACAGGAGACAACCTG-3′. A volume of 20 μL PCR reaction included a 2 μL cDNA sample, 10 μL of 2×SYBR Premix Ex Taq (TaKaRa, Ltd., Tokyo, Japan) and 2 μL of each gene-specific forward and reverse primer described previously. All PCR reactions were performed in a Lightcycler PCR detection system (Roche Diagnostics Ltd., Shanghai, China). GAPDH, the most commonly used housekeeping gene, was selected as the reference gene in qPCR.19 The Nav1.3/ GAPDH product ratios were calculated and considered as an index of Nav1.3 mRNA expression.
Western blot
Brain cortical tissue from each group was homogenized and sonicated for 1 min in a lysis buffer (Beyotime Institute of Biotechnology, Jiangsu, China). Protein concentration was determined with a protein assay kit (Bio-Rad, Hercules, CA). Aliquots of 100 μg proteins were separated on Tris-Glycine 4–20% gels, and transferred to a polyvinylidene difluoride membrane (Millipore, Billerica, MA) before being incubated with the primary rabbit polyclonal antibody for Nav1.3 (1:50 dilution; Alomone Labs, Jerusalem, Israel) and mouse monoclonal antibody for β-actin (1: 50000 dilution; Sigma-Aldrich, St. Louis, MO). The membranes were blocked in 5% nonfat milk for 60 min, and then incubated overnight at 4°C with the primary antibody. Membranes were washed three times with Tris-buffered saline, and then incubated with goat anti-rabbit IgG (whole molecule)–peroxidase antibody (1:80000 dilution; Sigma-Aldrich) and goat anti-mouse IgG (Fc specific)–peroxidase antibody (1:100000; Sigma-Aldrich). After being washed three times, immunoreactive bands were visualized by using Amersham ECL Plus Western Blotting Detection Reagents (GE Healthcare, USA). The blots were stripped and re-probed with mouse anti-β-actin as a control for equal loading. These experiments were repeated three times.
TUNEL staining
Sections were mounted on slides for detection of apoptosis by using Roche TUNEL staining kit (Penzberg, Germany). Sections were de-waxed in xylene and rehydrated through graded ethanol, and then rinsed in distilled water. After rinsing in the blocking solution of methanol+3% hydrogen peroxide for 10 min and washed with PBS (0.1M, 3×1 min), sections were placed in a TUNEL reaction mixture for 60 min at 30°C. After another wash with phosphate-buffered saline (PBS; 3×1 min), sections were rinsed in a converter-POD solution at 37°C for 30 min. Sections were then rinsed with PBS (3×1 min) and then reacted with DAB substrate at 20°C for 10 min followed by a PBS rinse (3×1 min). Eventually, sections were dehydrated in a series of alcohols, cover-slipped and analyzed under light microscope. The investigator was blinded to the group conditions. Because of the vast number of positive cells in the region of interest, semi-quantitative counts were performed. One thousand cells in the vicinity of lesion area were examined at a magnification of 400×, and the results were expressed as an apoptotic index (the average number of positive cells per hundred cortical cells) to quantify apoptosis.
Double immunofluorescent staining
To verify the immunoreactivity occurring in neurons, double labeling with Nav1.3 antibody and NeuN was performed on the selected cryosections described previously. Sections were first blocked with 0.1% Triton™ X-100 for 2 h in order to avoid unspecific staining. First, the sections were incubated with the primary rabbit polyclonal antibody for Nav1.3 (1:50 dilution; Alomone Labs, Jerusalem, Israel) at 37°C for 1 h. After three washes with PBS, sections were then incubated with the second antibody of Alexa Fluor 555 goat anti-rabbit IgG (Invitrogen Ltd., Life Technologies, Paisley, Scotland) at 37°C for 30 min. During the second immunofluorescent staining, tissues were rinsed with three washes of PBS, the same procedure described previously with the primary mouse anti-human NeuN protein monoclonal antibody (maixin.bio, Co., Ltd., Fuzhou, China) and the second antibody of Alexa Fluor 488 goat anti-mouse IgG ((Invitrogen Ltd., Life Technologies, Paisley, Scotland). The stained sections were examined with a Leica fluorescence microscope (Leica, DM 5000B; Germany).
Statistical analysis
All data were presented as mean±standard deviation (STD) of n determinations or as mentioned, and analyzed using statistical software (SPSS Version 13.0, SPSS Inc, Chicago, IL). Statistical significance was evaluated using one-way ANOVA followed by Bonferroni`s post-hoc test. Mann–Whitney U test was used to analyze the apoptotic index of different groups, and χ2 test was used for the analysis of mortality rate in all groups. The Pearson bivariate correlation test was used to analyze the mRNA-protein correlation. A p value<0.05 was considered statistically significant for all comparisons.
Results
Acute physiology
There were no significant differences among groups in pre-TBI body weight or temporalis muscle and rectal temperature values pre-TBI or post-TBI (Table 1). The mortality rate of each group was correlated with the severity of the TBI. The mortality rates were 0%, 8.2%, and 44.7% in sham TBI, mTBI, and sTBI groups, respectively. When gross pathology was performed in the dead rats, we observed subarachnoid blood pooling underneath the injury site. Cerebral hemorrhage was extensive in the posterior cranial fossa and surrounding the pontomesencephalic and cervicomedullary junctions.
Table 1.
Acute Physiological Data Following TBI in Rats
| |
|
|
|
|
|
|
|
|
|
|
|
Transient apnea |
|||
|---|---|---|---|---|---|---|---|---|---|---|---|---|---|---|---|
| |
|
|
|
|
Rectal temp (°C) |
Temporalis temp (°C) |
|
Pulmonary edema (%) |
Non-survivors |
Survivors |
|||||
| Group | Sample | Body weight (g) (Pre-TBI) | Injury (atm) | Mortality in 7 days (%) | Pre- TBI | Post- TBI | Pre- TBI | Post- TBI | Righting time (min) Survivors | Non-survivors | Survivors | Incidence (%) | Median duration (sec) | Incidence (%) | Mean duration (sec) |
| Sham TBI | 45 | 295±8 | - | 0 | 37.1±0.3 | 37.1±0.4 | 36.0±0.3 | 36.0±0.3 | 2.7±0.2 | - | 0 | 0 | - | 0 | - |
| mTBI | 49 | 294±8 | 1.55±0.03 | 8.2 | 37.2±0.3 | 37.0±0.3 | 36.0±0.4 | 35.8±0.4 | 5.4±0.4* | 75.0 | 0 | 0 | - | 13.3 | 23.5±6.4 |
| sTBI | 76 | 296±9 | 2.94±0.03 | 44.7*# | 37.1±0.4 | 37.1±0.3 | 35.8±0.3 | 35.8±0.3 | 28.7±3.6*# | 58.8 | 0 | 61.8 | 65$ | 33.3 | 48.6±6.1# |
-, not applicable; *, significantly different (p<0.01, vs. sham TBI group); #, significantly different (p<0.01, vs. mTBI group);
$, standard deviation not shown because of abnormal distribution.
TBI, traumatic brain injury; mTBI, mild TBI; sTBI, severe TBI.
The righting time in each group also correlated with the severity of injury. There was a significant difference among the groups (p<0.01). The occurrence of pulmonary edema was defined as the presence of pink fulminating exudate from the mouth and nostrils. There was no incidence of pulmonary edema among the survivors in all groups. There was no incidence of apneic episodes in non-survivors of the mTBI group, but there was a high incidence (61.8%) of apnea in non-survivors of the sTBI group. It should be noted that irreversible apnea occurred in two of the non-survivors of the sTBI group, and the apneic duration was recorded as 300 sec. However, the incidence of apneic episodes, among the survivors, differed between the mTBI group and the sTBI group. Furthermore, mean apneic duration of the mTBI group was significantly lower than that of the sTBI group (p<0.01).
Expression of Nav1.3 mRNA upregulated in the ipsilateral-injured cortex after TBI
Expression of Nav1.3 mRNA at the early stage post-TBI was illustrated in Figure 2. The mRNA level of Nav1.3, in both the mTBI and sTBI groups, increased significantly at 2 h post-TBI and peaked at 12 h post-TBI, whereas no changes were found in the sham TBI group. Data showed significant differences at 2 h post-TBI (1.77±0.27 in the sTBI group vs. 1.18±0.16 in the sham TBI group, p<0.01; and 1.56±0.16 in mTBI group vs. 1.18±0.16 in sham-TBI group, p<0.05) and 12 h post-TBI (2.75±0.17 in sTBI group and 2.14±0.17 in mTBI group vs. 1.20±0.14 in sham-TBI group, p<0.01). Furthermore, the mRNA level of Nav1.3 in the sTBI group was significantly higher than that in the mTBI group at 12 h post-TBI (p<0.01). However, mRNA expression of the Nav1.3 decreased dramatically in the mTBI and sTBI groups at 24 h and 72 h post-TBI when compared with its respective 2 h and 12 h time points (p<0.05). There is no significant difference among these three groups at 24 h and 72 h post-TBI. The mRNA levels of Nav1.3 in the sham-TBI group were not significantly different at all the timepoints. The data for Nav1.3 mRNA represent values normalized to GAPDH, and GAPDH was maintained as a relative invariant throughout the study.
FIG. 2.

Nav1.3 mRNA level increased in the ipsilateral cortex post-traumatic brain injury (TBI). The level of Nav1.3 expression in sham-TBI group (white bar), mild TBI (mTBI) group (gray bar), and severe TBI (sTBI) group (black bar) at 2 h, 12 h, 24 h, and 72 h post-TBI were quantified by reverse transcriptase polymerase chain reaction (RT-PCR) (n=6 per group). Values marked with asterisk were significantly different between the selected groups at p<0.05. Values marked with # were significantly different between the selected groups at p<0.01.
Nav1.3 protein increased in the ipsilateral-injured cortex after TBI
Nav1.3 protein immunoreactivity data were normalized to β-actin immunoreactivity data for each tissue sample. A ratio of Nav1.3 protein level, in each group to the sham TBI group at each time point, allowed us to determine whether TBI affected the expression of Nav1.3 protein. As shown in Figure 3, expression of Nav1.3 protein in mTBI group and sTBI group was significantly increased at 2 h post-TBI (297±57 in the sTBI group and 224±55 in the mTBI group vs. 100±36 in the sham TBI group, p<0.01) and peaked at 12 h post-TBI (509±59 in the sTBI group and 402±64 in the mTBI group vs. 100±40 in the sham TBI group, p<0.01). Furthermore, the Nav1.3 protein level in the sTBI group was significantly higher than that in the mTBI group at 2 h and 12 h post-TBI (p<0.01). Similar to the expression level profile of mRNA, the Nav1.3 protein level in the mTBI and sTBI groups decreased to a level close to that of the sham TBI group at 24 h and 72 h post-TBI, and no significant difference could be find among these three groups (p>0.05). The mRNA and protein correlation coefficient was 0.445 (p<0.01).
FIG. 3.

Nav1.3 protein level increased in the ipsilateral cortex post-traumatic brain injury (TBI). The level of Nav1.3 expression in sham TBI group (white bar), mild TBI (mTBI) group (gray bar), and severe TBI (sTBI) group (black bar) 2 h, 12 h, 24 h, and 72 h post-TBI were quantified by Western blot (n=6 per group). Values were the ratio of the protein levels between each group and the sham TBI group at each time point. Top: representative immunoblots of Nav1.3 proteins and corresponding actin bands. Values marked with asterisk were significantly different between the selected groups at p<0.05. Values marked with # were significantly different between the selected groups at p<0.01.
Apoptotic cell counting
No TUNEL-positive cells were detected in sham TBI group (Fig. 4G); therefore, cell count data from the sham TBI group were not included in subsequent statistical analyses. The majority of TUNEL-stained nuclei (yellowish brown color), were detected at 24 h post-TBI in the mTBI (Fig. 4A) and sTBI groups (Fig. 4B), and the number of the apoptotic cells displayed a downregulated trend as time went by post-TBI in these two groups (Fig. 4C–F). Quantitation analysis revealed a significant increase in the apoptotic index in sTBI group at 24 h, 72 h, and 7 days post-TBI when compared with the mTBI group (Fig. 4H, p<0.01).
FIG. 4.

Degenerating cells detected by TUNEL staining at 24 h, 72 h, and 7 days post-traumatic brain injury (TBI) (n=6 per group). A large increase in the proportion of degenerating neurons was observed in the severe TBI (sTBI) group (B, D, and F) compared with the mild TBI (mTBI) group (A, C, and E). No cellular degeneration was observed in the sham TBI group (G). Semi-quantification analysis of degenerating cells was shown in H (mTBI group in white bar, and sTBI group in black bar). Data were presented as median because of its abnormal distribution. Values marked with # were significantly different between mTBI and sTBI groups at p<0.01. Arrows indicated the typical apoptotic cells (scale bar=50 μm).
Localization of Nav1.3 in the injured cortex
Because of the irregular neuronal morphology found in the sTBI group, double-immunofluorescence labeling for Nav1.3 and NeuN was performed on sections from the sham TBI and mTBI groups at 2 h post-TBI. As shown in Figure 5, broad co-localization of Nav1.3 and NeuN markers were found in the mTBI group, whereas very weak immunofluorescence of Nav1.3 in the sham-TBI group could be observed in neurons on the ipsilateral-injured cortex. The results indicated that upregulation of Nav1.3 occurred on neural cell membranes.
FIG. 5.

Nav1.3 co-localization with the neuronal marker neuronal nuclei-specific antibody (NeuN) in the pericontusional area in the sham TBI group (A, C, and E) and mild TBI (mTBI) group (B, D, and F) at 2 h post TBI. Representative NeuN labeled cells (green in A and B), and Nav1.3-labeled cells (red in D), were seen within the photomicrographs. When double-stained for NeuN and Nav1.3, there were extensive Nav1.3 expressions on neural cell membranes in the mTBI group (F). However, the Nav1.3 expressions were hardly observed in the sham-TBI group (E). (Scale bars=100 μm). Color image is available online at www.liebertonline.com/neu
Discussion
For the first time, we demonstrated a significant upregulation of Nav1.3 in the rat brain cortex during the early stages post-TBI, which was related to the magnitude of injury. These results suggest an important role for altered expression of VGSCs occurring during secondary brain injury, which can lead to transient or chronic neurological disorder, or even death.
For decades, Nav1.3, a tetrodotoxin-sensitive channel, has been investigated in peripheral neuropathic pain but not in the CNS, because of its minute detectable level in the adult rodent CNS.12,20,21 A recent study demonstrated that expression of Nav1.3 was upregulated in the affected gingival tissue of patients with trigeminal neuralgia.22 Upregulation of Nav1.3 mRNA and protein levels was reported in the hippocampus of rat after electrically induced status epilepticus and in spontaneously epileptic rat.13,23 In humans, Nav1.3 mRNA was found to be expressed at a significantly higher level in the epileptic hippocampus.24 One mutation, K354Q, has been reported in Nav1.3 in a patient with cryptogenic epilepsy.25 In addition, Estacion and colleagues demonstrated that K354Q mutation enhanced the Nav1.3 persistent current nearly twofold, and the ramp current more than twofold.26 Nav1.3 upregulation also has been observed in spinal cord and thalamus neurons after traumatic spinal cord injury.27,28 These studies indicate that Nav1.3 plays an important role in different diseases relative to the nervous system.
In the present study, the cause of death consists of intracranial hematoma, pulmonary edema, irreversible apnea, and marasmus. Undoubtedly, sTBI resulted in more severe neurological insult than mTBI, as demonstrated by the acute physiological outcome and TUNEL staining. Nav1.3 protein was predominantly co-localized in neuronal membranes and changes in the expression of Nav1.3 mRNA and protein was related to the severity of TBI. Based on these results, the development of secondary brain injury can be thought of in this manner: TBI causes an excessive activation of VGSCs (including the upregulation of Nav1.3) followed by influx of Na+, Cl−, and water, leading to cytotoxic edema and apoptotic cell death.
Both mRNA and protein expression levels of Nav1.3 showed similar changes over time in the mTBI and sTBI groups post-TBI. However, statistical analysis indicated that the correlation coefficient of mRNA and protein expression levels was only 0.445. The process of transcription is complicated, and can be affected by many factors, such as degradation of mRNA and protein, varying rates of translation, and systematic measurement errors. The quantitative relationship between mRNA and its encoded protein is far from entirely known.29 According to the transcriptional control paradigm, protein expression is governed by factors that control transcription of an mRNA.30 Consequently, there should be a delay between mRNA and protein expression. We may have missed earlier expression of mRNA that could have preceded the initial protein translation and expression. Therefore, the genomic events might have occurred prior to our first measurement at the 2 h time point post-TBI.
There is a wide array of mechanisms that can trigger secondary brain injury, such as cerebral ischemia/hypoxia, disruption of BBB, inflammation, and others. Excessive activation of VGSCs likely plays an important role in secondary brain injury and may contribute to other mechanisms described previously. Nav1.3, which is expressed in very low levels in adults, is significantly upregulated at the early stages post-TBI, suggesting that Nav1.3 may play an important role in secondary brain injury. As described, upregulation of Nav1.3 may contribute to different diseases, including TBI. This indicates that VGSCs blockers focused on Nav1.3 may be an effective therapy for these diseases. For example, Hains and colleagues reported that intrathecal administration of antisense oligodeoxynucleotides targeting Nav1.3 decreased expression of Nav1.3 mRNA and protein, reduced hyperexcitability of multireceptive dorsal horn neurons, and attenuated mechanical allodynia and hyperalgesia after spinal cord injury.27
The results of the present study demonstrated that TBI results in significant upregulation of Nav1.3 mRNA followed by a similar increase in Nav1.3 protein in the ipsilateral-injured cortex. Future research work will be needed to study the critical earlier time point for alteration of Nav1.3 expression post-TBI, and elucidate the relationship between Nav1.3 expression and secondary brain injury. Interrupting the upregulation of Nav1.3 may become an important modality for treating TBI and other neurological diseases.
Conclusion
In conclusion, upregulation of Nav1.3, including mRNA and protein, was found in ipsilateral-injured cortex at the very early stage after TBI. Alterations in expression of Nav1.3, occurring on neural cell membranes, were correlated with severity of TBI. Our results indicate that Nav1.3 may play an important role during secondary brain injury.
Acknowledgments
This work was supported by grants from National Science and Nature Grant (No.30973086 and No.30901543), National Health Science Grant (No. 200802093), National Key Basic Research Project (No. 2012CB518100), Science and Technology Committee of Shanghai (No. 10JC1409800 and No. 08411951900), and Program for Shanghai Outstanding Medical Academic Leaders. We thank Dr. Bruce G. Lyeth and Ken C. Van, Department of Neurological Surgery, University of California Davis, for their editorial support and critical review of the article.
Author Disclosure Statement
No competing financial interests exist.
References
- 1.Bragge P. Chau M. Pitt V.J. Bayley M. Eng J.J. Teasell R. Wolfe D.L. Gruen R.L. An overview of published research about the acute care and rehabilitation of traumatic brain injured and spinal cord injured patients. J. Neurotrauma. 2012;29:1539–1547. doi: 10.1089/neu.2011.2193. [DOI] [PubMed] [Google Scholar]
- 2.Hoane M.R. Kaplan S.A. Ellis A.L. The effects of nicotinamide on apoptosis and blood–brain barrier breakdown following traumatic brain injury. Brain Res. 2006;1125:185–193. doi: 10.1016/j.brainres.2006.10.019. [DOI] [PubMed] [Google Scholar]
- 3.Das M. Leonardo C.C. Rangooni S. Mohapatra S.S. Mohapatra S. Pennypacker K.R. Lateral fluid percussion injury of the brain induces CCL20 inflammatory chemokine expression in rats. J. Neuroinflammation. 2011;8:148. doi: 10.1186/1742-2094-8-148. [DOI] [PMC free article] [PubMed] [Google Scholar]
- 4.Coles J.P. Fryer T.D. Smielewski P. Chatfield D.A. Steiner L.A. Johnston A.J. Downey S.P. Williams G.B. Aigbirhio F. Hutchinson P.J. Rice K. Carpenter T.A. Clark J.C. Pickard J.D. Menon D.K. Incidence and mechanisms of cerebral ischemia in early clinical head injury. J. Cereb. Blood Flow Metab. 2004;24:202–211. doi: 10.1097/01.WCB.0000103022.98348.24. [DOI] [PubMed] [Google Scholar]
- 5.Khan M. Im Y.B. Shunmugavel A. Gilg A.G. Dhindsa R.K. Singh A.K. Singh I. Administration of S-nitrosoglutathione after traumatic brain injury protects the neurovascular unit and reduces secondary injury in a rat model of controlled cortical impact. J. Neuroinflammation. 2009;6:32. doi: 10.1186/1742-2094-6-32. [DOI] [PMC free article] [PubMed] [Google Scholar]
- 6.Mao Q. Jia F. Zhang X.H. Qiu Y.M. Ge J.W. Bao W.J. Luo Q.Z. Jiang J.Y. The up-regulation of voltage-gated sodium channel Nav1.6 expression following fluid percussion traumatic brain injury in rats. Neurosurgery. 2010;66:1134–1139. doi: 10.1227/01.NEU.0000369612.31946.A2. [DOI] [PubMed] [Google Scholar]
- 7.Simard J.M. Kent T.A. Chen M. Tarasov K.V. Gerzanich V. Brain oedema in focal ischaemia: molecular pathophysiology and theoretical implications. Lancet Neurol. 2007;6:258–268. doi: 10.1016/S1474-4422(07)70055-8. [DOI] [PMC free article] [PubMed] [Google Scholar]
- 8.Stein D.G. Wright D.W. Kellermann A.L. Does progesterone have neuroprotective properties? Ann Emerg. Med. 2008;51:164–172. doi: 10.1016/j.annemergmed.2007.05.001. [DOI] [PubMed] [Google Scholar]
- 9.Wix–Ramos R. Eblen–Zajjur A. Time course of acute neuroprotectiveeffects of lithium carbonate evaluated by brain impedanciometry in the global ischemia model. Can. J. Physiol. Pharmacol. 2011;89:753–758. doi: 10.1139/y11-073. [DOI] [PubMed] [Google Scholar]
- 10.Catterall W.A. Goldin A.L. Waxman S.G. International Union of Pharmacology. XLVII. Nomenclature and structure–function relationships of voltage-gated sodium channels. Pharmacol. Rev. 2005;57:397–409. doi: 10.1124/pr.57.4.4. [DOI] [PubMed] [Google Scholar]
- 11.Kang X. Chao D. Gu Q. Ding G. Wang Y. Balboni G. Lazarus L.H. Xia Y. Delta-opioid receptors protect from anoxic disruption of Na+ homeostasis via Na+ channel regulation. Cell. Mol. Life Sci. 2009;66:3505–3516. doi: 10.1007/s00018-009-0136-x. [DOI] [PMC free article] [PubMed] [Google Scholar]
- 12.Cheng K.I. Lai C.S. Wang F.Y. Wang H.C. Chang L.L. Ho S.T. Tsai H.P. Kwan A.L. Intrathecal lidocaine pretreatment attenuates immediate neuropathic pain by modulating Nav1.3 expression and decreasing spinal microglial activation. BMC Neurol. 2011;11:71. doi: 10.1186/1471-2377-11-71. [DOI] [PMC free article] [PubMed] [Google Scholar]
- 13.Aronica E. Yankaya B. Troost D. van Vliet E.A. Lopes da Silva F.H. Gorter J.A. Induction of neonatal sodium channel II and III alpha-isoform mRNAs in neurons and microglia after status epilepticus in the rat hippocampus. Eur. J. Neurosci. 2001;13:1261–1266. doi: 10.1046/j.0953-816x.2001.01502.x. [DOI] [PubMed] [Google Scholar]
- 14.Blumenfeld H. Lampert A. Klein J.P. Mission J. Chen M.C. Rivera M. Dib–Hajj S. Brennan A.R. Hains B.C. Waxman S.G. Role of hippocampal sodium channel Nav1.6 in kindling epileptogenesis. Epilepsia. 2009;50:44–55. doi: 10.1111/j.1528-1167.2008.01710.x. [DOI] [PMC free article] [PubMed] [Google Scholar]
- 15.Mantegazza M. Gambardella A. Rusconi R. Schiavon E. Annesi F. Cassulini R.R. Labate A. Carrideo S. Chifari R. Canevini M.P. Canger R. Franceschetti S. Annesi G. Wanke E. Quattrone A. Identification of an Nav1.1 sodium channel (SCN1A) loss-of-function mutation associated with familial simple febrile seizures. Proc. Natl. Acad. Sci. U. S. A. 2005;102:18,177–18,182. doi: 10.1073/pnas.0506818102. [DOI] [PMC free article] [PubMed] [Google Scholar]
- 16.Leterrier C. Brachet A. Fache M.P. Dargent B. Voltage-gated sodium channel organization in neurons: protein interactions and trafficking pathways. Neurosci. Lett. 2010;486:92–100. doi: 10.1016/j.neulet.2010.08.079. [DOI] [PubMed] [Google Scholar]
- 17.Dixon C.E. Lyeth B.G. Povlishock J.T. Findling R.L. Hamm R.J. Marmarou A. Young H.F. Hayes R.L. A fluid percussion model of experimental brain injury in the rat. J. Neurosurg. 1987;67:110–119. doi: 10.3171/jns.1987.67.1.0110. [DOI] [PubMed] [Google Scholar]
- 18.McIntosh T.K. Vink R. Noble L. Yamakami I. Fernyak S. Soares H. Faden A.L. Traumatic brain injury in the rat: characterization of a lateral fluid-percussion model. Neuroscience. 1989;28:233–244. doi: 10.1016/0306-4522(89)90247-9. [DOI] [PubMed] [Google Scholar]
- 19.Rhinn H. Marchand–Leroux C. Croci N. Plotkine M. Scherman D. Escriou V. Housekeeping while brain's storming: validation of normalizing factors for gene expression studies in a murine model of traumatic brain injury. BMC Mol. Biol. 2008;9:62. doi: 10.1186/1471-2199-9-62. [DOI] [PMC free article] [PubMed] [Google Scholar]
- 20.Hains B.C. Saab C.Y. Klein J.P. Craner M.J. Waxman S.G. Altered sodium channel expression in second-order spinal sensory neurons contributes to pain after peripheral nerve injury. J. Neurosci. 2004;24:4832–4839. doi: 10.1523/JNEUROSCI.0300-04.2004. [DOI] [PMC free article] [PubMed] [Google Scholar]
- 21.Waxman S.G. Kocsis J.D. Black J.A. Type III sodium channel mRNA is expressed in embryonic but not adult spinal sensory neurons, and is reexpressed following axotomy. J. Neurophysiol. 1994;72:466–470. doi: 10.1152/jn.1994.72.1.466. [DOI] [PMC free article] [PubMed] [Google Scholar]
- 22.Siqueira S.R. Alves B. Malpartida H.M. Teixeira M.J. Siqueira J.T. Abnormal expression of voltage-gated sodium channels Nav1.7, Nav1.3 and Nav1.8 in trigeminal neuralgia. Neuroscience. 2009;164:573–577. doi: 10.1016/j.neuroscience.2009.08.037. [DOI] [PubMed] [Google Scholar]
- 23.Guo F. Yu N. Cai J.Q. Quinn T. Zong Z.H. Zeng Y.J. Hao L.Y. Voltage-gated sodium channel Nav1.1, Nav1.3 and beta1 subunit were up-regulated in the hippocampus of spontaneously epileptic rat. Brain Res. Bull. 2008;75:179–187. doi: 10.1016/j.brainresbull.2007.10.005. [DOI] [PubMed] [Google Scholar]
- 24.Whitaker W.R. Faull R.L. Dragunow M. Mee E.W. Emson P.C. Clare J.J. Changes in the mRNAs encoding voltage-gated sodium channel types II and III in human epileptic hippocampus. Neuroscience. 2001;106:275–285. doi: 10.1016/s0306-4522(01)00212-3. [DOI] [PubMed] [Google Scholar]
- 25.Holland K.D. Kearney J.A. Glauser T.A. Buck G. Keddache M. Blankston J.R. Glaaser I.W. Kass R.S. Meisler M.H. Mutation of sodium channel SCN3A in a patient with cryptogenic pediatric partial epilepsy. Neurosci. Lett. 2008;433:65–70. doi: 10.1016/j.neulet.2007.12.064. [DOI] [PMC free article] [PubMed] [Google Scholar]
- 26.Estacion M. Gasser A. Dib–Hajj S.D. Waxman S.G. A sodium channel mutation linked to epilepsy increases ramp and persistent current of Nav1.3 and induces hyperexcitability in hippocampal neurons. Exp. Neurol. 2010;224:362–368. doi: 10.1016/j.expneurol.2010.04.012. [DOI] [PubMed] [Google Scholar]
- 27.Hains B.C. Klein J.P. Saab C.Y. Craner M.J. Black J.A. Waxman S.G. Upregulation of sodium channel Nav1.3 and functional involvement in neuronal hyperexcitability associated with central neuropathic pain after spinal cord injury. J. Neurosci. 2003;23:8881–8892. doi: 10.1523/JNEUROSCI.23-26-08881.2003. [DOI] [PMC free article] [PubMed] [Google Scholar]
- 28.Hains B.C. Saab C.Y. Waxman S.G. Changes in electrophysiological properties and sodium channel Nav1.3 expression in thalamic neurons after spinal cord injury. Brain. 2005;128:2359–2371. doi: 10.1093/brain/awh623. [DOI] [PubMed] [Google Scholar]
- 29.de Sousa Abreu R. Penalva L.O. Marcotte E.M. Vogel C. Global signatures of protein and mRNA expression levels. Mol. Biosyst. 2009;5:1512–1526. doi: 10.1039/b908315d. [DOI] [PMC free article] [PubMed] [Google Scholar]
- 30.Ostlund G. Sonnhammer E.L. Quality criteria for finding genes with high mRNA-protein expression correlation and coexpression correlation. Gene. 2012;497:228–236. doi: 10.1016/j.gene.2012.01.029. [DOI] [PubMed] [Google Scholar]