Abstract
The performance of rectangular radio frequency (RF) coils capable of being used to detect nuclear quadrupole resonance (NQR) signals from blister packs of medicines has been compared. The performance of a fixed-pitch RF coil was compared with that from two variable-pitch coils, one based on a design in the literature and the other optimized to obtain the most homogeneous RF field over the whole volume of the coil. It has been shown from 14N NQR measurements with two medicines, the antibiotic ampicillin (as trihydrate) and the analgesic medicine Paracetamol, that the latter design gives NQR signal intensities almost independent of the distribution of the capsules or pills within the RF coil and is therefore more suitable for quantitative analysis.
Because of the increasing threat to public health worldwide by the prevalence of counterfeit and substandard medicines,1 there has been considerable interest in developing spectroscopic methods of detecting these materials. Techniques such as near-infrared,2 terahertz,3 and Raman spectroscopy4 have all been successfully used to identify these medicines. A relative newcomer to this field has been pulsed nuclear quadrupole resonance spectroscopy (NQR), which can be used to acquire a quantitative assay of the active ingredient as a means of authenticating the medicine.5 As NQR uses RF radiation, it is noninvasive and, so, does not require the container to be opened. However, RF coils need to be used, which will contain the medicine packs of rectangular cross section, have an acceptable filling factor, and produce the homogeneous RF fields required for quantitative measurements.6 We describe in this paper such a design.
RF Coil Design
Two variable-pitch coils with a rectangular cross section (RCS solenoids) were first modeled using the Vector Fields OPERA RF field modeling package and then built, the key objective being to create a homogeneous field within the coil making the return in signal from a sample independent of the position of the sample in the coil, a key advance on the performance of fixed pitch coils when working with pills or capsules mounted in blister packs with differing geometries. This work builds on earlier work with a cylindrical solenoid6 of variable pitch based on a design by Leifer,7 which was modified to allow for the rectangular geometry. The RF coils were wound around plastic formers of dimensions 120 × 40 × 85 mm. The second variable pitch coil of these dimensions is illustrated in Figure 1, which also shows an example of one of the blister packs containing the analgesic Paracetamol used in these trials.
Figure 1.
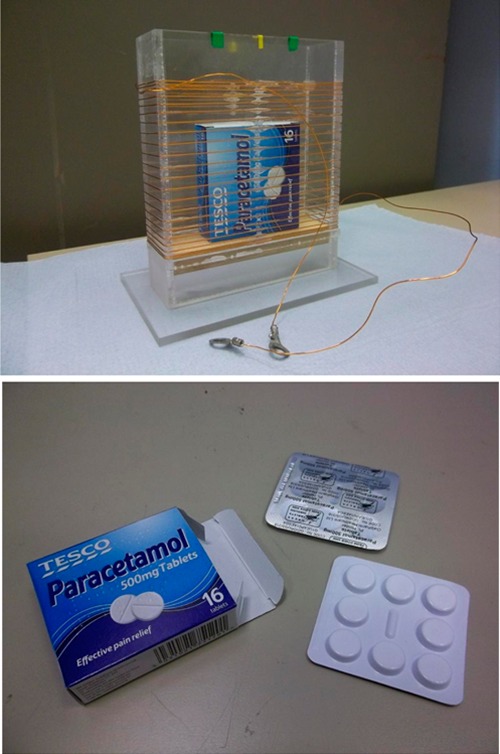
Variable-pitch rectangular cross-section (RCS) solenoid containing the analgesic Paracetamol and illustration of the contents of the packet: two blister packs of Paracetamol pills, each holding 8 × 500 mg Paracetamol pills; cross-section of coil, 120 × 40 mm; height, 85 mm; turns, 23; inductance (L), 21 μH; Q at 3.03 MHz, 76.
One fixed pitch and two variable-pitch winding schemes were used; the first variable pitch coil was a 21-turn solenoid of length 85 mm based on the Leifer equations for a cylindrical solenoid,7 and the second was an optimized version arrived at by empirically modifying these equations to allow for the new rectangular geometry. A total of 10 different simulations allowed us to achieve a better homogeneity. Figure 2 gives the positions of the coil turns for the resulting optimized coil of 23 turns and length 96 mm, together with a polynomial approximation to their form in which the origin is placed at the center of the coil. It should be noted that the inductance was estimated by assuming that the rectangular cross-section coil was given the same inductance as a circular cross-section coil of the same cross-sectional area (i.e., l × w ≅ πr2); in practice, the two are not very different, although the method by Kostic8 would be more reliable.
Figure 2.
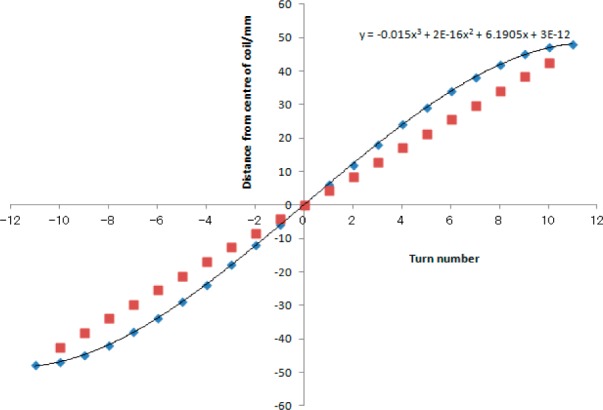
Polynomial approximation to a 23-turn, optimized, variable-pitch solenoid (diamonds) and equivalent linear plot for a fixed-pitch, 21-turn solenoid (squares) showing turn position relative to center of coil.
Results
The performance of all three coils was tested using a combination of B1 RF field measurements carried out by a pick-up loop, and 14N NQR measurements at room temperature (297 K) using the 3.033 MHz 14N NQR line of Ampicillin (as trihydrate) and 2.564 MHz 14N NQR line of Paracetamol. For the latter set of measurements, the pills in blister packs were used such that the pills were dispersed across the full volume of the coils rather than concentrated at any one position within them. Figure 3 shows an example of the results of the B1 field measurements.
Figure 3.
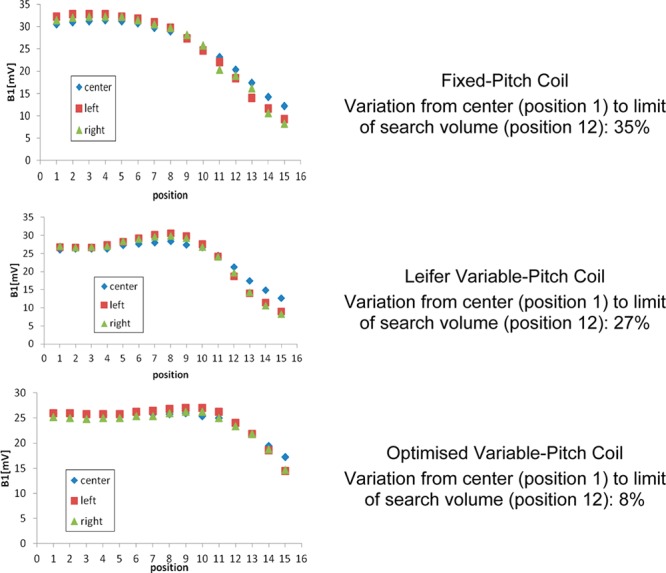
B1 field measurements along the z axis of the coil.
The peak B1 as measured is higher for the fixed-pitch coil than for either the Leifer or optimized variable-pitch coils. This can be directly related to the Q of the coils, which drop from 87 to 84 and 76, respectively.
A comparison was made between the fixed-pitch coil and the best of the two variable pitch coils (the “optimised variable-pitch coil”), as determined by the B1 field measurements. Initial measurements were made using the two coils of configurations in which loose Ampicillin capsules were all concentrated either in the center of the inspection volume or at the top and bottom edge of the inspection volume, as shown in Figure 4. The 3.033 MHz 14N line of Ampicillin (as trihydrate) was chosen for these measurements. The line has a width at half-height Δν1/2 of 1.93 kHz and a temperature coefficient of −80 Hz K–1. Measurements were performed at 297 K. A multiple-pulse pulse sequence of the so-called “Pulsed Spin Locking” (PSL) type was used to acquire the data.9 This is a sequence of the form: P90x (τ – P90y – τ)n, where P90 is a pulse of flip angle equivalent to 90° of phase either x or y, τ is a delay, and n is the number of times that the pulses in the train are repeated. The measurements used an on-resonance PSL sequence with a pulse width of 60 μs and a pulse separation 2τ of 422 μs; 32 echoes in each PSL scan were summed, 1000 scans were averaged, and each run was repeated 12 times. The results of the 12 measurements were averaged to produce the data shown in Table 1.
Figure 4.
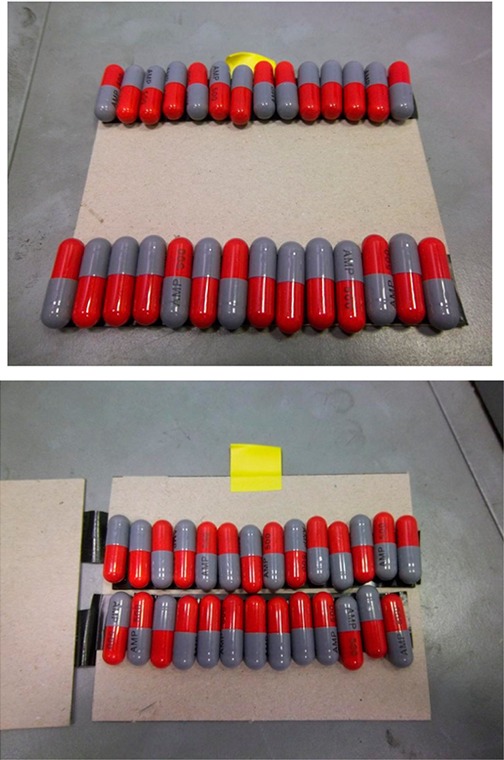
Two configurations of Ampicillin trihydrate capsules used to test the coils.
Table 1. Comparison of the Returned Signal with the Two Configurations of Capsules with the Fixed Pitch and Optimized Variable-Pitch Coils: PSL Sequence, 12 Repeats of the Same Measurement Averaged.
| fixed pitch | optimized variable-pitch | |
|---|---|---|
| Q (loaded) | 87 | 76 |
| Peak Height (×10–8) of Returned Signal | ||
| rows of capsules in center | 6.04 | 4.42 |
| rows of capsules at ends | 5.15 | 4.81 |
| average | 5.60 | 4.62 |
| variation about mean | ±8% | ±4% |
The two coils show a variation in returned signal that is consistent with the difference in homogeneity of field, although dulled by the difference in Q between the two coils.
A second test of performance was made with a medicine pack containing pills of the analgesic Paracetamol in blister packs, as illustrated in Figure 1, at an NQR frequency of 2.564 MHz and a temperature of 297 K, using the fixed-pitch and optimized variable-pitch coils; the amido 14N–H signal is a good fit to a Lorentzian function with a width at half-height Δν1/2 of 2.74 kHz and a temperature coefficient of +70 Hz K–1. The measurements used an on-resonance PSL sequence with a pulse width of 60 μs and a pulse separation 2τ of 1.15 ms; 1024 echoes in each PSL scan were summed, 40 scans were averaged, and the results were repeated five times to give the average signal intensity.
In a set of measurements designed to offset effects due to the difference in Q between the two coils, the mean signals from the blister packs were compared with those from an identical number of loose, closely packed pills placed at the center of the two RF coils (results Figure 5) with a differing number of pills. All mean values show a linear dependence on the number of pills, a least-squares fit passing close to the origin, but the optimized variable-pitch coil clearly shows a much smaller dependence on the distribution of the pills within the RF coil compared to the fixed-pitch coil.
Figure 5.
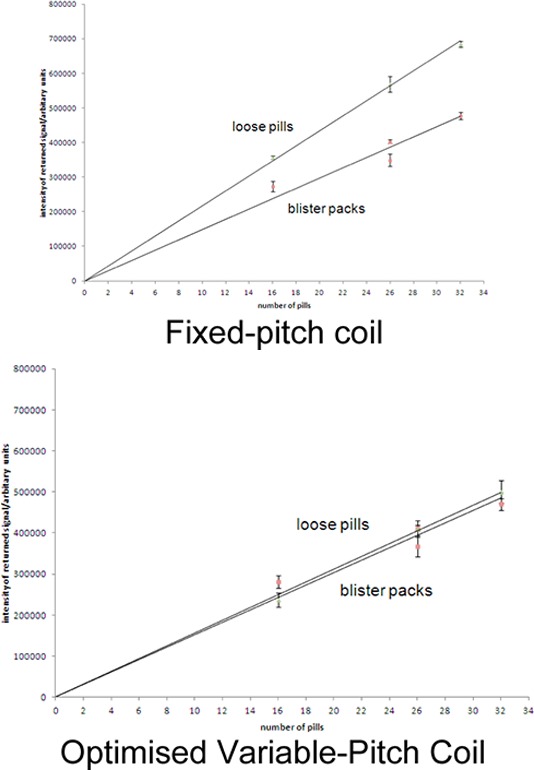
Mean echo intensity versus number of pills for loose pills placed in the center of the coil vs an equal number of pills dispersed across the whole coil volume in blister packs, using a fixed-pitch coil (left) and the optimized variable-pitch coil (right).
Conclusion
A comparison of the results from the three rectangular cross section coils, the fixed pitch, the Leifer variable-pitch, and the optimized variable-pitch showed that significant improvements could be made to the B1 homogeneity and sensitivity by variations in the pitch of the coil, gains that were partly masked by a drop in the loaded Q-factors from 87 to 84 and 76, respectively. 14N NQR signals from the optimized variable-pitch coil for Ampicillin capsules and Paracetomol pills showed only a small dependence on their distribution within the coil.
Acknowledgments
This work was partly funded by a technology transfer award from the Wellcome Trust (U.K.). Additional funding was provided by the European Commission as part of 7th Framework Programme under Grant No. 261670.
The authors declare no competing financial interest.
References
- Wertheimer A. I.; Norris J. Res. Social Admin. Pharm. 2009, 5, 4–16. [DOI] [PubMed] [Google Scholar]
- Lopes M. B.; Wolff J.-C.; Bioucas-Dias J. M.; Figueiredo M. A. T. Anal. Chim. Acta 2009, 641, 46–51. [DOI] [PubMed] [Google Scholar]
- Wu H.; Heilweil E. J.; Hussain A. S.; Khan M. A. Int. J. Pharm. 2007, 343, 148–158. [DOI] [PubMed] [Google Scholar]
- Ricci C.; Nyadong L.; Yang F.; Fernandez F. M.; Brown C. D.; Newton P. N.; Kazarian S. G. Anal. Chim. Acta 2008, 623, 178–186. [DOI] [PubMed] [Google Scholar]
- Balchin E.; Malcolme-Lawes D. J.; Poplett I. J. F.; Rowe M. D.; Smith J. A. S.; Pearce G. E. S.; Wren S. A. C. Anal. Chem. 2005, 77, 3925–3930. [DOI] [PubMed] [Google Scholar]
- Tate E.; Althoefer K. A.; Barras J.; Rowe M. D.; Smith J. A. S.; Pearce G. E. S.; Wren S. A. C. Anal. Chem. 2009, 81, 5574–5576. [DOI] [PubMed] [Google Scholar]
- Leifer M. C. J. Magn. Reson. 1993, A105, 1–6. [Google Scholar]
- Kostic M. Electrotech. Rev. 2010, 77, 293–298. [Google Scholar]
- Marino. R. A.; Klainer S. M. J. Chem. Phys. 1977, 67, 3388–3389. [Google Scholar]


