


Abstract
Coexpressed gene databases are valuable resources for identifying new gene functions or functional modules in metabolic pathways and signaling pathways. Although coexpressed gene databases are a fundamental platform in the field of plant biology, their use in animal studies is relatively limited. The COXPRESdb (http://coxpresdb.jp) provides coexpression relationships for multiple animal species, as comparisons of coexpressed gene lists can enhance the reliability of gene coexpression determinations. Here, we report the updates of the database, mainly focusing on the following two points. First, we updated our coexpression data by including recent microarray data for the previous seven species (human, mouse, rat, chicken, fly, zebrafish and nematode) and adding four new species (monkey, dog, budding yeast and fission yeast), along with a new human microarray platform. A reliability scoring function was also implemented, based on coexpression conservation to filter out coexpression with low reliability. Second, the network drawing function was updated, to implement automatic cluster analyses with enrichment analyses in Gene Ontology and in cis elements, along with interactive network analyses with Cytoscape Web. With these updates, COXPRESdb will become a more powerful tool for analyses of functional and regulatory networks of genes in a variety of animal species.
INTRODUCTION
The construction of a gene network is a fundamental step toward understanding global cellular processes. In addition, recent genome-wide association studies, using high-throughput sequencing technology, have revealed many uncharacterized genotypes associated with a particular phenotype (1,2). To investigate the molecular mechanisms underlying the connections between genotype and phenotype, networks of mRNAs or proteins are useful. Several databases, such as IntAct (3) and STRING (4), have focused on protein-protein interaction network construction. For mRNA network analysis, similarities of gene expression profiles (gene coexpression) of a vast amount of microarray data are constructed. Databases for gene coexpression have achieved great success in the field of plant biology (5–8). On the other hand, however, their use in mammalian fields is still limited, with some exceptional reports (9,10), although several coexpression databases, such as Genevestigator (11), STARNET2 (12), SNPxGE2 (2) and ours, COXPRESdb, have been developed.
To promote the use of coexpression analyses in animals, we have been developing a gene coexpression database named COXPRESdb (coexpression database). We have especially focused on the reliability of coexpression data, by providing comparisons of coexpression among the different species, along with a network view of the relationships between coexpressed genes (13,14). Although the gene network view can provide an overview for the system of interest, the construction of a large-scale gene network is not easy because such a network tends to be too complicated to fully comprehend. Several approaches have been developed to visualize and help the understanding of large-scale gene networks, by controlling the cluster size (15) or combining biological-property–based clustering (16). Another weak point in coexpressed gene network analysis is based on the quality of the coexpression data. The quality of the coexpression data for animals is generally worse than that for Arabidopsis in an assessment using Gene Ontology (GO) annotation (17), probably due to the increased complexity of animal systems (18).
To enhance the performance of gene coexpression analyses, we updated two aspects of COXPRESdb. First, we increased the number of samples for each species and the number of species from 7 to 11 along with an alternative microarray platform for human as summarized in Table 1. In addition, a reliability scoring system was implemented, based on the similarity of coexpression patterns among the species. Second, the network drawing tool was improved. The new tool automatically divides the large complex network into smaller compact clusters. Each compact cluster is then characterized by GO and cis element enrichment analyses. In addition, users can select the Cytoscape web system (19) to interactively modify the network alignment and to work as a bridge to stand-alone Cytoscape (20) for more complex analyses. Furthermore, all of the coexpression data are now available in SPARQL for the semantic web communities, using the Virtuoso Universal Server at [http://coxpresdb.jp/sparql], which will promote building mashup application with various omics data sets.
Table 1.
Summary of the update of the coexpression data from versions 4.1 to 5.0
| Species | Abbreviation | Microarray platform (Affymetrix product ID) | Number of genes | Number of microarrays |
|
|---|---|---|---|---|---|
| ver. 5.0 | ver. 4.1 | ||||
| Homo sapiens | Hsa | HG-U133_Plus_2 | 19 803 | 73 083 (c4.0) | 4401 (c3.1) |
| Homo sapiens | Hsa2 | HuGene-1_0-st-v1 | 19 788 | 6865 (c1.0) | |
| Mus musculus | Mmu | Mouse430_2 | 20 403 | 31 479 (c3.0) | 2226 (c2.1) |
| Rattus norvegicus | Rno | Rat230_2 | 13 751 | 27 481 (c3.0) | 3526 (c2.0) |
| Gallus gallus | Gga | Chicken | 13 757 | 1024 (c2.0) | 352 (c1.0) |
| Danio rerio | Dre | Zebrafish | 10 112 | 1126 (c2.0) | 590 (c1.0) |
| Drosophila melanogaster | Dme | Drosophila_2 | 12 626 | 3336 (c2.0) | 1102 (c1.0) |
| Caenorhabditis elegans | Cel | Celegans | 17 256 | 1034 (c2.0) | 514 (c1.0) |
| Macaca mulatta | Mcc | Rhesus | 15 779 | 675 (c1.0) | |
| Canis lupus | Cfa | Canine_2 | 16 211 | 377 (c1.0) | |
| Saccharomyces cerevisiae | Sce | Yeast_2 | 4461 | 2693 (c1.0) | |
| Schizosaccharomyces pombe | Spo | Yeast_2 | 4881 | 111 (c1.0) | |
“c” is added for each coexpression version (e.g. c4.0) to prevent confusions with the COXPRESdb version as a whole (e.g. ver. 5.0).
QUALITY ASSESSMENT OF COEXPRESSION DATA
New coexpression data
The calculation procedure for the coexpression data is the same as in our previous report (18). Briefly, GeneChip raw data were obtained from ArrayExpress (21) and normalized by the RMA method (22) for each compressed file, by assuming that each compressed file corresponds to each experimental set. Then the weighted Pearson's correlation coefficient of expression profiles was calculated for every pair of genes in each species. Finally, the correlation coefficient was transferred to mutual rank (MR) (18). A network node corresponds to a gene, and edges are drawn for each gene to the other genes with three most strongly coexpressed genes. The evolutional relationships were determined by using HomoloGene (23) and the edges in the homologous gene pairs, if any, were considered as common edges among the species.
To assess the difference between the previous and new versions, we counted the numbers of common edges (Nc) for all pairs of seven species for each version. These numbers provide a quick measure to evaluate the quality of the coexpression data because similar coexpression from independent microarray platforms may eliminate experimental artifact of gene coexpression. As a result, all pairs of species, except for the human–nematode pair, showed an increase in Nc (Figure 1). The average increase rate of Nc was 1.5, and large increases of Nc were observed for the human–mouse, mouse–rat and mouse–chicken pairs, which may correspond to the large increase in the number of mouse samples. In addition to the data renewal of the previous seven species, we added four new species, monkey, dog and two yeast species, as well as human coexpression from another microarray platform. The numbers of Nc against the human data are summarized in Table 2.
Figure 1.

Distribution of the number of common coexpression edges (Nc) between species. Large increases in common coexpression edges are observed in the (a) human–mouse, (b) mouse–rat and (c) mouse–chicken pairs, suggesting significant improvement of the mouse coexpression data. The increase rate of the number of common edges is 1.5 on average.
Table 2.
Evolution of number of edges in a human platform commonly observed in other species
| Species | ver. 5.0 | ver. 4.1 |
|---|---|---|
| Mus musculus | 1397 | 757 |
| Canis lupus | 896 | |
| Rattus norvegicus | 803 | 720 |
| Macaca mulatta | 545 | |
| Gallus gallus | 358 | 211 |
| Danio rerio | 172 | 156 |
| Drosophila melanogaster | 84 | 49 |
| Caenorhabditis elegans | 38 | 39 |
| Saccharomyces cerevisiae | 35 | |
| Schizosaccharomyces pombe | 13 |
The total number of edges in human are 59 409 (ver. 5.0) and 59 331 (ver. 4.1).
SIMILARITY OF COEXPRESSION PATTERNS AMONG SPECIES
The coexpressed gene list in COXPRESdb provides a comparable view among orthologous genes in other species (14). This comparative view shows the evolutional conservation of the coexpression pattern of the guide gene, which can be a measure of the reliability of the coexpression data (24,25). Figure 2 shows the coexpressed gene list for the human CHEK1 gene. The alternative human platform (Hsa2) and mouse (Mmu) show similar coexpression degrees with the human (Hsa) coexpression, reflecting the high quality of the coexpression data for these species, based on the large amount of microarray data. The conservation degrees with monkey (Mcc), rat (Rno), dog (Cfa) and zebrafish (Dre) are also good. The low coexpression conservation with fly (Dme), nematode (Cel) and the two yeast species (Sce, Spo) seems to be derived from the greater species distance to human and/or the relatively poor coexpression data based on the small amount of microarray data (Table 1). In particular, the chicken (Gga) coexpression data are different from the human data. This may be due to a defective probe for this gene because when we checked the coexpressed gene list for this gene in chicken, almost no orthologous genes showed coexpression conservation.
Figure 2.

An example of a coexpressed gene list in COXPRESdb. The human CHEK1 gene is used as an example of a guide gene, and the coexpressed genes are shown along with their MR values (smaller MR value indicates stronger coexpression). The 11 columns on the right indicate the coexpression degrees of the ortholog pairs in other species (or another human platform). Coexpressions with MR >200 are considered as weak and they are shown in faded color. A blank cell means that coexpression data are not available for the gene in the corresponding species (or a platform). The reliability is calculated based on the coexpression conservation, and is represented with stars (triple star: highly reliable; no star: no conservation support). This list is available at [http://coxpresdb.jp/cgi-bin/coex_list.cgi?gene=1111&sp=Hsa].
As seen in this example, the conservation of coexpression can ensure the quality of the guide gene (14), but users should check all of the coexpressed genes in each species to determine the reliability of each orthologous gene. To solve this problem, we introduced a similarity measure COXSIM, which is the weighted concordance rate of the coexpressed gene lists.
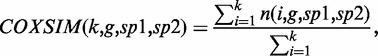 |
where n(i, g, sp1, sp2) is the number of common genes (orthologous genes in the case of different species comparison) found in the top i coexpressed gene lists from a guide gene g in species sp1 and that in species sp2. We set 100 for k, meaning that we check the gene correspondence of the top 100 coexpressed genes, which is a reasonable limitation to design biological experiment (7).
Here, defective probes will show noisy expression patterns, which cause unreliable coexpression that does not show any correspondence with other coexpression data. In other words, the maximal value of COXSIM (coexpression similarity) between the coexpressed gene list from an unreliable gene and that from its orthologous genes should be low. Based on this idea, maxCOXSIM is introduced as the reliability score of a guide gene.
The significance of the maxCOXSIM value is assessed from the null distribution for 10 species comparisons, each containing 10 000 genes. Note that this assumption is a rather severe evaluation and thus this P-value is underestimated for most guide genes because both the larger number of species in the comparison and the smaller number of genes in a genome will cause higher maxCOXSIM values by chance. We show this significance degree by stars on the gene list in COXPRESdb, where single, double and triple stars correspond P-values <1E-4, 1E-12 and 1E-20, respectively. Genes with lower reliability can be filtered out by the Row and Column filters (Figure 2). The numbers and ratios of genes at each significance level are shown in Figure 3.
Figure 3.

Number of genes for each reliability level. Reliability levels are represented as stars, where no star is the lowest and a triple star is the highest reliability. Numbers in the bars indicate the percentage of each reliability level in each species, where the numbers with no star include genes without any orthlogous genes in other species.
ENHANCEMENT OF THE NETWORK ANALYSIS TOOL
The coexpressed gene network is especially useful to analyze the large number of genes generated by transcriptome or proteome analyses because the network representation can draw all of the pair-wise gene relationships for the query genes at one time. NetworkDrawer in COXPRESdb is the tool to draw the gene network for the query genes specified by users, by searching for coexpression along with protein–protein interactions among the genes or gene products (Figure 4). In this example, three groups of genes can be identified by visual inspection. To characterize these groups, two new network analysis flows are provided in the new NetworkDrawer, in addition to the marks for KEGG annotation (27) in the previous version of COXPRESdb.
Figure 4.

Two network analysis flows in NetworkDrawer. For a set of user-defined genes, NetworkDrawer draws the gene network. Larger nodes are the query genes and smaller gray nodes are additional nodes with one or more edges to at least one query node. Solid lines and red dotted lines indicate gene coexpression and protein–protein interactions from the HPRD (26) and IntAct (3) databases, respectively. The orange solid lines mean conserved coexpression observed in at least one species in COXPRESdb. The new NetworkDrawer can be used for the two network analysis flows. The first flow is composed of automatic cluster detection (A) and enrichment analyses of cis elements and GO annotations (B) with detailed cis element information (C). The second flow is using the Cytoscape Web system (D), which enables the user to interactively modify the network alignment. The user can output this network as an image, save it and then load it on this web system, or continue the analysis and visualization on stand-alone Cytoscape.
The first analysis flow is composed of automatic cluster detection and characterization (Figure 4A–C). The cluster detection step has two parameters, a clique detection parameter and a clique merge parameter, which are both set to 0.5 as the default values, but can be changed through the text box on the web page, where smaller clique parameter and larger merge parameter produce larger sub-graph. The clustering algorithm has been newly developed for both a rapid response and the detection of a clique-like sub-graph, by merging the node with a higher PageRank value iteratively (28). The details of the clustering algorithm will be described elsewhere. After the clustering, users can easily select a cluster by using the radio button in the cluster summary table, to mark the nodes in the selected cluster by balloon icons (the orange balloons in Figure 4A). The results of the enrichment analyses for each cluster are available from the links in the table (Figure 4B). In addition to the GO enrichment analysis, we have also provided the cis element motif enrichment analysis. Gene coexpression is mainly driven by cis elements in the promoter regions, especially the proximal promoter region (29). In Arabidopsis, large-scale cis element discovery was performed, based on gene coexpression (30). Therefore, we performed enrichment analyses by a hypergeometric test for heptamer motifs on the proximal promoter regions (−200 to +100) around transcription start sites downloaded from DBTSS (31). The enriched heptamers are referred to the reported cis elements in JASPAR (32) (Figure 4C). To further characterize the heptamers, the enriched GO annotations of the genes having the heptamer motif are calculated (Figure 4C).
The second flow of the gene network analysis is the use of the Cytoscape Web system (19) (Figure 4D). This system enables users to interactively modify the network alignment, export the network as an image (SVG, PNG, PDF formats) and save it in the XGMML format. The XGMML file can be uploaded on the same Cytoscape Web system and also used in stand-alone Cytoscape (20) for advanced analyses. This system is also available for gene networks in the locus page and the GO network page in COXPRESdb.
FUNDING
CREST research project of the Japan Science and Technology Corporation [11102558 to T.O.]; Grants-in-Aid for Innovative Area ‘HD Physiology’ [22136005], for Scientific Research [24570176] and for Publication of Scientific Research Results [228063 to K.K.]. Funding for open access charge: Grants-in-Aid for Innovative Area ‘HD Physiology’ [22136005].
Conflict of interest statement. None declared.
ACKNOWLEDGEMENTS
The super-computing resource was provided by the Human Genome Center, Institute of Medical Science, The University of Tokyo.
REFERENCES
- 1.Roberts R, Wells GA, Stewart AF, Dandona S, Chen L. The genome-wide association study–a new era for common polygenic disorders. J. Cardiovasc. Transl. Res. 2010;3:173–182. doi: 10.1007/s12265-010-9178-6. [DOI] [PubMed] [Google Scholar]
- 2.Wang Y, Joseph SJ, Liu X, Kelley M, Rekaya R. SNPxGE(2): a database for human SNP-coexpression associations. Bioinformatics. 2012;28:403–410. doi: 10.1093/bioinformatics/btr663. [DOI] [PubMed] [Google Scholar]
- 3.Kerrien S, Aranda B, Breuza L, Bridge A, Broackes-Carter F, Chen C, Duesbury M, Dumousseau M, Feuermann M, Hinz U, et al. The IntAct molecular interaction database in 2012. Nucleic Acids Res. 2012;40:D841–D846. doi: 10.1093/nar/gkr1088. [DOI] [PMC free article] [PubMed] [Google Scholar]
- 4.Szklarczyk D, Franceschini A, Kuhn M, Simonovic M, Roth A, Minguez P, Doerks T, Stark M, Muller J, Bork P, et al. The STRING database in 2011: functional interaction networks of proteins, globally integrated and scored. Nucleic Acids Res. 2011;39:D561–D568. doi: 10.1093/nar/gkq973. [DOI] [PMC free article] [PubMed] [Google Scholar]
- 5.Aoki K, Ogata Y, Shibata D. Approaches for extracting practical information from gene co-expression networks in plant biology. Plant Cell Physiol. 2007;48:381–390. doi: 10.1093/pcp/pcm013. [DOI] [PubMed] [Google Scholar]
- 6.Usadel B, Obayashi T, Mutwil M, Giorgi FM, Bassel GW, Tanimoto M, Chow A, Steinhauser D, Persson S, Provart NJ. Co-expression tools for plant biology: opportunities for hypothesis generation and caveats. Plant Cell Environ. 2009;32:1633–1651. doi: 10.1111/j.1365-3040.2009.02040.x. [DOI] [PubMed] [Google Scholar]
- 7.Obayashi T, Kinoshita K. Coexpression landscape in ATTED-II: usage of gene list and gene network for various types of pathways. J. Plant Res. 2010;123:311–319. doi: 10.1007/s10265-010-0333-6. [DOI] [PubMed] [Google Scholar]
- 8.Obayashi T, Nishida K, Kasahara K, Kinoshita K. ATTED-II updates: condition-specific gene coexpression to extend coexpression analyses and applications to a broad range of flowering plants. Plant Cell Physiol. 2011;52:213–219. doi: 10.1093/pcp/pcq203. [DOI] [PMC free article] [PubMed] [Google Scholar]
- 9.Balagurunathan Y, Morse DL, Hostetter G, Shanmugam V, Stafford P, Shack S, Pearson J, Trissal M, Demeure MJ, Von Hoff DD, et al. Gene expression profiling-based identification of cell-surface targets for developing multimeric ligands in pancreatic cancer. Mol. Cancer Ther. 2008;7:3071–3080. doi: 10.1158/1535-7163.MCT-08-0402. [DOI] [PMC free article] [PubMed] [Google Scholar]
- 10.Fujiwara T, Hiramatsu M, Isagawa T, Ninomiya H, Inamura K, Ishikawa S, Ushijima M, Matsuura M, Jones MH, Shimane M, et al. ASCL1-coexpression profiling but not single gene expression profiling defines lung adenocarcinomas of neuroendocrine nature with poor prognosis. Lung Cancer. 2012;75:119–125. doi: 10.1016/j.lungcan.2011.05.028. [DOI] [PubMed] [Google Scholar]
- 11.Hruz T, Laule O, Szabo G, Wessendorp F, Bleuler S, Oertle L, Widmayer P, Gruissem W, Zimmermann P. Genevestigator v3: a reference expression database for the meta-analysis of transcriptomes. Adv. Bioinformatics. 2008;2008:420747. doi: 10.1155/2008/420747. [DOI] [PMC free article] [PubMed] [Google Scholar]
- 12.Jupiter D, Chen H, VanBuren V. STARNET 2: a web-based tool for accelerating discovery of gene regulatory networks using microarray co-expression data. BMC Bioinformatics. 2009;10:332. doi: 10.1186/1471-2105-10-332. [DOI] [PMC free article] [PubMed] [Google Scholar]
- 13.Obayashi T, Hayashi S, Shibaoka M, Saeki M, Ohta H, Kinoshita K. COXPRESdb: a database of coexpressed gene networks in mammals. Nucleic Acids Res. 2008;36:D77–D82. doi: 10.1093/nar/gkm840. [DOI] [PMC free article] [PubMed] [Google Scholar]
- 14.Obayashi T, Kinoshita K. COXPRESdb: a database to compare gene coexpression in seven model animals. Nucleic Acids Res. 2011;39:D1016–D1022. doi: 10.1093/nar/gkq1147. [DOI] [PMC free article] [PubMed] [Google Scholar]
- 15.Mutwil M, Usadel B, Schütte M, Loraine A, Ebenhöh O, Persson S. Assembly of an interactive correlation network for the Arabidopsis genome using a novel heuristic clustering algorithm. Plant Physiol. 2010;152:29–43. doi: 10.1104/pp.109.145318. [DOI] [PMC free article] [PubMed] [Google Scholar]
- 16.Praneenararat T, Takagi T, Iwasaki W. Interactive, multiscale navigation of large and complicated biological networks. Bioinformatics. 2011;15:1121–1127. doi: 10.1093/bioinformatics/btr083. [DOI] [PMC free article] [PubMed] [Google Scholar]
- 17.Gene Ontology Consortium. The Gene Ontology: enhancements for 2011. Nucleic Acids Res. 2012;40:D559–D564. doi: 10.1093/nar/gkr1028. [DOI] [PMC free article] [PubMed] [Google Scholar]
- 18.Obayashi T, Kinoshita K. Rank of correlation coefficient as a comparable measure for biological significance of gene coexpression. DNA Res. 2009;16:249–260. doi: 10.1093/dnares/dsp016. [DOI] [PMC free article] [PubMed] [Google Scholar]
- 19.Lopes CT, Franz M, Kazi F, Donaldson SL, Morris Q, Bader GD. Cytoscape Web: an interactive web-based network browser. Bioinformatics. 2010;26:2347–2348. doi: 10.1093/bioinformatics/btq430. [DOI] [PMC free article] [PubMed] [Google Scholar]
- 20.Smoot ME, Ono K, Ruscheinski J, Wang PL, Ideker T. Cytoscape 2.8: new features for data integration and network visualization. Bioinformatics. 2011;27:431–432. doi: 10.1093/bioinformatics/btq675. [DOI] [PMC free article] [PubMed] [Google Scholar]
- 21.Parkinson H, Sarkans U, Kolesnikov N, Abeygunawardena N, Burdett T, Dylag M, Emam I, Farne A, Hastings E, Holloway E. ArrayExpress update–an archive of microarray and high-throughput sequencing-based functional genomics experiments. Nucleic Acids Res. 2011;39:D1002–D1004. doi: 10.1093/nar/gkq1040. [DOI] [PMC free article] [PubMed] [Google Scholar]
- 22.Irizarry RA, Hobbs B, Collin F, Beazer-Barclay YD, Antonellis KJ, Scherf U, Speed TP. Exploration, normalization, and summaries of high density oligonucleotide array probe level data. Biostatistics. 2003;4:249–264. doi: 10.1093/biostatistics/4.2.249. [DOI] [PubMed] [Google Scholar]
- 23.Sayers EW, Barrett T, Benson DA, Bolton E, Bryant SH, Canese K, Chetvernin V, Church DM, Dicuccio M, Federhen S, et al. Database resources of the National Center for Biotechnology Information. Nucleic Acids Res. 2012;40:D13–D25. doi: 10.1093/nar/gkr1184. [DOI] [PMC free article] [PubMed] [Google Scholar]
- 24.Stuart JM, Segal E, Koller D, Kim SK. A gene-coexpression network for global discovery of conserved genetic modules. Science. 2003;302:249–255. doi: 10.1126/science.1087447. [DOI] [PubMed] [Google Scholar]
- 25.Oti M, van Reeuwijk J, Huynen MA, Brunner HG. Conserved co-expression for candidate disease gene prioritization. BMC Bioinformatics. 2008;9:208. doi: 10.1186/1471-2105-9-208. [DOI] [PMC free article] [PubMed] [Google Scholar]
- 26.Keshava Prasad TS, Goel R, Kandasamy K, Keerthikumar S, Kumar S, Mathivanan S, Telikicherla D, Raju R, Shafreen B, Venugopal A, et al. Human protein reference database–2009 update. Nucleic Acids Res. 2009;37:D767–D772. doi: 10.1093/nar/gkn892. [DOI] [PMC free article] [PubMed] [Google Scholar]
- 27.Kanehisa M, Goto S, Sato Y, Furumichi M, Tanabe M. KEGG for integration and interpretation of large-scale molecular data sets. Nucleic Acids Res. 2012;40:D109–D114. doi: 10.1093/nar/gkr988. [DOI] [PMC free article] [PubMed] [Google Scholar]
- 28.Page L, Brin S, Motwani R, Winograd T. Stanford InfoLab. 1999. The pagerank citation ranking: bringing order to the web. Technical report. [Google Scholar]
- 29.Caselle M, Di Cunto F, Provero P. Correlating overrepresented upstream motifs to gene expression: a computational approach to regulatory element discovery in eukaryotes. BMC Bioinformatics. 2002;3:7. doi: 10.1186/1471-2105-3-7. [DOI] [PMC free article] [PubMed] [Google Scholar]
- 30.Zheng X, Liu T, Yang Z, Wang J. Large cliques in Arabidopsis gene coexpression network and motif discovery. J. Plant Physiol. 2011;168:611–618. doi: 10.1016/j.jplph.2010.09.010. [DOI] [PubMed] [Google Scholar]
- 31.Yamashita R, Sugano S, Suzuki Y, Nakai K. DBTSS: database of transcriptional start sites progress report in 2012. Nucleic Acids Res. 2012;40:D150–D154. doi: 10.1093/nar/gkr1005. [DOI] [PMC free article] [PubMed] [Google Scholar]
- 32.Portales-Casamar E, Thongjuea S, Kwon AT, Arenillas D, Zhao X, Valen E, Yusuf D, Lenhard B, Wasserman WW, Sandelin A. JASPAR 2010: the greatly expanded open-access database of transcription factor binding profiles. Nucleic Acids Res. 2010;38:D105–D110. doi: 10.1093/nar/gkp950. [DOI] [PMC free article] [PubMed] [Google Scholar]