


Abstract
The UCSC Cancer Genomics Browser (https://genome-cancer.ucsc.edu/) is a set of web-based tools to display, investigate and analyse cancer genomics data and its associated clinical information. The browser provides whole-genome to base-pair level views of several different types of genomics data, including some next-generation sequencing platforms. The ability to view multiple datasets together allows users to make comparisons across different data and cancer types. Biological pathways, collections of genes, genomic or clinical information can be used to sort, aggregate and zoom into a group of samples. We currently display an expanding set of data from various sources, including 201 datasets from 22 TCGA (The Cancer Genome Atlas) cancers as well as data from Cancer Cell Line Encyclopedia and Stand Up To Cancer. New features include a completely redesigned user interface with an interactive tutorial and updated documentation. We have also added data downloads, additional clinical heatmap features, and an updated Tumor Image Browser based on Google Maps. New security features allow authenticated users access to private datasets hosted by several different consortia through the public website.
INTRODUCTION
Cancer has many different molecular mechanisms to disrupt cellular pathways, which result in uncontrolled cell proliferation (1–3). Fortunately, development of high-throughput genomic technologies in recent years has greatly increased the amount of data available to researchers to investigate these mechanisms. Not only have the number of patients which have genomic data increased, but also the amount and type of data available per patient has grown. In addition, valuable clinical information from patients and their tumors are often available to researchers alongside of these genomic information.
Despite this wealth of data, analysis of the cancer genome can be challenging due to the limitations in current technologies to visualise, integrate, compare and analyse cancer genomics data. These data, and the conclusions they support, must be presented in a coherent system for display and analysis as well as be accessible to the scientific and medical communities. The UCSC Cancer Genomics Browser (https://genome-cancer.ucsc.edu) was developed to display these expanding data sources in an integrative, interactive and versatile way as well as help facilitate comprehensive analysis of cancer genomics and its associated clinical data (4).
The browser is a web-based tool to integrate, visualise and analyse genomic and clinical information. Experimental measurements for multiple samples are displayed alongside their associated clinical information. Multiple datasets can be viewed simultaneously allowing comparison across studies and between different data types, such as gene expression and copy number variation. The browser provides interactive and dynamic views of the data from whole-genome to base-pair scale resolution, as well as zooming to a subset of samples. Users can interactively group samples by common clinical features such as response to chemotherapy, or by genomic signatures that predict response to a drug. Viewing genomic data by genes allows users to easily see functional changes to the genome as well as examine trends across pathways of genes. Several statistical tools are available making it possible to obtain quantitative results dynamically. Additionally, the Tumor Image Viewer, based on Google Maps, allows users to interactively view slides of tumor tissue samples.
The browser currently contains 355 datasets corresponding to genome-wide experiments on 71 870 samples, most of which are from The Cancer Genome Atlas project (TCGA, https://tcga-data.nci.nih.gov/tcga/) (5). Data on the website are updated periodically to include the latest releases from TCGA and other projects. Currently, the browser holds 201 TCGA public-tier datasets from 22 TCGA cancer projects, data from the Cancer Cell Line Encyclopedia project (CCLE, http://www.broadinstitute.org/ccle/home) (6), and 43 other published studies. The Google-maps-based microscope slide viewer has 2433 slides from TCGA.
A controlled access mechanism is also available for private data, and currently supports the Stand Up To Cancer breast cancer dream team (SU2C, http://www.standup2cancer.org/dream_teams/view/an_integrated_approach_to_targeting_breast_cancer_molecular_subtypes_and_th), I-SPY 2 TRIAL (Investigation of Serial Studies to Predict Your Therapeutic Response with Imaging And moLecular Analysis 2) (7), LINCS (Library of Integrated Network-based Cellular Signatures) (http://www.broadinstitute.org/LINCS/) (8) and other projects. The controlled access mechanism allows authorized users to view this private data alongside public data.
In the past 2 years, we have made significant changes to the browser including improving the user interface, as well as implementing user accounts, an online tutorial and better documentation. The data versioning system we developed this year, allows us to offer users the ability to download datasets. We also released a new Tumor Image Browser, based on Google Maps, that offers intuitive panning and zooming across microscope slide images.
NEW DATA
The Cancer Genome Atlas
We provide an open-access portal to view, analyse and download public data from TCGA. We have developed an automated pipeline that loads and processes data from TCGA, allowing it to be quickly downloaded from their servers and then displayed in the browser. This pipeline has greatly increased the number of datasets from TCGA we can load into the browser, which has allowed us to expand the cancers we have available to 22 cancer projects including breast, pancreas and lung cancer (Table 1).
Table 1.
Dataset summary
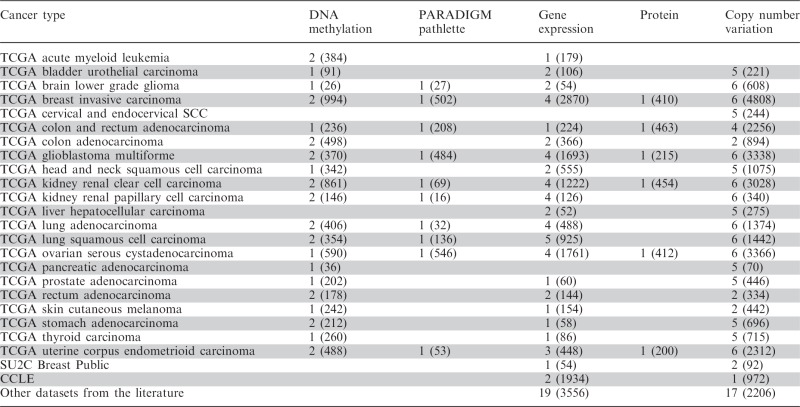 |
Number of datasets by cancer type and data type; values in parenthesis are number of samples.
New dataset types include GISTIC2 (9) estimated segmented copy number variation from the TCGA FIREHOSE pipeline. We display next-generation RNA Illumina HiSeq gene expression data, protein expression data assayed by reverse phase protein array technology, and DNA methylation profiles measured using the Illumina Infinium HumanMethylation450 platform. We also have datasets showing integrated gene activity level inferred using the PARADIGMLITE method. PARADIGM (10) is pathway analysis method to infer patient- or sample-specific genetic activities by incorporating curated pathway interactions with genomic measurements, such as gene expression and copy number data. PARADIGMLITE, a less computationally intensive version of PARADIGM, integrates different types of data on individual genes without incorporating the curated pathway interactions. The gene expression and copy number input data are shown in the accompanying evidence datasets.
The clinical data, which is displayed alongside the genomic information, have also been updated with more readable clinical feature names and values. This allows for easier access for users who may not be familiar with the abbreviations used by TCGA. Figure 1 illustrates some of these more readable clinical feature names as well as a few of the new data types from TCGA. Figure 1 is a browser screenshot of some TCGA Glioblastoma multiforme (GBM) datasets showing differential copy number variation, gene expression and methylation for the glioma-CpG island methylator phenotype (G-CIMP). Viewing the whole genome copy number profile, users can easily see that the G-CIMP tumors display distinct copy number alterations, lacking the deletion of chromosome 10 and amplification of chromosome 7 shared by the majority of the non-G-CIMP samples. The browser also shows that G-CIMP samples are highly enriched in the proneural subtype, as described in the recent publication that identifies G-CIMP samples as a distinct subset of human gliomas on molecular and clinical grounds (11). When viewing genes linked to survival outcome in GBM (12) we see that individuals with G-CIMP tumors have different gene expression and DNA methylation profiles compared with non-G-CIMP tumors, and a higher survival rate after treatment, as described in the recent publication (11).
Figure 1.

TCGA GBM datasets showing differential copy number variation, gene expression and methylation for the glioma-CpG island methylator phenotype (G-CIMP). The black box emphasizes the samples characterized as G-CIMP tumors. Copy number and DNA methylation datasets, by default, use red and blue to represent amplification and deletion, respectively. Gene expression datasets, by default, use red and green to represent over- and under-expression, respectively. For the G-CIMP clinical feature, yellow represents tumors characterized as G-CIMP and black represents tumors who are not. For the gene expression subtype clinical feature the four subtypes, from black to bright yellow, are proneural, neural, classical, and mesenchymal. (A) TCGA GBM whole genome copy number profile. (B) TCGA GBM gene expression for a select set of genes. (C) TCGA GBM DNA methylation for a select set of genes.
Cancer Cell Line Encyclopedia
Our newest public data are from the CCLE, a reference library containing primarily genetic and pharmacologic information from a large panel of human cancer cell line models (6). The CCLE datasets includes genome-wide copy number and gene expression profile of the cell lines, mutations assessed in 33 genes, and pharmacological response to 24 anti-cancer drugs. These datasets are available to the public.
Stand Up To Cancer public datasets from the Gray lab
We are also displaying published copy number profile and gene expression levels of a collection of breast cancer cell lines from Joe Gray’s lab at Oregon Health and Science University in association with SU2C (13,14). Response to 77 therapeutic compounds (GI50 scores), ER and HER2 receptor status, and other phenotypic information is shown in the clinical data.
NEW FEATURES
Website redesign
The largest new feature is a completely redesigned user interface (Figure 2). In particular, we have focused on making the controls more obvious and intuitive, enhancing the readability of drawn text, and improving the responsiveness of the site by using more modern web technologies. Dataset selection has been moved closer to the top of the page, making it easier for users to find datasets of interest. All per-dataset controls have been moved to each individual dataset display, allowing direct configuration. Additionally, it is now easier and more natural to find or make user genesets and signatures. The user interface for the clinical heatmap has been dramatically improved allowing intuitive configuration of visible clinical features and subgroup construction based on clinical and genomic data.
Figure 2.

Screenshot from user documentation highlighting features in the new user interface.
In tandem with the updated interface, the browser now has an interactive tutorial which highlights much of the new functionality. Our software detects when a user last used the browser and automatically opens if new features have been added to the browser since they last visited. Additionally, the user guide was completely updated and FAQs were added.
New clinical heatmap features
In addition to updating the interface for the clinical heatmap, some new features were added. It is now possible to zoom in on a subset of samples by clicking and dragging within the clinical heatmap. This makes it easier to more closely examine a sample and its values. Clinical features are also now automatically sorted from left to right. To modify the sort order of the features in the heatmap, users click to move clinical features. Since sample order in the genomic and associated clinical heatmap is determined by the sort order of the clinical features, rearranging clinical features automatically triggers a vertical reordering of both heatmaps. This allows users to more easily explore phenotype and genotype associations using the browser. Additionally, subgroups are now displayed as a clinical feature, making it easier to sort samples by any subgrouping.
Updated genes view
Users can view genomic data on a per-gene basis, where probes that map to the same gene are displayed together. To display DNA methylation data from platforms with many probes per gene, especially the Infinium HumanMethylation450 chip, we now render probes ordered left to right in the direction of transcription. Used in conjunction with chromosome view, this allows the user to easily see which section of a gene is methylated under genes view, allowing evaluation of DNA methylation in different genomic contexts, such as multiple promoter sites and in gene bodies (Supplementary Figure S1). The relationship between DNA methylation and transcription is more nuanced than first predicted, making it important to visualize exactly where in a gene the methylation is occurring (15–17).
User accounts and website architecture
Previously, there were many browser installations at different websites for groups desiring private access to protected data. To reduce engineering overhead, a controlled access mechanism was put in place to restrict the display of certain data to authorized users. This mechanism relies on new backend architecture that allows us to provide the same level of security as private installations but is transparent to the user. As part of this, we implemented user accounts, allowing us to authenticate users. This new security system currently supports the SU2C breast cancer dream team, ISPY 2 TRIAL, LINCS project, and other projects.
Implementing user accounts resulted in two additional features. First, users who had access to multiple private installations can now view data from all of their projects together. This allows users to make connections across data sources. User accounts also allowed us to start saving user genesets and signatures. As we offer more new features, we hope to allow users to save other data as well, including bookmarks. Users do not need to be authorized to sign up for a free account or access public data; this service is open to everyone.
Data version control and downloads
When we constructed the TCGA pipeline, we concurrently implemented data freezes and data version control. This was done so users know what version of the data they are viewing and whether the data changed since it was viewed last. Users can also download the processed datasets for further analysis. These processed datasets can have advantages over the original data as they have been normalized and include clinical data curation.
Tumor Image Browser
Our previous Tumor Image Browser, hgMicroscope, has been replaced by a completely new Google-Maps based browser. Applying the Google Maps interface to tumor images has made exploring a microscope slide easier and more intuitive. Currently the browser contains 2748 TCGA images, both tumor and normal, including 1169 from ovarian serous cystadenocarcinoma, 1273 from glioblastoma multiforme and 306 from uterine corpus endometrioid carcinoma.
FUTURE DIRECTIONS
Our plans for the next year include providing users a way to bookmark a view both for themselves and to share with others. Internal progress has already been made allowing users to visualise their own patient-identifiable or unpublished data in a secure manner. We will also develop new viewing capabilities for multianalyte data, allowing user to view copy number, gene expression, and clinical data from the same set of samples within the same map. Finally, we are planning on displaying mutation data in a new heatmap visualization.
We will continue to expand the data we display from TCGA. Additionally, we will display the new public data from LINCS, which aims to use genome-wide expression profiling to catalog the cellular consequences of small-molecule and genetic perturbations in a breadth of human cell lines. We plan to publicize and provide an API for our data format.
SUPPLEMENTARY DATA
Supplementary Data are available at NAR Online: Supplementary Figure 1.
FUNDING
National Cancer Institute (NCI) [5U24CA143858]; American Association for Cancer Research (AACR) Stand Up To Cancer (SU2C) program [SU2C-AACR-DT0409]; UCSF Helen Diller Family Comprehensive Cancer Center. Funding for open access charge: Howard Hughes Medical Institute.
Conflict of interest statement. None declared.
ACKNOWLEDGEMENTS
The authors thank Erich Weiler, Jorge Garcia and the UCSC Genome Browser for their support.
REFERENCES
- 1.Hahn WC, Weinberg RA. Modelling the molecular circuitry of cancer. Nat. Rev. Cancer. 2002;2:331–341. doi: 10.1038/nrc795. [DOI] [PubMed] [Google Scholar]
- 2.Hanahan D, Weinberg RA. Hallmarks of cancer: the next generation. Cell. 2011;144:646–674. doi: 10.1016/j.cell.2011.02.013. [DOI] [PubMed] [Google Scholar]
- 3.Vogelstein B, Kinzler KW. Cancer genes and the pathways they control. Nat. Med. 2004;10:789–799. doi: 10.1038/nm1087. [DOI] [PubMed] [Google Scholar]
- 4.Zhu J, Sanborn JZ, Benz S, Szeto C, Hsu F, Kuhn RM, Karolchik D, Archie J, Lenburg ME, Esserman LJ, et al. The UCSC Cancer Genomics Browser. Nat. Methods. 2009;6:239–240. doi: 10.1038/nmeth0409-239. [DOI] [PMC free article] [PubMed] [Google Scholar]
- 5.Collins FS, Barker AD. Mapping the cancer genome. Pinpointing the genes involved in cancer will help chart a new course across the complex landscape of human malignancies. Sci. Am. 2007;296:50–57. [PubMed] [Google Scholar]
- 6.Barretina J, Caponigro G, Stransky N, Venkatesan K, Margolin AA, Kim S, Wilson CJ, Lehár J, Kryukov GV, Sonkin D, et al. The cancer cell line encyclopedia enables predictive modelling of anticancer drug sensitivity. Nature. 2012;483:603–607. doi: 10.1038/nature11003. [DOI] [PMC free article] [PubMed] [Google Scholar]
- 7.Barker AD, Sigman CC, Kelloff GJ, Hylton NM, Berry DA, Esserman LJ. I-SPY 2: an adaptive breast cancer trial design in the setting of neoadjuvant chemotherapy. Clin. Pharmacol. Ther. 2009;86:97–100. doi: 10.1038/clpt.2009.68. [DOI] [PubMed] [Google Scholar]
- 8.Garnett MJ, Edelman EJ, Heidorn SJ, Greenman CD, Dastur A, Lau KW, Greninger P, Thompson IR, Luo X, Soares J, et al. Systematic identification of genomic markers of drug sensitivity in cancer cells. Nature. 2012;483:570–575. doi: 10.1038/nature11005. [DOI] [PMC free article] [PubMed] [Google Scholar]
- 9.Mermel CH, Schumacher SE, Hill B, Meyerson ML, Beroukhim R, Getz G. GISTIC2.0 facilitates sensitive and confident localization of the targets of focal somatic copy-number alteration in human cancers. Genome Biol. 2011;12:R41. doi: 10.1186/gb-2011-12-4-r41. [DOI] [PMC free article] [PubMed] [Google Scholar]
- 10.Vaske CJ, Benz SC, Sanborn JZ, Earl D, Szeto C, Zhu J, Haussler D, Stuart JM. Inference of patient-specific pathway activities from multi-dimensional cancer genomics data using PARADIGM. Bioinformatics. 2010;26:i237–i245. doi: 10.1093/bioinformatics/btq182. [DOI] [PMC free article] [PubMed] [Google Scholar]
- 11.Noushmehr H, Weisenberger DJ, Diefes K, Phillips HS, Pujara K, Berman BP, Pan F, Pelloski CE, Sulman EP, Bhat KP, et al. Identification of a CpG island methylator phenotype that defines a distinct subgroup of glioma. Cancer Cell. 2010;17:510–522. doi: 10.1016/j.ccr.2010.03.017. [DOI] [PMC free article] [PubMed] [Google Scholar]
- 12.Colman H, Zhang L, Sulman EP, McDonald JM, Shooshtari NL, Rivera A, Popoff S, Nutt CL, Louis DN, Cairncross JG, et al. A multigene predictor of outcome in glioblastoma. Neuro Oncol. 2010;12:49–57. doi: 10.1093/neuonc/nop007. [DOI] [PMC free article] [PubMed] [Google Scholar]
- 13.Heiser LM, Sadanandam A, Kuo WL, Benz SC, Goldstein TC, Ng S, Gibb WJ, Wang NJ, Ziyad S, Tong F, et al. Subtype and pathway specific responses to anticancer compounds in breast cancer. Proc. Natl Acad. Sci. USA. 2012;109:2724–2729. doi: 10.1073/pnas.1018854108. [DOI] [PMC free article] [PubMed] [Google Scholar]
- 14.Neve RM, Chin K, Fridlyand J, Yeh J, Baehner FL, Fevr T, Clark L, Bayani N, Coppe JP, Tong F, et al. A collection of breast cancer cell lines for the study of functionally distinct cancer subtypes. Cancer Cell. 2006;10:515–527. doi: 10.1016/j.ccr.2006.10.008. [DOI] [PMC free article] [PubMed] [Google Scholar]
- 15.Curradi M, Izzo A, Badaracco G, Landsberger N. Molecular mechanisms of gene silencing mediated by DNA methylation. Mol. Cell. Biol. 2002;22:3157–3173. doi: 10.1128/MCB.22.9.3157-3173.2002. [DOI] [PMC free article] [PubMed] [Google Scholar]
- 16.Eden S, Cedar H. Role of DNA methylation in the regulation of transcription. Curr. Opin. Genet. Dev. 1994;4:255–259. doi: 10.1016/s0959-437x(05)80052-8. [DOI] [PubMed] [Google Scholar]
- 17.Jones PA. Functions of DNA methylation: islands, start sites, gene bodies and beyond. Nat. Rev. Genet. 2012;13:484–492. doi: 10.1038/nrg3230. [DOI] [PubMed] [Google Scholar]