Abstract
Gaining information about structural and functional features of newly identified proteins is often a difficult task. This information is crucial for understanding sequence–structure–function relationships of target proteins and, thus, essential in comprehending the mechanisms and dynamics of the molecular systems of interest. Using protein energy profiles is a novel approach that can contribute in addressing such problems. An energy profile corresponds to the sequence of energy values that are derived from a coarse-grained energy model. Energy profiles can be computed from protein structures or predicted from sequences. As shown, correspondences and dissimilarities in energy profiles can be applied for investigations of protein mechanics and dynamics. We developed eProS (energy profile suite, freely available at http://bioservices.hs-mittweida.de/Epros/), a database that provides ∼76 000 pre-calculated energy profiles as well as a toolbox for addressing numerous problems of structure biology. Energy profiles can be browsed, visualized, calculated from an uploaded structure or predicted from sequence. Furthermore, it is possible to align energy profiles of interest or compare them with all entries in the eProS database to identify significantly similar energy profiles and, thus, possibly relevant structural and functional relationships. Additionally, annotations and cross-links from numerous sources provide a broad view of potential biological correspondences.
INTRODUCTION
The amino acid sequence-based predictions of protein structure features, stability analyses of known protein structures as well as secondary structure predictions are important tasks in protein modelling (1). Several energy functions and force fields that model the protein free-energy landscape have been developed to address these protein modelling problems. On the one hand, they contribute to protein modelling (i.e. comparative modelling, threading or ab initio folding) and protein model assessment. On the other hand, force fields are essential in molecular simulations and can account for the understanding of dynamics in molecular systems (2). They can also help to comprehend the relations between protein structure and function.
Energy models can be based on first principles approaches using physics laws. In addition, statistical analyses of experimentally derived structures form the basis for the development of so-called knowledge-based energy potentials (2–4). Although the approaches for computing knowledge-based energy potentials are simplified, they can reproduce experimental data with a high level of accuracy if adapted to a specific problem.
For example, elastic network models use simplified coarse-grained interaction models and have proven themselves to accurately determine protein dynamics (5,6). In general, the continuous application of coarse-grained interaction models is because of the reduction of system complexity and, thus, computational demands.
In 2006, Kozielski and colleagues (7) proposed that the sequences of energy values, so-called energy profiles, derived from protein structures by using potential functions can be compared using modified Needleman and Wunsch (8) and Smith and Waterman (9) alignment procedures. They have shown that pairwise comparisons and detected energy profile similarities can lead to the identification of proteins assigned to the same protein families. Additionally, conformational modifications as a result of enzymatic reactions or, in general, protein–environment interactions can be inspected (7,10,11). These studies substantiate the possible fields of application of energy profile-based methods. However, to allow large-scale or even databank-wide investigations, the generation of large data sets is required. Because of the semi-automatic computation and error-prone nature often implicated by all-atom-based models, generating data sets on a large scale, for example, comparable with the Protein Data Bank (PDB) (12), becomes difficult. This holds especially if physics-based approaches are used as proposed by Kozielski and colleagues (7,10,11).
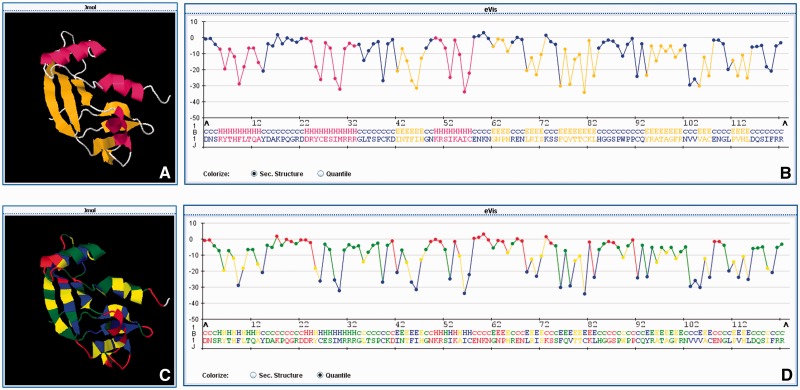
To allow large-scale energy profile-based analyses, we have developed eProS (energy profile suite), a database and toolbox for energy profile-based studying and comparing sequence–structure–function relationships and protein stability. Energy profiles are derived by using a straightforward coarse-grained energy model, which is suitable for globular and α-helical membrane protein structures. In the process of energy profile calculation, spatial and physicochemical information is integrated. As a result, energy profiles can be interpreted as protein-specific representations (see the Supplementary Data for further details). For example, the eProS output of the human angiogenin variant H13A (PDB ID 1b1j) is illustrated in Figure 1. The sequential visualization of an energy profile (Figure 1B and D) is the most intuitive. However, energy-to-structure mappings, as shown in Figure 1C, can contribute to identify low-energetic and, thus, stabilizing regions and properties in protein structures.
Figure 1.
In this figure, the eProS output of the human angiogenin variant H13A (PDB ID 1b1j) is depicted. In (B) and (D), the energy profile is shown as a sequence of energy values. Colouring schemes for energy-to-structure mappings (C and D) and structure-to-sequence mappings (A and B) are provided. The energy colouring is discretized by assigning each energy value to one of the 4-quantiles in the energetic spectrum derived from the eProS database. This measure is because of visualization and performance purposes. The colour mappings provide insights that can contribute to identify low-energetic and, thus, stabilizing regions and properties in protein structures.
Currently, eProS stores 74 900 pre-calculated energy profiles derived from experimental globular protein structures and ∼1300 pre-calculated profiles of α-helical membrane protein structures.
The eProS toolbox and the underlying eProS database provide various ways of visualizing, downloading and accessing energy profile data. The toolbox also includes database-wide searching for similar energy profiles. Here, the query energy profile can be defined by specifying a structure by PDB ID, by uploading a structure in PDB format from which the query energy profile is generated or by uploading an energy profile file that, for example, has been retrieved from the eProS database. Additionally, an amino acid sequence can be used as input. Starting from this, an energy profile prediction algorithm is used, leading to an energy profile that can be used for database-wide searching. The best matching hits are visualized by the eProS toolbox. Various sources of annotation [e.g. Gene Ontology (GO) (13), PDB, CATH (14), SCOP (15) and Pfam (16)] provide a wide view on structural and functional features of the best hits, which can be further broadened through the reverse annotation lookup provided by eProS. The reverse annotation lookup lists all energy profiles that match with the annotation specified by the user. For example, energy profiles of all proteins sharing the same structural topology or molecular function can be investigated concerning common energetic features that point to their similar structure or function. Thus, starting from a protein structure or sequence, estimations about correspondences of protein function and structural features can be drawn from these results and annotations.
DATABASE AND SEARCH TOOL DESCRIPTION
Content and data organization
At present, eProS supplies energy profiles for ∼76 200 PDB entries that are internally separated into 74 900 globular protein and 1300 α-helical transmembrane protein energy profiles. The corresponding PDB flat files, containing protein structure information, are stored in a local directory on the Web server hosting eProS. Based on these files, energy profiles for each available PDB entry have been pre-computed. Energy profiles are stored in files of a specifically tailored format. The following file formats have been defined and are available for download and analyses:
*.ep: Tab character separated files with each row containing five columns (chain identifier, PDB residue index, amino acid one-letter code, secondary structure assignment and energy value). The first two lines are reserved for listing the PDB ID and the header row.
*.ep2: Extended *.ep file. Each line represents a record, whereat the first four characters specify the record type. Record fields are tab character-separated. The following record types are currently defined: ‘NAME’ (PDB ID), ‘TYPE’ (‘TM’ for α-helical transmembrane protein structures, ‘nTM’ for globular protein structures), ‘HEAD’ (header row), ‘ENGY’ (energy value for a single residue, the five record fields correspond to the five columns of a row in a *.ep file) and ‘REMK’ (indicating a comment line).
*.eps: Binary files. This file format is going to be used in upcoming standalone software applications. It is only in use in server-internal routines at present.
For each protein structure in the local PDB file repository, an energy profile has been saved in each of these three file formats.
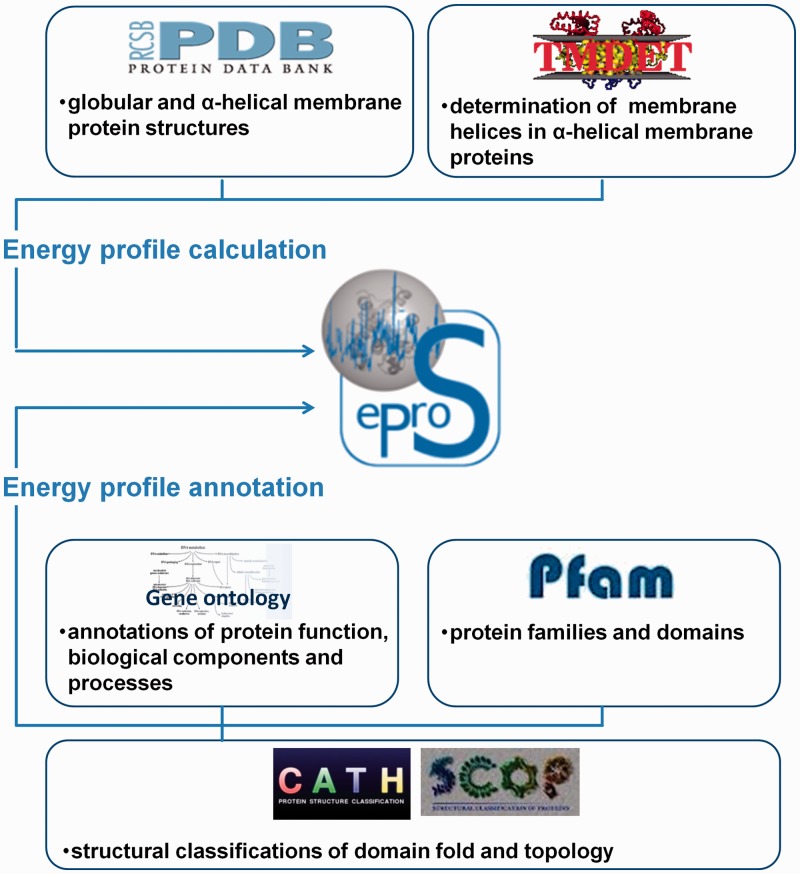
The annotation entries displayed on the detailed view of a protein are retrieved from internal relational databases at runtime. All information provided by the database has been obtained from external sources and related databases. For an overview of the integrated data and their sources see Figure 2. The data integration has been achieved as follows:
Figure 2.
The eProS database integrates data from the PDB (12) and TMDET (energy profile calculation) as well as the Gene Ontology database (13), CATH (14), SCOP (15) and Pfam (16) (energy profile annotation). Energetic discrepancies and similarities between proteins can be investigated by the eProS toolbox. The energy profile annotations provided by the data integration can broaden the understanding of the relationships between energetic, functional and structural properties. Furthermore, the advanced reverse annotation lookup can be a valuable method to identify functional- and structural-related proteins and study their energetic similarities.
TMDET prediction
TMDET is a service that implements a neural network-based method for the prediction of membrane spanning regions in 3D structures (17). For each α-helical membrane protein structure present at eProS database, a prediction has been computed. These predictions are essential for deriving an energy profile from α-helical membrane protein structures by using the coarse-grained model (for details see the elucidations given in the Supplementary Data). Additionally, if the user has uploaded an α-helical membrane protein structure for analyses, TMDET is applied for predicting the location of the membrane bilayer, and according to these predictions, the energy profile is generated.
Pfam classification
The current release of the Pfam database is available in terms of an SQL dump (16). As for the annotation retrieval, only two tables are required, ‘pfama’ (∼2200 rows), containing the Pfam classifications, and ‘pdb_pfama_req’ (∼110 000 rows), mapping PDB IDs to their corresponding classifications.
SCOP classification
The SCOP classification releases are not provided in terms of an SQL database dump but as character-separated value files instead (15). According to this data, the following tables have resulted: ‘des’ (∼144 000 rows) contains descriptions for all SCOP classifications, ‘hie’ (∼144 000 rows) represents the SCOP classification hierarchy and ‘cla’ (∼111 000 rows) assigns PDB IDs to SCOP classifications.
CATH classification
Two files of the current CATH database release (14) served as source of annotation data, ‘CathDomainList’ and ‘CathNames’. The resulting tables ‘domains’ (∼153 000 rows) and ‘names’ (∼3900 rows) provide information about assigned CATH domains and names of CATH classification nodes, respectively.
GO term annotation
Of the 44 tables found in the images of the GO database (13), the following are required to gain the GO terms associated with a protein structure: ‘term’ (∼37 000 rows) containing the GO terms, ‘gene_product’ (∼13 000 000 rows) containing gene products and ‘species’ (∼890 000 rows) containing species the gene products originate from. The ‘association’ table lists (∼77 000 000 rows) assignments of GO terms to gene products. To find GO terms matching to a PDB ID, the name of each macromolecule of the entry and their sources (NCBI Tax ID) are required. Therefore, two auxiliary tables have been created (∼122 000 rows and 108 000 rows, respectively). However, searching for GO terms and especially performing reverse annotation lookups had caused unacceptable response times because of complex query statements that had been originated in the database development. For performance improvements, an additional table (∼610 000 rows) has been created, which assigns the GO terms to each protein directly. Thereby a speedup (>5 min to 100 ms) has been achieved for reverse annotation lookup.
Working with the eProS database
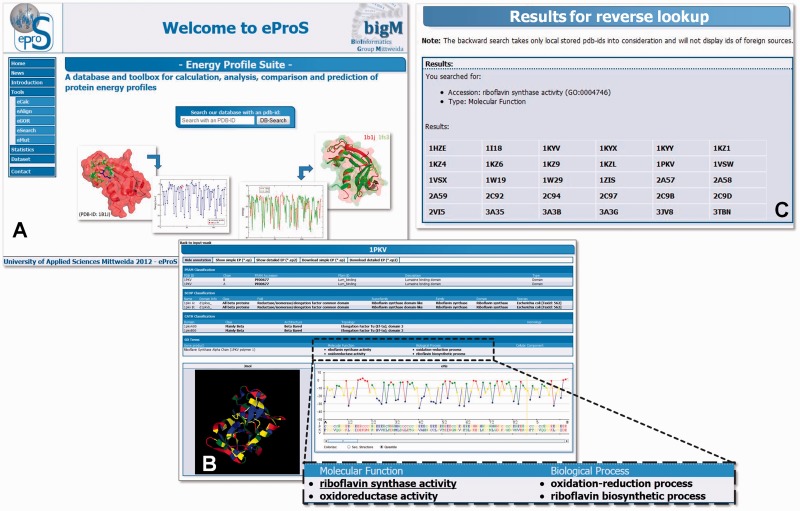
The eProS and the collection of energy profiles are freely available to the scientific community in a separate download section (accessible through the ‘Dataset’ link at the eProS homepage). In the download section, it is possible to browse the database and inspect energy profiles of interest. For this purpose, eProS provides the access of energy profile data thropugh flat HTML page tables or by automated download programs, such as wget (http://www.gnu.org/software/wget/) or similar software. This ensures large-scale downloading of energy profile files and high-throughput analyses. The eProS toolbox permits accessing the data by more sophisticated energy profile visualizations, for example, plotting of energy profiles and viewing the protein structure of interest highlighted with energy value-based colouring schemes (Figures 1C and 3). Cross-links and annotations retrieved from various foreign sources (Figures 2 and 3B) are available. From these annotations, the reverse annotation lookup can be accessed, and, subsequently, energy profiles of proteins matching the user-specified annotation are listed (e.g. Figure 3C). As an example, after querying the N-terminal domain of the riboflavin synthase by specifying its PDB ID (1pkv) at the eProS home page (Figure 3A), the corresponding energy data and structure as well as the related annotations are listed (Figure 3B). Reverse annotation lookup is accessed by clicking the annotation of choice, which leads to the list of energy profile data available at eProS that share the specified annotation, in this case riboflavin synthase activity (Figure 3C).
Figure 3.
The eProS database can be accessed through the eProS homepage (A) by specifying a PDB ID, by browsing the data set (‘Dataset’ link, on the left in A) or by using the eCalc tool of the eProS toolbox (see list in A on the left). The graphical output of energy profile data given by eProS (B) includes visualizations by graphs and a 3D structure viewer. Annotations related to foreign databases (Figure 2) are reported, and they provide a wide spectrum of information about structural and functional aspects of the protein of interest (shown in B). Additionally, annotations can be accessed interactively. By that, the integrated reverse annotation lookup lists all PDB IDs that match the specified annotation and that are currently present at the database (C). From this, the listed protein structures can be investigated concerning common energetic properties that point to their structural and functional similarity.
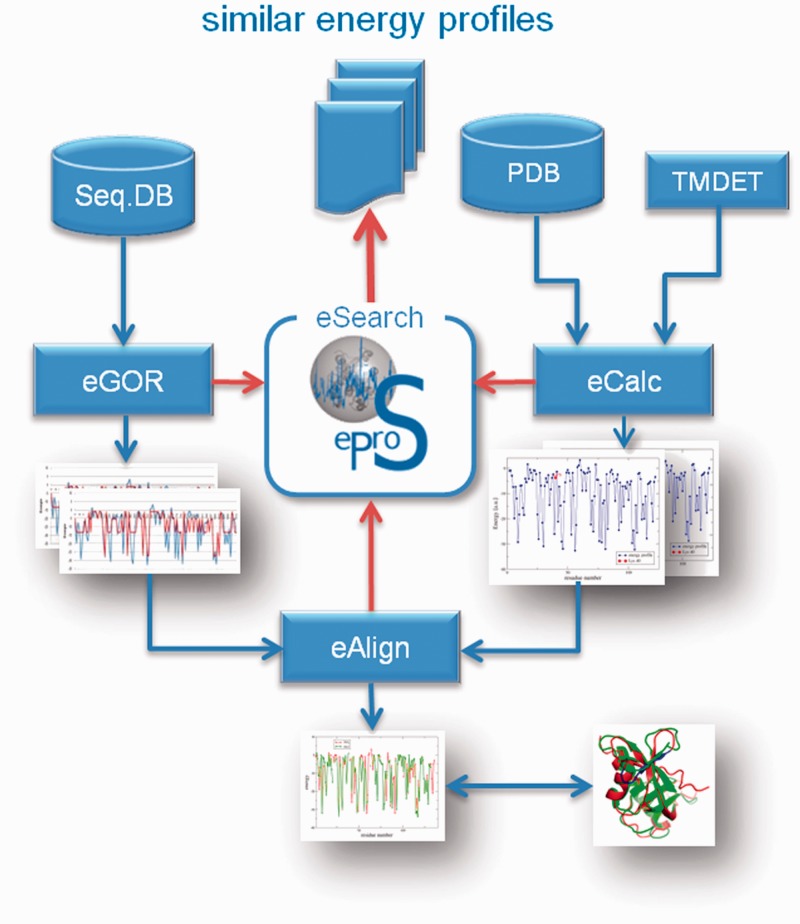
Further methods have been implemented and integrated into the toolbox that allow energy profile analysis, calculation, sequence-based prediction and a database-wide searching for identical or similar energy profiles. An overview of these tools and the implemented data flow is given in Figure 5. The following elucidations explain these tools briefly:
Figure 5.
The eProS toolbox affords several, interconnected methods for accessing and working with the eProS database. Besides energy profile data access and calculation (eCalc), methods for predicting (eGOR) and aligning (eAlign) energy profiles have been implemented. These techniques can be used to derive or retrieve energy data that can be queried for at the eProS database (eSearch). Identified significantly similar energy profiles can be further investigated. Provided annotations and detected similarities can aid in understanding the dynamics and functional aspects of the protein of interest.
eAlign
This tool provides modified Needleman Wunsch (8) and Smith-Waterman-like (9) alignment procedures for computing pairwise energy profile alignments. Generated alignments are presented as graphs, ASCII-formatted texts as well as dotplots in which energetic identities and similarities are highlighted. In addition, eAlign computes a so-called distance Score (dScore). The dScore gives a hint about the energy profile similarity observed in the alignment (see the Supplementary Data for details).
eCalc
eCalc provides the energy profile computation. On the one hand, a PDB ID can be specified, and the corresponding energy profile data are displayed if they are present in the database. If this is not the case, the corresponding coordinates are retrieved from the PDB, and the energy profile is computed. On the other hand, the user can upload a protein structure from which the energy profile is generated, subsequently. The output can be investigated, downloaded for further analyses or reused as input for the eProS toolbox.
eGOR
Adopted to the concepts and implementations of protein secondary structure prediction (e.g. GOR I–V) discussed by Garnier and colleagues (18–20), eGOR applies information theory-based methods and knowledge derived from known energy profiles to predict a residues energy value according to its sequence neighbourhood composition. This algorithm is the basis for the eGOR tool, and it allows the prediction of an energy profile starting from a user-specified sequence.
eMut
This tool visualizes the energetic similarities and dissimilarities of proteins of the same length. Thus, analysis of, for example, (point-)mutated proteins, structure trajectories obtained from molecular dynamics or coarse-grained dynamics simulations or influences of temperature variations on protein stability is supported by eMut.
eSearch
The eSearch tool facilitates database-wide searching for identifying similar energy profiles to a query. The query energy profile can be specified in various ways. First of all, eSearch enables searching by a user-specified PDB ID. Additionally, the user can provide a protein structure (e.g. a structure model) by uploading the coordinate data in PDB format from which the energy profile is generated and queried to the eProS database. Third, an energy profile file can be uploaded, which has been generated by means of eCalc, eGOR or which has been retrieved from the database.
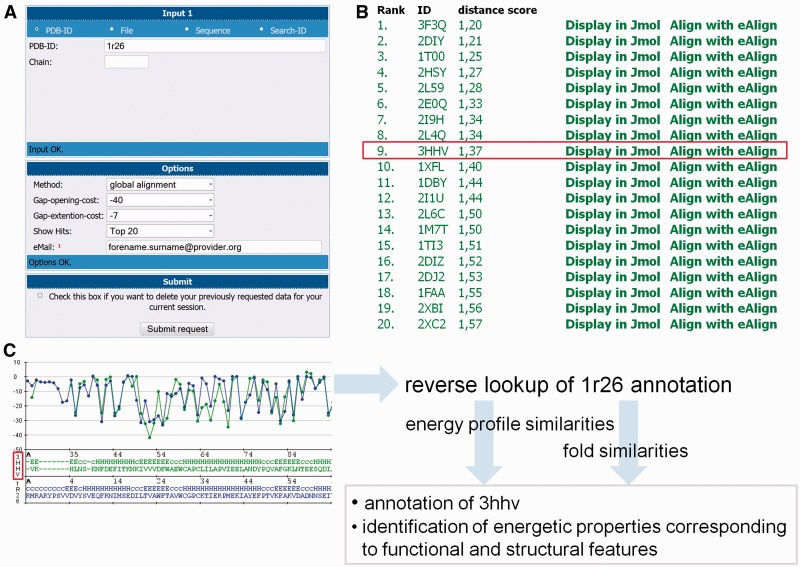
In the process, pairwise alignments of the query energy profile to all entries of the specified entry set (e.g. globular proteins or α-helical membrane proteins) are generated. From each alignment, the corresponding dScore is heuristically computed and recorded. This process requires ∼3 h of computation for querying an average-sized protein structure (≈120 amino acids) to the set of globular protein energy profiles. Because of the time demands, the user has to specify a valid e-mail address to run an eSearch query. After the computation has finished, an e-mail is sent to the user, which provides a link to the result session as well as a session id. The results are presented as an interactive list ranked according to the derived dScores. An example of using eSearch is illustrated in Figure 4. In this case, the energy profile of Trypanosoma brucei brucei thioredoxin (PDB ID 1r26) has been queried, and numerous similar energy profiles have been identified (Figure 4A and B). As a representative example for the general observations that can be made from this query, the energy profile alignment to the ninth match (PDB ID 3hhv) indicates numerous global energetic correspondences (Figure 4C). As shown, the best matching energy values are located in the first helix and second strand in both structures. By using the reverse annotation lookup of functional annotations (e.g. ‘cell redox homeostasis’ and ‘glycerol ether metabolic process’) and structural annotations (e.g. ‘glutaredoxin’) of 1r26, corresponding energy profile entries are listed. Note that most proteins present in the reverse annotation lookup list are reported as best-matching energy profiles. As 3hhv has not been annotated by GO-terms; yet, it can be proposed that the GO-terms associated to the best matches can be applied for annotating 3hhv. Furthermore, integrating the profiles reported by eSearch and reverse annotation lookup to the analyses, the energetic properties can be identified that are responsible for stabilizing the fold. For example, mainly low-energetic residues can be found in the second strand (Figure 4C). In contrast, the third strand is consisting of residues with alternating energy values. Both observations are in agreement in all proteins sharing this topology. On the other hand, functional energetic features might be basically corresponding to residues located in the first helix and second strand, as these residues are found to be energetically conserved in all energy profiles listed by the functional reverse annotation lookup.
Figure 4.
eSearch is a tool that provides eProS-wide searching for similar protein energy profiles. It can be queried (A) by specifying an energy profile by its PDB ID, by uploading a structure from which the corresponding energy profile is subsequently computed or by specifying a sequence. In the last case, an energy profile prediction algorithm (eGOR) is applied. Because of long computing times, the user has to enter a valid e-mail address. Access to previous search results is provided by direct-links and session ids sent by e-mail. eSearch results are given as lists that are ranked according to derived distance scores (dScores) (B). In general, the dScore reports the significance of the resulting energy profile alignment and, thus, energy profile similarity (see the Supplementary Data for further details). In this example, the Trypanosoma brucei brucei thioredoxin has been queried, leading to a list of various energetically similar protein structures (hits). For the ninth hit (PDB ID 3hhv), no GO-term annotation is given. With respect to the energy profile alignment (C) and similarities obtained from energy profile analyses of further hits and entries retrieved by reverse annotation lookup, functional and structural energetic properties can be detected that are common in all identified energy profiles, including 3hhv. From this, GO-term annotations for 3hhv can be proposed.
In a similar way, the functional clarification of protein structures of unknown function can be facilitated.
CONCLUSION
The analyses of proteins based on energy profiles can contribute in understanding correspondences of protein sequence to structure, stability and function (7,10,11,21). However, the generation of large scale databases of energy profiles derived from physics-based approaches is difficult to automatize, error-prone and slow. The eProS database and the eProS toolbox provide energy profile-based calculation, analysis, prediction and comparison of protein energy profiles computed using a coarse-grained energy model. Cross-links and annotations, which are related to structure and annotation databases, provide a wide information spectrum of the protein of interest. eProS also provides reverse lookup techniques for browsing energy profiles that match a user-specified annotation of the investigated protein. From this, energetic similarities can be identified that might correspond to structural and functional features (see Figure S1 for an illustration). Such insights can be helpful for coarse-grained analyses of protein dynamics and protein–protein interactions. Additionally, the investigation of protein families on the basis of energy profiles can contribute to elucidate family memberships and functional variability. Especially the eGOR algorithm provided by the eProS toolbox can aid in approaching such biological questions.
Future developments of eProS are going to include the improvement of time-performance of eSearch. Additionally, implementing cross-links between energy profile data will provide a more user-friendly data access. Furthermore, an automated energy profile and annotation retrieval system is currently work in progress. This system is going to be capable of updating the eProS database automatically on a weekly or monthly basis. At the moment, an approach for predicting the topology of an α-helical membrane protein based on its predicted energy profile is under evaluation and will be integrated to the toolbox.
SUPPLEMENTARY DATA
Supplementary Data are available at NAR Online: Supplementary Information, Supplementary Figure 1 and Supplementary References [22–27].
FUNDING
Funding for open access charge: Europäischer Sozialfonds (ESF); Sächsisches Ministerium für Wirtschaft und Kultur (SMWK), Free State of Saxony, University of Applied Sciences Mittweida.
Conflict of interest statement. None declared.
ACKNOWLEDGEMENTS
The authors thank the group members Steffen Grunert and Michael Spranger.
REFERENCES
- 1.Zvelebil M, Baum J. Understanding Bioinformatics. Garland Science. 2008 NY. [Google Scholar]
- 2.Zhang C, Liu S, Zhou H, Zhou Y. The dependence of all-atom statistical potentials on structural training database. Biophys. J. 2004;86:3349–3358. doi: 10.1529/biophysj.103.035998. [DOI] [PMC free article] [PubMed] [Google Scholar]
- 3.Sippl MJ. Calculation of conformational ensembles from potentials of mean force. An approach to the knowledge-based prediction of local structures in globular proteins. J. Mol. Biol. 1990;213:859–883. doi: 10.1016/s0022-2836(05)80269-4. [DOI] [PubMed] [Google Scholar]
- 4.Sippl MJ. Boltzmann’s principle, knowledge-based mean fields and protein folding. An approach to the computational determination of protein structures. J. Comput. Aided Mol. Des. 1993;7:473–501. doi: 10.1007/BF02337562. [DOI] [PubMed] [Google Scholar]
- 5.Atilgan AR, Durell SR, Jernigan RL, Demirel MC, Keskin O, Bahar I. Anisotropy of fluctuation dynamics of proteins with an elastic network model. Biophys. J. 2001;80:505–515. doi: 10.1016/S0006-3495(01)76033-X. [DOI] [PMC free article] [PubMed] [Google Scholar]
- 6.Kloczkowski A, Jernigan RL, Wu Z, Song G, Yang L, Kolinski A, Pokarowski P. Distance matrix-based approach to protein structure prediction. J. Struct. Funct. Genomics. 2009;10:67–81. doi: 10.1007/s10969-009-9062-2. [DOI] [PMC free article] [PubMed] [Google Scholar]
- 7.Mrozek D, Malysiak B, Kozielski S. EAST: Energy Alignment Search Tool. In: Wang L, Jiao L, Shi G, Li X, Liu J, editors. Fuzzy Systems and Knowledge Discovery. 2006. Heidelberg Vol. 4223 of Lecture Notes in Computer Science. Springer, Berlin, pp. 696–705. [Google Scholar]
- 8.Needleman SB, Wunsch CD. A general method applicable to the search for similarities in the amino acid sequence of two proteins. J. Mol. Biol. 1970;48:443–453. doi: 10.1016/0022-2836(70)90057-4. [DOI] [PubMed] [Google Scholar]
- 9.Smith TF, Waterman MS. Identification of common molecular subsequences. J. Mol. Biol. 1981;147:195–197. doi: 10.1016/0022-2836(81)90087-5. [DOI] [PubMed] [Google Scholar]
- 10.Mrozek D, Malysiak B, Kozielski S. An optimal alignment of proteins energy characteristics with crisp and fuzzy similarity awards. 2007 In: Fuzzy Systems Conference, 2007. FUZZ-IEEE 2007. IEEE International. pp. 1–6. [Google Scholar]
- 11.Mrozek D, Malysiak-Mrozek B, Kozielski S. In: Fuzzy Information Processing Society, 2009. NAFIPS 2009. Annual Meeting of the North American Fuzzy Information Processing Society. 2009. Alignment of protein structure energy patterns represented as sequences of Fuzzy Numbers. NAFIPS, 2009. IEEE, IEEE conference publications. [Google Scholar]
- 12.Rose PW, Beran B, Bi C, Bluhm WF, Dimitropoulos D, Goodsell DS, Prlic A, Quesada M, Quinn GB, Westbrook JD, et al. The RCSB Protein Data Bank: redesigned web site and web services. Nucleic Acids Res. 2011;39:D392–D401. doi: 10.1093/nar/gkq1021. [DOI] [PMC free article] [PubMed] [Google Scholar]
- 13.Gene Ontology Consortium. The Gene Ontology: enhancements for 2011. Nucleic Acids Res. 2012;40:D559–D564. doi: 10.1093/nar/gkr1028. [DOI] [PMC free article] [PubMed] [Google Scholar]
- 14.Cuff AL, Sillitoe I, Lewis T, Clegg AB, Rentzsch R, Furnham N, Pellegrini-Calace M, Jones D, Thornton J, Orengo CA. Extending CATH: increasing coverage of the protein structure universe and linking structure with function. Nucleic Acids Res. 2011;39:D420–D426. doi: 10.1093/nar/gkq1001. [DOI] [PMC free article] [PubMed] [Google Scholar]
- 15.Andreeva A, Howorth D, Chandonia J-M, Brenner SE, Hubbard TJP, Chothia C, Murzin AG. Data growth and its impact on the SCOP database: new developments. Nucleic Acids Res. 2008;36:D419–D425. doi: 10.1093/nar/gkm993. [DOI] [PMC free article] [PubMed] [Google Scholar]
- 16.Punta M, Coggill PC, Eberhardt RY, Mistry J, Tate J, Boursnell C, Pang N, Forslund K, Ceric G, Clements J, et al. The Pfam protein families database. Nucleic Acids Res. 2012;40:D290–D301. doi: 10.1093/nar/gkr1065. [DOI] [PMC free article] [PubMed] [Google Scholar]
- 17.Tusnády GE, Dosztányi Z, Simon I. TMDET: web server for detecting transmembrane regions of proteins by using their 3D coordinates. Bioinformatics. 2005;21:1276–1277. doi: 10.1093/bioinformatics/bti121. [DOI] [PubMed] [Google Scholar]
- 18.Gibrat JF, Garnier J, Robson B. Further developments of protein secondary structure prediction using information theory. New parameters and consideration of residue pairs. J. Mol. Biol. 1987;198:425–443. doi: 10.1016/0022-2836(87)90292-0. [DOI] [PubMed] [Google Scholar]
- 19.Garnier J, Gibrat JF, Robson B. GOR method for predicting protein secondary structure from amino acid sequence. Methods Enzymol. 1996;266:540–553. doi: 10.1016/s0076-6879(96)66034-0. [DOI] [PubMed] [Google Scholar]
- 20.Kloczkowski A, Ting K-L, Jernigan RL, Garnier J. Combining the GOR V algorithm with evolutionary information for protein secondary structure prediction from amino acid sequence. Proteins. 2002;49:154–166. doi: 10.1002/prot.10181. [DOI] [PubMed] [Google Scholar]
- 21.Heinke F, Labudde D. Membrane protein stability analyses by means of protein energy profiles in case of nephrogenic diabetes insipidus. Comput. Math. Methods Med. 2012 doi: 10.1155/2012/790281. 2012, 790281. [DOI] [PMC free article] [PubMed] [Google Scholar]
- 22.Wertz DH, Scheraga HA. Influence of water on protein structure. An analysis of the preferences of amino acid residues for the inside or outside and for specific conformations in a protein molecule. Macromolecules. 1978;11:9–15. doi: 10.1021/ma60061a002. [DOI] [PubMed] [Google Scholar]
- 23.Graña O, Baker D, MacCallum RM, Meiler J, Punta M, Rost B, Tress ML, Valencia A. CASP6 assessment of contact prediction. Proteins. 2005;61( Suppl. 7 ):214–224. doi: 10.1002/prot.20739. [DOI] [PubMed] [Google Scholar]
- 24.Ponder J. Technical report. Department of Biochemistry and Molecular Biophysics. Washington University, School of Medicine, St. Louis; 2001. TINKER—software tools for molecular design. [Google Scholar]
- 25.Du Z, Li L, Chen CF, Yu PS, Wang JZ. G-SESAME: web tools for GO-term-based gene similarity analysis and knowledge discovery. Nucleic Acids Res. 2009;37:W345–W349. doi: 10.1093/nar/gkp463. [DOI] [PMC free article] [PubMed] [Google Scholar]
- 26.Brooks B, Bruccoleri R, Olafson B, States D, Swaminthan S, Karplus M. CHARMM: A program for macromolecular energy, minimization, and dynamics calculations. J. Comput. Chem. 1983;4:187–217. [Google Scholar]
- 27.Ye Y, Godzik A. Flexible structure alignment by chaining aligned fragment pairs allowing twists. Bioinformatics. 2003;19(Suppl. 2):ii246–ii255. doi: 10.1093/bioinformatics/btg1086. [DOI] [PubMed] [Google Scholar]


