Abstract
Malignant gliomas are the most common form of primary neoplasm in the central nervous system, and one of the most rapidly fatal of all human malignancies. They are treated by maximal surgical resection followed by radiation and chemotherapy. Herein, we seek to improve the methods available to quantify the extent of tumors using newly presented, collaborative labeling techniques on magnetic resonance imaging. Traditionally, labeling medical images has entailed that expert raters operate on one image at a time, which is resource intensive and not practical for very large datasets. Using many, minimally trained raters to label images has the possibility of minimizing laboratory requirements and allowing high degrees of parallelism. A successful effort also has the possibility of reducing overall cost. This potentially transformative technology presents a new set of problems, because one must pose the labeling challenge in a manner accessible to people with little or no background in labeling medical images and raters cannot be expected to read detailed instructions. Hence, a different training method has to be employed. The training must appeal to all types of learners and have the same concepts presented in multiple ways to ensure that all the subjects understand the basics of labeling. Our overall objective is to demonstrate the feasibility of studying malignant glioma morphometry through statistical analysis of the collaborative efforts of many, minimally-trained raters. This study presents preliminary results on optimization of the WebMILL framework for neoplasm labeling and investigates the initial contributions of 78 raters labeling 98 whole-brain datasets.
Keywords: Glioma, Labeling, Segmentation, Statistical Fusion
1. INTRODUCTION
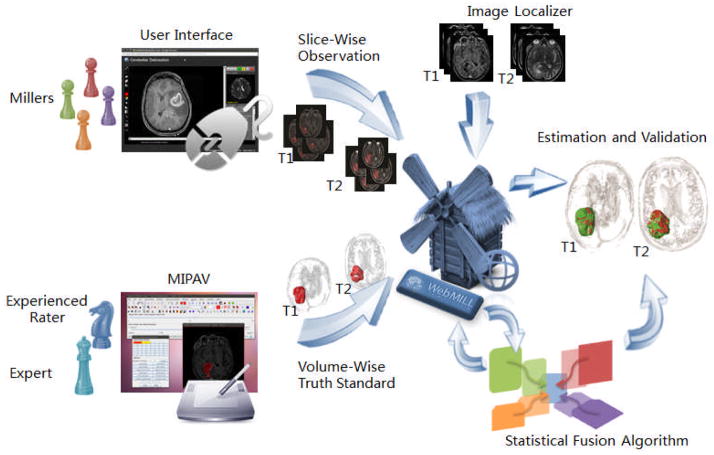
We are investigating an alternative to expert raters for medical image labeling through statistical fusion of the collaborative efforts of many, minimally-trained raters using the Web-based Medical Image Labeling Language (WebMILL) system [1]. In this approach (illustrated by Figure 1), raters need not be located in a laboratory environment or even have ever met the investigating researchers: Labeling may be performed cooperatively over the Internet by people who have no knowledge of each other. Furthermore, we have presented several extensions to the existing statistical image fusion theory that enable combining partially labeled images from many, unreliable raters. We will specifically validate the utility of the collaborative labeling methods in the assessment of clinical malignant gliomas cases.
Figure 1.
The WebMILL system provides a flexible framework to allow remote individuals (“millers”) to asynchronously participate in an image labeling task. Expert knowledge is conveyed to the millers via a series of exemplar cases and catch trials. A statistical fusion algorithm simultaneously assesses performance of millers and estimates an optimal truth label for each image.
Malignant gliomas are the most common form of primary neoplasm in the central nervous system with a symptomatic incidence of approximately 2 per 100,000 individuals in the United States. Numerous clinical studies have attempted to determine whether maximal surgical resection of high grade gliomas improves prognosis [2]. The degree of surgical resection and the grade of tumor strongly correlate with recurrence rate and survival likelihood. Imaging data routinely used for clinical planning, including magnetic resonance imaging (MRI) and computed tomography (CT), embody a rich characterization of brain and tumor morphometry with millimeter level resolution. Interestingly, while there is evidence that precise tumor morphometry might lead to stronger predictive power for outcome measures, e.g., [3, 4], current interventional best practices assess the pre-operative tumor volume through measurement of the RECIST criteria [5, 6], McDonald criteria (i.e., largest tumor diameters)[4], and post-operative degree of resection via qualitative judgment. Notably, quantitative morphometry is not done on a large-scale in brain cancer.
Existing measures involve substantial human expertise and have not been the target of high-throughput automation as in computer aided diagnosis of mammography. Simply put, tumor cases tend to represent the extremes of abnormal brain formations. Therefore, standard automated methods from the neuroscience community (e.g., automated tissue classification [7, 8], sub-cortical parcellation [9, 10], voxel-based group statistics [11, 12], and cortical surface modeling [13, 14]) for morphometry in “near-normal” brains have not been validated to function reliably with cancer patients. There is ample opportunity to more fully characterize tumor morphometry (i.e., volume and shape) and evidence that more precise metrics might lead to stronger predictive power for outcome measures, e.g., [3]. The development of a rapid and reliable method to assess tumor volume would standardize radiographic assessment and allow for improved comparison between outcome and efficacy studies. Given the heterogeneous appearance of meningiomas, manual or semi-automated voxel-wise labeling is typically employed to assess tumor characteristics in research studies. Yet, qualified raters are a very limited resource given their extensive anatomical and imaging understanding.
We hypothesize that (1) high throughput tumor morphometry is possible through collaborative labeling and that (2) these measures would be more effective predictors of clinical outcomes than current metrics. The current research is investigating a novel, efficient alternative to manual labeling by expert raters and seeks to demonstrate the utility of this approach in the clinical assessment of menigoma. The proposed effort is the first application of our novel collaborative labeling system to interventional care. We posit that this system will enable large-scale, cost-effective assessment of the three-dimensional structure of malignant gliomas tumors. In this study, we specifically focus on tumors with “obvious” contrast relative that of surrounding tissue — time constraints are the primary deterrent to careful characterization of these structure. This manuscript presents preliminary results established in recent pilot study. This research will enable informed design of subsequent research to broaden the collaborative efforts and tackle labeling protocols for tumors with more subtle or intricate appearances.
2. METHODS
2.1 Data
Pre-operative T1-weighted and T2-weighted brain MRI scans based on varied (but standard of care) imaging protocols were obtained retrospectively for 108 patients with malignant gliomas in anonymous form under IRB approval. To enable subsequent fusion of T1 and T2 derived metrics, the T1 datasets were registered to the T2 datasets using a rigid body model. A representative healthy brain from the multi-parametric reproducibility study [15] was registered to each dataset using affine registration to provide a visual comparison.
To provide ground-truth labels, an experienced student manually labeled the datasets using an image-processing workstation and the NIH MIPAV software package [16].
2.2 Training
Herein, we assume that the raters have no prior experience with imaging or anatomy. As such, the anatomy of the brain and the characteristics of MRI images had to be presented to the raters so that they could rapidly become knowledgeable of the appearance of gliomas. We note that gliomas appears differently in T1 and T2 images – in T1 images the objective is to define the extent of any gadolinium enhancing regions corresponding to the tumor core, while, in T2 images the goal is to define the extent of both tumor and edema appearing as enhanced signal intensity.
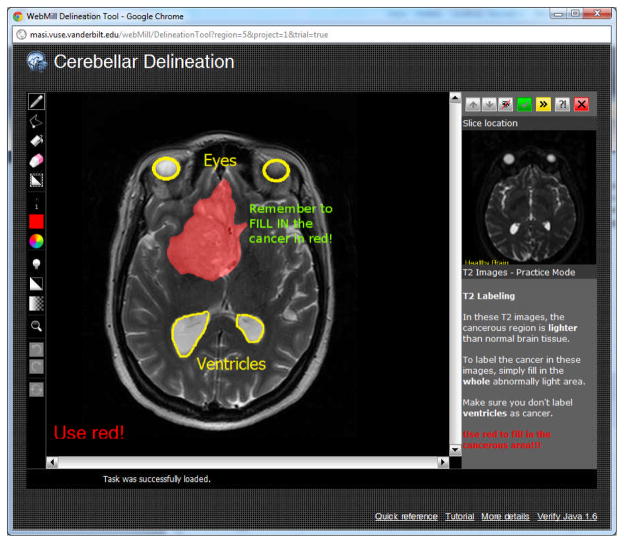
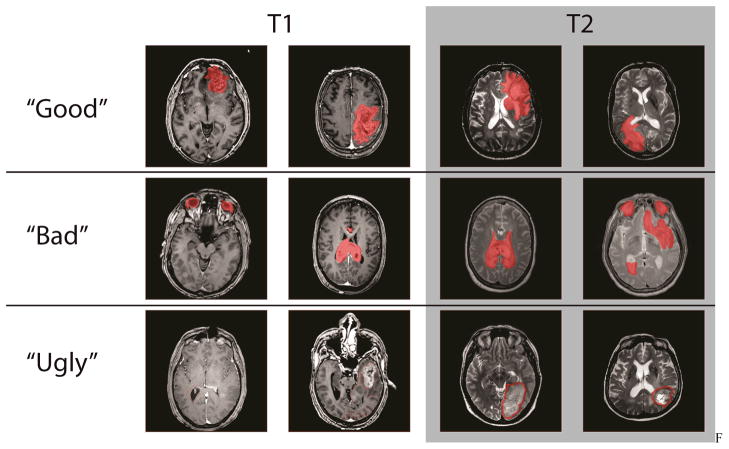
Upon logging into the system, users had the option of reading a brief one page training manual for each type of image. Users were then required to perform at least one practice labeling session. In the practice mode, the correct answer appeared after the user provided an answer. Preliminary experience showed that it was critical to provide spatial characteristics (e.g., correctly colored tumor areas) along with additional annotations. On the practice areas, large yellow marks and text highlighted features that were not cancer (e.g., eyes, ventricles, sinuses) as illustrated in Figure 2. Additionally, large bold text reminded users to use the correct label color for the tumor and to fill in the extent of the tumor. In a configuration study prior to these additional instructions, a substantial portion of raters (two of seven) systematically performed incorrect labels (e.g., “ugly” in Figure 3). In the presented study, no individual rater was consistently incorrect.
Figure 2.
Illustration of the WebMILL system run in training mode. In both training and final model, image labeling and display adjustment tools are shown to the left, while instructions and a comparative preview image are shown to the left. The user may view up and down one slice. In training mode, additional color overlays are presented (red, yellow, green text) after the user has complete her task.
Figure 3.
Figure 1. Observed rater behavior spanned the gamut of their observations. The good classification represents observations that are high quality observations given the original image slice. The bad classification represents observations where the rules were followed but the labeled images are not necessarily close to the ground truth. The ugly classification represents blatant rule breaking and observations that are inconsistent with the instructions.
2.3 Raters
In a two week period, 78 volunteers were recruited from the Vanderbilt campus student and staff populations via flyers. Compensation was set to campus minimum wage for up to 10 hours of participation with incentive bonuses paid to the top three volunteers in terms of total productivity (including both accuracy and number of datasets). In an initial ten minute face-to-face visit, volunteers were consented and walked through the process of signing up for a WebMILL account and using the system. After the introduction process, users had a basic understanding of what to label and how to label each area and completed the remainder of the study without supervision.
3. RESULTS
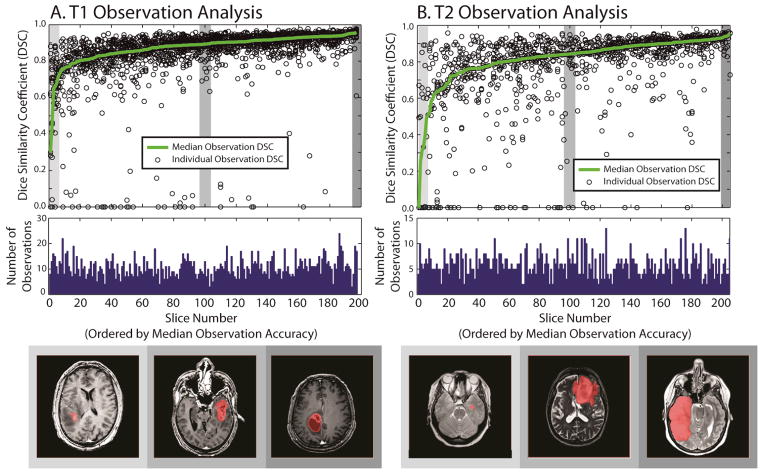
Herein, we report on preliminary results from this study. Thus far, the 78 individuals contributed 14,640 datasets on T1 labeling (111 hours 55 minutes) and 8,545 datasets on T2 labeling (68 hours 11 minutes) out of a total expected participation of approximately 500 hours based on historical retention rates. Median time per task was 17.8 seconds for T1 datasets and 19.0 seconds for T2 datasets. Raters used an average of 3.7 clicks and 8.0 seconds of coloring time for T1 and 3.2 clicks and 10.6 seconds of coloring time for T2. Datasets were compared to the results of an experienced rater based on Dice similarity [17] and plotted in Figure 2.
Figure 2.
Illustration of minimally rater performance relative to an experienced rater for T1 data (A) and T2 data (B). The top row shows 200 slices which have been expertly labeled sorted by the median overlap with minimally trained raters. The center row shows the number of times each slice has been labeled. The final row illustrates an arbitrary example from the lowest, median, and highest accuracy slices.
Preliminary statistical fusion was achieved on a slice-by-slice basis using majority vote and accuracy of the fused results was plotted in Figure 3. Evaluation of modern statistical fusion approaches is ongoing, e.g., [18–21]. To approximate what could be achieved with statistical fusion, weighted voting was evaluated with weights proportional to the true Dice similarity squared. We note that this is not a statistical fusion approach, but rather anecdotal evidence that statistical fusion using a measure of rater reliability can improve performance if rater accuracy could be measured. To emphasize this limitation, this method is labeled ideally weighted vote as opposed to an achievable weighted vote.
4. DISCUSSION
These preliminary results demonstrate that minimally trained raters can often accurately (>0.8 Dice similarity compared to an experienced rater) label the extent of malignant gliomas on T1 and T2 weighted MRI on a slice by slice basis. As expected, slices where rater behavior is poor tend to be on the boundary of the tumor where image intensities can be ambiguous. Nevertheless, even for these very difficult cases where the median accuracy was low, many individuals achieved accurate results.
For approximately 95% of T1 slices and 80% of T2 slices, majority vote was able to achieve high accuracy. Using information related to rater performance to form a weighted vote roughly halved the number of slices with sub-par performance. Hence, one could reasonably expect that statistical methods that account for variable rater performance would improve fused label sets over majority vote.
Here, we have shown evidence that inexperienced individuals can reliably identify and label major brain abnormalities with minimal labeling time per slice (<30 seconds). Yet, full collection and characterization of this dataset is ongoing. Early efforts at fusion show reasonable performance; however, full characterization of three-dimensional gliomas structure is still pending. Additionally, the complete study will enable us to address open problems in statistical fusion including characterizing temporal aspects of rater behavior and statistical fusion of nested structures.
Acknowledgments
This work was supported in part by NIH 1R21NS064534 (Prince/Landman). This work described herein has not been submitted elsewhere for publication or presentation.
References
- 1.Landman BA, Asman AJ, Scoggins AG, et al. Foibles, Follies, and Fusion: Web-Based Collaboration for Medical Image Labeling. NeuroImage. 2011 doi: 10.1016/j.neuroimage.2011.07.085. in press. [DOI] [PMC free article] [PubMed] [Google Scholar]
- 2.Sawaya R. Extent of resection in malignant gliomas: a critical summary. J Neurooncol. 1999;42(3):303–5. doi: 10.1023/a:1006167412835. [DOI] [PubMed] [Google Scholar]
- 3.Astner ST, Theodorou M, Dobrei-Ciuchendea M, et al. Tumor shrinkage assessed by volumetric MRI in the long-term follow-up after stereotactic radiotherapy of meningiomas. Strahlenther Onkol. 2010;186(8):423–9. doi: 10.1007/s00066-010-2138-x. [DOI] [PubMed] [Google Scholar]
- 4.Macdonald DR, Cascino TL, Schold SC, Jr, et al. Response criteria for phase II studies of supratentorial malignant glioma. J Clin Oncol. 1990;8(7):1277–80. doi: 10.1200/JCO.1990.8.7.1277. [DOI] [PubMed] [Google Scholar]
- 5.Therasse P, Eisenhauer EA, Verweij J. RECIST revisited: a review of validation studies on tumour assessment. Eur J Cancer. 2006;42(8):1031–9. doi: 10.1016/j.ejca.2006.01.026. [DOI] [PubMed] [Google Scholar]
- 6.Padhani AR, Ollivier L. The RECIST (Response Evaluation Criteria in Solid Tumors) criteria: implications for diagnostic radiologists. Br J Radiol. 2001;74(887):983–6. doi: 10.1259/bjr.74.887.740983. [DOI] [PubMed] [Google Scholar]
- 7.Pham D. Robust fuzzy segmentation of magnetic resonance images; Computer-Based Medical Systems, 2001 14th IEEE Symposium on; 2001. pp. 127–131. [Google Scholar]
- 8.Zhang Y, Smith S, Brady M. Segmentation of brain MR images through a hidden Markov random field model and the expectation maximization algorithm. IEEE Trans on Medical Imaging. 2001;20(1):45–57. doi: 10.1109/42.906424. [DOI] [PubMed] [Google Scholar]
- 9.Bazin PL, Pham DL. Topology-preserving tissue classification of magnetic resonance brain images. IEEE Trans Med Imaging. 2007;26(4):487–96. doi: 10.1109/TMI.2007.893283. [DOI] [PubMed] [Google Scholar]
- 10.Patenaude B, Smith S, Kennedy D, et al. FIRST - FMRIB’s integrated registration and segmentation tool. Chicago, IL: 2007. [Google Scholar]
- 11.Good CD, Johnsrude IS, Ashburner J, et al. A voxel-based morphometric study of ageing in 465 normal adult human brains. Neuroimage. 2001;14(1 Pt 1):21–36. doi: 10.1006/nimg.2001.0786. [DOI] [PubMed] [Google Scholar]
- 12.Davatzikos CA, Vaillant M, Resnick S, et al. Morphological analysis of brain structures using spatial normalization. Proc. Visualization in Biomedical Computing; Hamburg, Germany. 1996. [Google Scholar]
- 13.Tosun D, Rettmann ME, Han X, et al. Cortical surface segmentation and mapping. Neuroimage. 2004;23:S108–S118. doi: 10.1016/j.neuroimage.2004.07.042. [DOI] [PMC free article] [PubMed] [Google Scholar]
- 14.Dale AM, Fischl B, Sereno MI. Cortical surface-based analysis. I. Segmentation and surface reconstruction. Neuroimage. 1999;9(2):179–94. doi: 10.1006/nimg.1998.0395. [DOI] [PubMed] [Google Scholar]
- 15.Landman BA, Huang AJ, Gifford A, et al. Multi-parametric neuroimaging reproducibility: a 3-T resource study. Neuroimage. 2011;54(4):2854–66. doi: 10.1016/j.neuroimage.2010.11.047. [DOI] [PMC free article] [PubMed] [Google Scholar]
- 16.McAuliffe MJ, Lalonde FM, McGarry D, et al. Medical Image Processing, Analysis & Visualization in Clinical Research. Computer-Based Medical Systems, IEEE Symposium on; 2001. p. 0, 381. [Google Scholar]
- 17.Penney GP, Weese J, Little JA, et al. A comparison of similarity measures for use in 2-D-3-D medical image registration. IEEE Trans Med Imaging. 1998;17(4):586–95. doi: 10.1109/42.730403. [DOI] [PubMed] [Google Scholar]
- 18.Asman A, Landman B. Robust Statistical Label Fusion through Consensus Level, Labeler Accuracy and Truth Estimation (COLLATE); IEEE Transactions on Medical Imaging; 2011. [DOI] [PMC free article] [PubMed] [Google Scholar]
- 19.Warfield SK, Zou KH, Wells WM. Simultaneous truth and performance level estimation (STAPLE): an algorithm for the validation of image segmentation. IEEE Trans Med Imaging. 2004;23(7):903–21. doi: 10.1109/TMI.2004.828354. [DOI] [PMC free article] [PubMed] [Google Scholar]
- 20.Landman BA, Bogovic JA, Prince JL. Simultaneous Truth and Performance Level Estimation with Incomplete, Over-complete, and Ancillary Data. Proceedings - Society of Photo-Optical Instrumentation Engineers; 2010. p. 7623.p. 76231N. [DOI] [PMC free article] [PubMed] [Google Scholar]
- 21.Asman AJ, Landman BA. Characterizing Spatially Varying Performance to Improve Multi-Atlas Multi-Label Segmentation. International Conference on Information Processing in Medical Imaging; Irsee, Bavaria. 2011. [DOI] [PMC free article] [PubMed] [Google Scholar]


