Gas chromatography-mass spectrometry (GC-MS)-based global metabolomics requires complete chemical derivatization and matching of experimental spectra with those in various commercial or freely available databases in a high throughput manner.[1–6] Although several chemical methods have been developed for converting active functional groups in metabolites,[7, 8] the combination of methoxyamination and trimethylsilyation is one of the most widely used in global metabolomics studies.[6, 9] Recently, Agilent Technologies released the Fiehn GC-MS Metabolomics RTL (retention time locked) Library based on this derivatization approach. This library contains validated retention indices and spectra for 700 metabolites,[6] increasing the confidence of metabolite identifications in complex samples through the use of two independent parameters. However, multiple peaks could be formed from some specific molecules during the derivatization processes. Some of these peaks are partial TMS derivatives, while others are well-documented artifacts.[6, 10]
The artifact that we report in this letter was identified during a GC-MS-based study of metabolites secreted into culturing medium by human skin tissue after exposure to low doses of ionizing radiation. In these samples, we repeatedly detected a peak that was identified as a partial derivative of mimosine (‘mimosine 1’) based on mass spectrum database matching with the Agilent Fiehn Metabolomics RTL Library. Mimosine is a non-proteinaceous amino acid mainly found in plants and can arrest division of cell cycle.[11] The manufacturer of the culture medium confirmed that it contained no mimosine, this prompted us to further examine the possibility that this peak could be formed from other amino acids during sample processing. Therefore, we conducted a GC-MS-based analysis through de novo structural elucidation and comparison with authentic standards, in an attempt to identify the nature of this mimosine-derived peak.
The Epiderm FT human skin tissues and serum free tissue culturing media (EFT-400-MM, with Dulbecco’s Modified Eagle’s Medium as base medium) were purchased from MatTek Corporation (Ashland, MA). After 5 days of acclimation, the tissues were exposed to 0, 3 or 10 cGy of X-ray irradiation. The culturing media and tissues were collected separately 48 h after irradiation. Metabolites in the tissue culturing medium were extracted using a mono-phasic chloroform/methanol protocol. Briefly, 900 μL of chloroform/methanol (1:8, v/v, pre-chilled at -20°C) were added to 100 μL of medium. After vortex-mixing, the medium-solvent mixture was allowed to stand at 4°C for 15 min to facilitate the precipitation of proteins. Proteins were then removed by centrifugation at 16, 000 × g for 30 min, and the supernatant was collected into a deactivated screw-cap glass tube and evaporated to dryness using a vacuum concentrator.
For the derivatization, 20 μL of methoxyamine in pyridine (30 mg/mL) were added to each sample, followed by incubation at 37°C with shaking for 90 min to protect carbonyl groups. Next, 80 μL of N-methyl-N-(trimethylsilyl)trifluoroacetamide (MSTFA) with 1% trimethylchlorosilane (TMCS) were added to each vial, followed by incubation at 37°C with shaking for 30 min to derivatize hydroxyl and amine groups. The samples were then allowed to cool to room temperature and were analyzed by an Agilent GC 7890A coupled with a single quadrupole MSD 5975C mass spectrometer (Agilent Technologies, Santa Clara, CA). Separations were performed on a HP-5MS column (30 m × 0.25 mm × 0.25 μm; Agilent Technologies). The injection mode was splitless, and the injection port temperature was held at 250°C. The column oven was initially maintained at 60°C for 1 min and then ramped to 325°C by 10°C/min, followed by a 5 min hold at 325°C.
Data processing was carried out using Metabolite Detector to search against the Agilent Fiehn Metabolomics RTL Library by matching both mass spectra and retention indices.[12] In brief, the retention indices were first calculated based on the analysis of a mixture of fatty acid methyl esters (FAMEs),[13] then this retention indexing information was subsequently applied to the chromatographic analysis of each sample. The database matching was then conducted using the two parameters mentioned above.
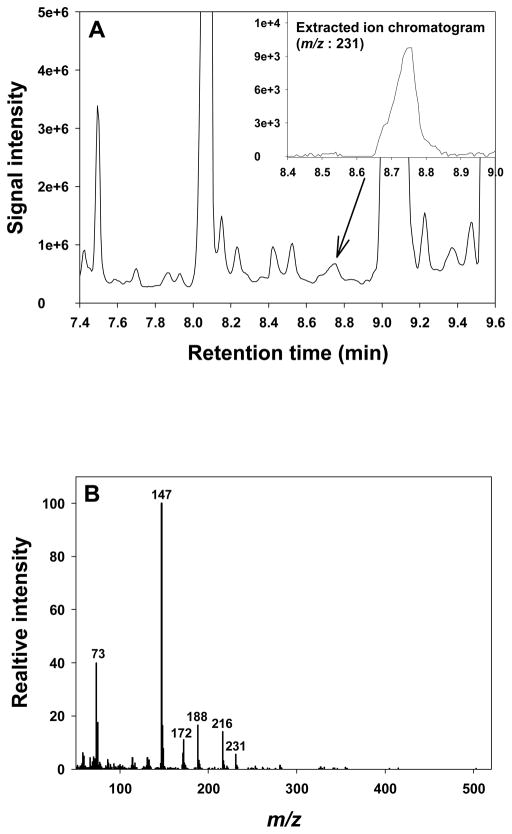
Subsequent data analysis resulted in the identification of a peak at 8.75 min as ‘mimosine 1’. Although this peak did not appear with high intensity in the total ion chromatogram (TIC) (Figure 1A), the extracted ion chromatogram of the molecular ion (m/z 231) indeed showed a symmetrical peak at 8.75 min (Figure 1A). Importantly, the mass spectrum of this peak (Figure 1B) matched the spectrum of ‘mimosine 1’ in the Fiehn Metabolomics RTL Library with a matching score of 96%. Furthermore, this peak appeared in all culturing medium samples, regardless of whether it was a control or irradiated sample.
Figure 1. GC-MS analysis of skin tissue culture medium.
(A) The total ion chromatogram of the skin tissue culture medium is shown at the selected retention time range of 7.4 to 9.6 min, with the extracted ion chromatogram of 231 m/z in the top right corner. (B) The mass spectrum of the selected peak at the given retention time.
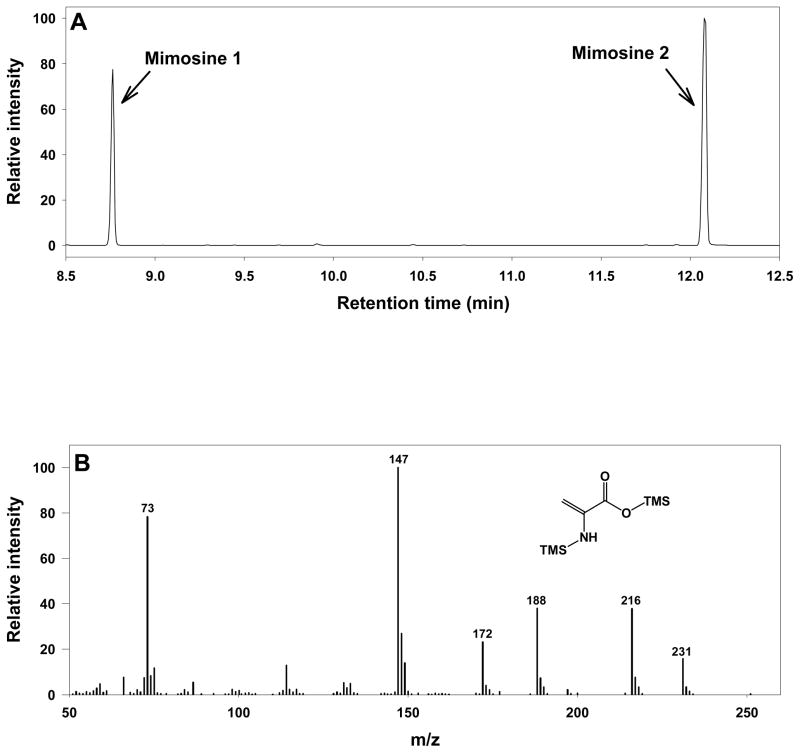
When the mimosine standard (Sigma-Aldrich, St. Louis, MO) was derivatized and analyzed in the same way, two peaks were detected at different retention times (8.8 and 12.2 min) and individually annotated as ‘mimosine 1’ and ‘mimosine 2’ after matching to the Fiehn Metabolomics RTL Library (Figure 2A). However, these two peaks were not annotated in the library with any information regarding their chemical identities except the retention indices and number of trimethylsilyated (TMS) groups (‘mimosine 1’-2TMS and ‘mimosine 2’-1TMS). Therefore, an independent spectrum match was conducted with the NIST08 GC-MS library using Agilent ChemStation software, but without success. Interestingly, the peak ratios of ‘mimosine 1’ and ‘mimosine 2’ were found to be consistent at 0.8 when different amounts (25, 50, 100, and 250 mg/L) of mimosine were analyzed, and no other new peaks appeared in the chromatograms when the amount of sample injected was changed. This result indicated that mimosine was completely cleaved into two molecules before the start of gas chromatographic separation. Therefore, it was proposed that the cleavage was either a chemical reaction that occurred in solution during the derivatization process or a thermal decomposition process during the vaporization step within the GC inlet. In the latter case, ‘mimosine 1’ and ‘mimosine 2’ are expected to appear together regardless of inlet temperature as long as the inlet temperature is high enough to cleave the derivatized mimosine and to subsequently vaporize both products.
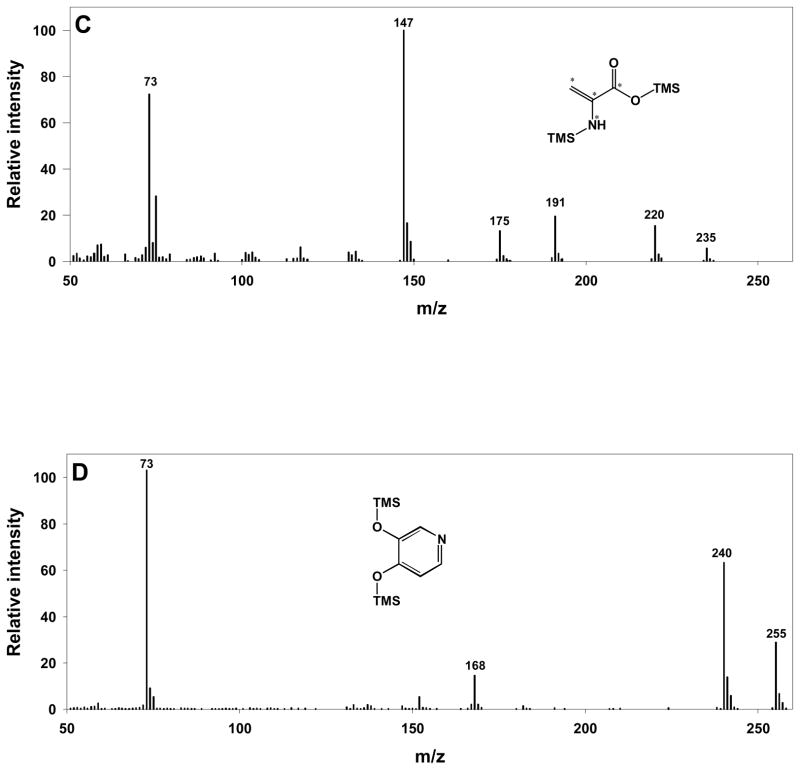
Figure 2. GC-MS analysis of mimosine standard and mass spectra of mimosine 1 and 2.
(A) The chromatogram obtained from analysis of mimosine standard showed two peaks at 8.8 and 12.2 min. Other trace peaks were identified as materials from column bleeding. (B) The mass spectrum of ‘mimosine 1’ peak – TMS derivative of dehydroalanine. (C) The mass spectrum of uniformly labeled (13C, 15N) dehydroalanine produced from derivatization of uniformly labeled cysteine. The asterisks mark the isotopic labeled atoms on those positions. (D) The mass spectrum of 3,4-dihydroxypyridine standard, which was identical to the ‘mimosine 2’ peak eluted at 12.2 min.
When the inlet temperature was varied from 60°C to 280°C, these two peaks continued to appear together until the inlet temperature was maintained at 60°C or lower, at which point only the ‘mimosine 1’ peak appeared. This indicated that ‘mimosine 2’ was not vaporized in the inlet when the samples were injected at low temperatures and that the decomposition of mimosine most likely occurred during the chemical derivatization step. To confirm this, we analyzed samples of derivatized mimosine using UV/Vis spectroscopy and proton NMR. However, because the concentration of MSTFA in the derivatization mixture is high and it has strong UV absorbance, derivatized mimosine was not detectable. Similarly, NMR analysis was inconclusive because the derivatized molecules were not stable in the deuterated methanol and water solvents.
Mimosine is categorized as a tyrosine analogue based on its structural similarity to this amino acid.[14] Therefore, a derivatized tyrosine standard was analyzed by GC-MS, and two peaks appeared and were identified as tyrosine-2TMS and tyrosine-3TMS by matching with the Fiehn Metabolomics RTL Library. However, the retention times of these two peaks were 17.3 and 17.9 min, respectively. If the partial derivatives of mimosine were generated without any decomposition, then they would be expected to share similar retention times. However, no peaks were observed within that retention time range or corresponding to the calculated molecular weights of the 2 or 3TMS derivatives of intact mimosine. Avery suggested the possibility of beta-elimination during derivatization of mimosine, but no clear interpretation on the formation of the products of this reaction was given.[15] Although Hegarty and co-workers have demonstrated ready hydrolysis of mimosine to 3,4-dihydroxypyridine by boiling in 0.1 N hydrochloric acid (HCl),[16] this result was not observed in GC analysis of mimosine after esterification and acylation, even though mimosine was subjected to heat in the initial drying of an aliquot extracted in 0.1 N HCl medium.[14] Therefore, a de novo structural elucidation was performed on ‘mimosine 1’ by inspecting its fragmentation pattern, and this peak was tentatively identified as a 2TMS derivative of dehydroalanine (Figure 2B). The signals of 73 and 147 m/z originated from TMS groups during the electron impact ionization, and the odd mass of the parent ion (231 m/z) indicated the presence of an odd number of nitrogen atoms. Even though no unmodified dehydroalanine standard was commercially available, the tentative identification of ‘mimosine 1’ as dehydroalanine was further confirmed when its mass spectrum was compared with uniformly isotope-labeled dehydroalanine, which was generated from derivatization of uniformly labeled cysteine (Figure 2C).
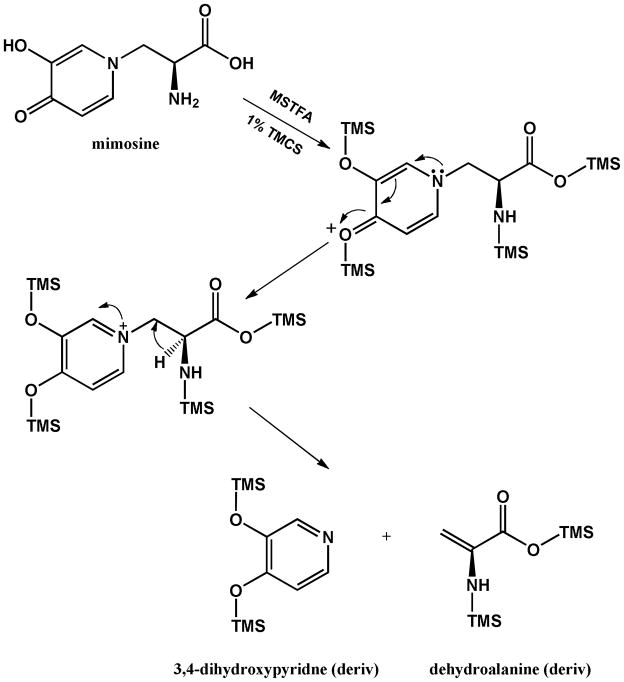
For ‘mimosine 2’, the parent ion with m/z 255, its demethylated form at m/z 240, and TMS m/z 73 implied the presence of one nitrogen atom and TMS derivatization. Since there were only two peaks associated with the mimosine standard, we proposed that ‘mimosine 2’ was the fragment of mimosine after losing dehydroalanine. In this respect, both 3-hydroxypyridin-4(1H)-one and 3,4-dihydroxypyridine were potential structures for this peak. Subsequent evaluation of a 3,4-dihydroxypyridine standard (Tyger Scientific, Inc., Ewing, NJ) showed identical retention time and mass spectrum with ‘mimosine 2’ (Figure 2D). This result is consistent with our observation that the cleavage of mimosine was not affected by the presence or absence of the methoxyamination step during a step-wise evaluation of the derivatization procedure, indicating that there are no active carbonyl groups in the structure of ‘mimosine 2’. The proposed reaction pathway for the decomposition of mimosine into dehydroalanine and 3,4-dihydroxypyridine is shown in Figure 3.
Figure 3.
The proposed pathway for the cleavage of mimosine during sample derivatization.
Because there was no peak of ‘mimosine 2’ in any of our tissue culturing medium samples, our findings suggested that the dehydroalanine detected in the human skin culture medium (the peak of ‘mimosine 1’) could be generated from other amino acids. To identify the potential sources of dehydroalanine, we analyzed eight amino acids (Sigma-Aldrich) with the potential to decompose into dehydroalanine using the same GC-MS sample derivatization and analysis method. No dehydroalanine was observed at the expected retention time (8.8 min) in the analyses of derivatized L-tyrosine, L-arginine, L-aspartic acid, L-serine, L-threonine, L-methionine, and L-glutamine. However, when cysteine was derivatized and analyzed, we observed a peak with the same retention time and mass spectrum as dehydroalanine. Furthermore, the peak intensity of dehydroalanine is linearly correlated with the amount of cysteine prepared and analyzed, and it appeared that the formation of dehydroalanine depends on the buffer used to dissolve cysteine, with ~25% conversion when deionized water was used and only up to 2% if phosphate buffered saline was used.
Similar to mimosine, it was reported that dehydroalanine can be derived from cysteine residues in proteins in the presence of heat and under alkaline conditions via a beta-elimination process.[17, 18] In order to further confirm the formation of dehydroalanine, unlabeled amino acids and uniformly isotope-labeled (13C, 15N) amino acid mixtures (Cambridge Isotope Laboratories, Andover, MA) were individually analyzed and dehydroalanine was again observed at 8.8 min. Because cysteine was uniformly labeled with 13C and 15N, each peak in the mass spectrum of dehydroalanine was shifted according to the locations of isotopically labeled atoms (Figure 2C). As we have confirmed with the provider (MatTek) that the medium used contains essential amino acids including cystine but no mimosine (personal communication), our results suggested that the peak identified as ‘mimosine 1’ was dehydroalanine formed by cysteine/cystine (cysteine is easily oxidized to cystine – a dimer of cysteine – and they are sometimes interconvertible depending on conditions[19]) rather than mimosine.
In conclusion, mimosine was found to decompose to dehydroalanine and 3,4-dihydroxypyridine after chemical derivatization with methoxyamine and MSTFA and analysis by GC-MS. Dehydroalanine can also be generated from cysteine under the same derivatization and analysis conditions. Based on these findings, caution should be taken when interpreting GC-MS-based metabolomics data because degradation products may form during sample processing and analysis, particularly for amino acids. Confident identification and quantification of mimosine in GC-MS based metabolomics requires co-presence of dehydroalanine and 3,4-dihydroxypyridine peaks at a certain ratio (0.8 under our experimental conditions). A lack of either dehydroalanine (the ‘mimosine 1’ peak in the Agilent Fiehn Metabolomics Library) or 3,4-dihydroxypyridine peak (the ‘mimosine 2’ peak) indicates that there is no mimosine in the sample.
Acknowledgments
This work was supported by the Office of Science, U.S. Department of Energy, under the Low Dose Radiation Research Program. Additional support for portions of this work was provided by the National Institute of Allergy and Infectious Diseases (Award Number U54AI081680 and Interagency agreement Y1-AI-8401). Work was performed at the Environmental Molecular Sciences Laboratory, a national scientific user facility sponsored by the Department of Energy’s Office of Biological and Environmental Research and located at Pacific Northwest National Laboratory (PNNL) in Richland, Washington. PNNL is a multi-program national laboratory operated by Battelle for the DOE under Contract DE-AC05-76RLO 1830.
References
- 1.Stein SE, Pierre A, Lias SG. Journal of the American Society for Mass Spectrometry. 1991;2:441. doi: 10.1016/1044-0305(91)85012-U. [DOI] [PubMed] [Google Scholar]
- 2.Ausloos P, Clifton CL, Lias SG, Mikaya AI, Stein SE, Tchekhovskoi DV, Sparkman OD, Zaikin V, Zhu D. J Am Soc Mass Spectrom. 1999;10:287. doi: 10.1016/S1044-0305(98)00159-7. [DOI] [PubMed] [Google Scholar]
- 3.Schauer N, Steinhauser D, Strelkov S, Schomburg D, Allison G, Moritz T, Lundgren K, Roessner-Tunali U, Forbes MG, Willmitzer L, Fernie AR, Kopka J. FEBS Letters. 2005;579:1332. doi: 10.1016/j.febslet.2005.01.029. [DOI] [PubMed] [Google Scholar]
- 4.Kopka J, Schauer N, Krueger S, Birkemeyer C, Usadel B, Bergmüller E, Dörmann P, Weckwerth W, Gibon Y, Stitt M, Willmitzer L, Fernie AR, Steinhauser D. Bioinformatics. 2005;21:1635. doi: 10.1093/bioinformatics/bti236. [DOI] [PubMed] [Google Scholar]
- 5.Halket JM, Waterman D, Przyborowska AM, Patel RKP, Fraser PD, Bramley PM. Journal of Experimental Botany. 2005;56:219. doi: 10.1093/jxb/eri069. [DOI] [PubMed] [Google Scholar]
- 6.Kind T, Wohlgemuth G, Lee DY, Lu Y, Palazoglu M, Shahbaz S, Fiehn O. Analytical Chemistry. 2009;81:10038. doi: 10.1021/ac9019522. [DOI] [PMC free article] [PubMed] [Google Scholar]
- 7.Garcia A, Barbas C. Methods in Molecular Biology. 2011;708:191. doi: 10.1007/978-1-61737-985-7_11. [DOI] [PubMed] [Google Scholar]
- 8.Roessner U, Wagner C, Kopka J, Trethewey RN, Willmitzer L. Plant Journal. 2000;23:131. doi: 10.1046/j.1365-313x.2000.00774.x. [DOI] [PubMed] [Google Scholar]
- 9.Kanani HH, Klapa MI. Metabolic Engineering. 2007;9:39. doi: 10.1016/j.ymben.2006.08.001. [DOI] [PubMed] [Google Scholar]
- 10.Little JL. Journal of Chromatography A. 1999;844:1. doi: 10.1016/s0021-9673(99)00267-8. [DOI] [PubMed] [Google Scholar]
- 11.Hughes TA, Cook PR. Experimental Cell Research. 1996;222:275. doi: 10.1006/excr.1996.0035. [DOI] [PubMed] [Google Scholar]
- 12.Hiller K, Hangebrauk J, Jager C, Spura J, Schreiber K, Schomburg D. Analytical Chemistry. 2009;81:3429. doi: 10.1021/ac802689c. [DOI] [PubMed] [Google Scholar]
- 13.Kováts E. Helvetica Chimica Acta. 1958;41:1915. [Google Scholar]
- 14.Mee JML, Brooks CC. Journal of Chromatography A. 1971;62:141. doi: 10.1016/s0021-9673(01)96822-0. [DOI] [PubMed] [Google Scholar]
- 15.Avery ME. Tree Physiology. 1993;12:23. doi: 10.1093/treephys/12.1.23. [DOI] [PubMed] [Google Scholar]
- 16.Hegarty M, Court R, Thorne P. Australian Journal of Agricultural Research. 1964;15:168. [Google Scholar]
- 17.Bar-Or R, Rael LT, Bar-Or D. Rapid Communications in Mass Spectrometry. 2008;22:711. doi: 10.1002/rcm.3421. [DOI] [PubMed] [Google Scholar]
- 18.Kim JS, Kim HJ. Rapid Communications in Mass Spectrometry. 2001;15:2296. doi: 10.1002/rcm.509. [DOI] [PubMed] [Google Scholar]
- 19.Segal S, Crawhall JC. Biochemical Medicine. 1967;1:141. [Google Scholar]


