

Abstract
Purpose
To measure the in vivo longitudinal relaxation time T1 of GABA at 3T.
Materials and Methods
J-difference edited single-voxel magnetic resonance spectroscopy was used to isolate GABA signals. An increased echo time (80 ms) acquisition was used, accommodating the longer, more selective editing pulses required for symmetric editing-based suppression of co-edited macromolecular signal. Acquiring edited GABA measurements at a range of relaxation times in ten healthy participants, a saturation-recovery equation was used to model the integrated data.
Results
The longitudinal relaxation time of GABA was measured as T1,GABA = 1.31 ± 0.16 s.
Conclusion
The method described has been successfully applied to measure the T1 of GABA in vivo at 3T.
Keywords: GABA, MRS, 3T, MEGA-PRESS, T1 relaxation, macromolecules
INTRODUCTION
Proton magnetic resonance spectroscopy (MRS) is a methodology that allows the in vivo detection of endogenous metabolites in the human body. The inhibitory neurotransmitter GABA is present in the brain at low millimolar levels, and it is therefore possible to measure GABA concentration with MRS, usually by tailoring the MRS experiment to isolate GABA signals from other stronger, overlapping signals from other molecules in the spectrum. The most widely used method for doing this is MEGA-PRESS (1), a J-difference editing technique. J-difference editing works by using frequency-selective RF pulses (`editing' pulses) to modulate the evolution of known couplings in a target molecule – in the case of GABA, the coupling between spins at 1.9 ppm and spins at 3 ppm.
As a relatively robust and easily implemented methodology, GABA-edited MRS is now being widely applied in clinical and basic neuroscience (2). GABA-edited MRS has been applied to a range of psychiatric, neurological and developmental disorders, including schizophrenia, major depressive and bipolar disorders, panic disorder, epilepsy, and attention-deficit hyperactivity disorder (2). In healthy subjects, studies have been carried out that relate GABA to individual variability in behavior (3,4), character traits (5), underlying neurophysiology of neuronal activity (6,7), and cortical plasticity (8). The measurement of in vivo relaxation times is an important pre-requisite for measuring absolute concentration, which will greatly enhance the site-to-site and scanner-to-scanner comparability of quantitative results.
The edited GABA signal acquired using MEGA-PRESS at 3 T usually suffers from a significant contamination due to co-edited macromolecular (MM) signals (1). This occurs because MM signals at 3 ppm are coupled to MM signals at 1.7 ppm that are affected by editing pulses applied at 1.9 ppm. It is possible to limit the amount of MM signal in the difference spectrum by placing editing pulses symmetrically around MM spins at 1.7 ppm (9), so that both editing pulses affect the MM signal equally, and it does not appear in the difference spectrum. Having separated the edited GABA signal from co-edited MM signals, it is possible to measure the relaxation times of GABA signals in vivo. In a recent paper, the transverse relaxation time (T2) of the edited GABA signal (10) was measured; in this current study we apply a saturation-recovery (multi-TR) approach to measure the longitudinal relaxation time of edited GABA signals T1,GABA.
MATERIALS AND METHODS
All experiments were performed on a 3T MR scanner (Philips `Achieva', Best, The Netherlands) using the body coil for transmit and an eight-channel head coil for receive. In the human brain, measurements were made from a (3.5 cm)3 region in the mesial parietal lobe (Figure 1a). J-difference edited GABA MRS was acquired in a phantom and in vivo, using the MEGA-PRESS sequence to selectively edit GABA. In ON experiments, editing pulses are applied to the GABA spins at 1.9 ppm to selectively refocus the evolution of couplings to spins at 3 ppm. In the OFF experiment, these couplings are allowed to evolve for the duration of the echo time. The difference between these two subsets only contains those signals that are affected by the editing pulse at 1.9 ppm, including the 3 ppm GABA signal, thus reducing the information content along the crowded chemical shift axis.
Figure 1.

J-difference editing was applied to measure the in vivo T1 of GABA. a) The (3.5 cm)3 voxel was positioned in each subject with the midline parietal geometry shown. b) The MEGA-PRESS pulse sequence is shown – TE was increased to 80 ms in order to accommodate 20 ms editing pulses; co-edited MM signal was suppressed by applying editing pulses at 1.9 and 1.5 ppm in ON and OFF scans respectively.
A typical MEGA-PRESS experiment for the detection of GABA might use a TE of 68 ms and editing pulses of duration 14 ms. In the following experiments we use a TE of 80 ms to allow for longer, more frequency-selective editing pulses of 20 ms (11). In vivo, symmetrical, editing-based suppression of co-edited MM (10) was used with editing pulses positioned at 1.9 (ON) and 1.5 ppm (OFF); the pulse sequence is shown in Figure 1b. Data were acquired with the following parameters: CHESS water suppression; B1,max 13.5 uT; slice-selective excitation and refocusing bandwidth 2.3 kHz and 1.4 kHz respectively; 1024 datapoints sampled at 2 kHz to give an acquisition duration of approximately 0.5 s. The chemical shift displacements between the 3 ppm and 1.9 ppm spins in the excitation and refocusing directions are 6% and 10% respectively. The bandwidth (full width at half maximum inversion - FWHM) of the 20 ms editing pulses pulses is 53 Hz (compared to the 76 Hz of 14 ms pulses).
Phantom Experimental
A one-liter phantom containing 10 mM GABA in phosphate-buffered saline solution was used. J-difference edited GABA MRS was acquired at five different repetition times (TR = 1s, 2s, 3s, 5s and 10s) with 64 averages per TR.
In Vivo Experimental
10 healthy participants (5 female; aged 35.4 ± 8.8 years) were scanned. All participants gave written informed consent and the study was approved by the local institutional review board. J-difference edited GABA MRS was acquired at four TRs (1s, 2s, 3s and 5s) for each participant with 256 averages per TR.
Data Analysis
All MR spectra were processed in csx3 (available from http://http://godzilla.kennedykrieger.org/csx). Data were zero-filled to 8k points and exponential line broadening of 3 Hz was applied. Difference spectra were calculated from the interleaved data using the spatial Fourier transform function. GABA-edited difference spectra tend to show relatively flat baseline, however, minor baseline correction is appropriate, as seen in the typical example in Figure 2. A two-point linear baseline correction was applied to the baseline either side of the edited GABA signal which was then integrated between 2.8 and 3.2 ppm. In the in vivo spectra, N-acetyl aspartate (NAA), creatine (Cr) and choline (Cho) signals were integrated in the sum spectrum.
Figure 2.
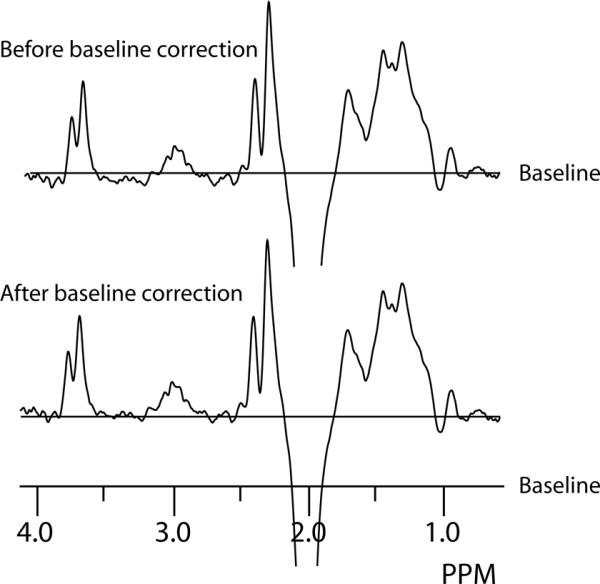
Baseline correction of a typical in vivo edited spectrum.
Assuming mono-exponential longitudinal relaxation, the TR-dependence of the signal can be described by:
| [1] |
where S(TR) is the integral at a given TR, S0 is an amplitude scaling factor (corresponding to the signal acquired at infinite TR), and T1 is the longitudinal relaxation time constant to be measured. This equation was implemented within a non-linear fitting algorithm (nlinfit) in Matlab with S0 and T1 as variable parameters.
Integrals at a range of TRs were fitted separately for each participant. The mean and standard deviation of T1 values across individuals were calculated.
RESULTS
Phantom spectra for each TR are shown in Figure 3a. These show increased prominence of the central peak of the multiplet at 80 ms compared to 68ms (note that this is not a subtraction error, but rather an expected behavior of the multiplet at this echo time). Fitting of the integrals of these signals is shown in Figure 3b. The fitted T1 relaxation time for edited GABA signal T1,GABA in the phantom is 2.77 ± 0.22 s.
Figure 3.

Analysis of phantom data. a) GABA-Edited spectra acquired at a range or TRs. The edited 3 ppm signal increases in intensity with increasing TR, as expected. Note that the edited lineshape is different at a TE of 80 ms to that seen with TE = 68ms, with a markedly greater contribution from the central peak. b) The integrals of this series can be fit using the model in Equation 1 to give T1 = 2.77 s. The normalised integral values at each TR are shown as open circles, the fitted model as a solid line, and the asymptote as a dashed line.
Figure 4a shows the difference spectra for each TR for a single participant, clearly showing an increase in the GABA signal at 3 ppm with increasing TR and longitudinal relaxation. The lineshape of these spectra, although somewhat variable due to noise and subtraction artefacts, is consistent with the broadened phantom spectrum shown. Figure 4b shows the normalised GABA integral for each TR - S(TR)/S0, overlaid with the fitted T1 relaxation curve for all 10 participants. The in vivo T1,GABA average to T1,GABA = 1.31 ± 0.16 s, a coefficient of variation of approximately 12%. Additionally, the TR-dependency of NAA, Cr and Cho integrals from the sum spectra was modelled using Equation [1] giving values of T1,NAA = 1.51 ± 0.25 s, T1,Cr = 1.51 ± 0.16 s, T1,Cho = 1.26 ± 0.12 s.
Figure 4.

In vivo Results. a) Edited signal can be seen at 3 ppm at all TR values; data for a typical subject are shown. The lineshape of these spectra appears to be consistent with the phantom spectrum shown (to which an additional 7Hz exponential line broadening has been applied compared to the spectra in Figure 3). b) The integrals of this series were fit for all subjects using the model in Equation 1. Plots show the fitted model (solid line) and individual normalised integral values (open circles) for each subject; the dashed line shows the asymptote.
DISCUSSION
In this paper, a multiple-TR method to determine the T1-value of the edited GABA signal was used both in a phantom and in vivo in the brain with macromolecular suppression at a field strength of 3 T. The value of T1 = 1.31 s may be used in future work to determine the absolute GABA concentration in vivo. Being able to validate absolute GABA concentration will provide a more quantitative measure of GABA, as well as allowing for more direct comparison of GABA concentration across studies and research sites.
There are three main approaches that can be used for T1 measurements: inversion recovery; saturation recovery; and variable flip angle approaches. The multiple-TR approach here is a saturation recovery experiment. This approach was chosen because the range of achievable inversion times (TI) for an inversion recovery experiment is restricted by the timing of presaturation water suppression (CHESS). Similarly the variable-flip-angle experiment was rejected due to concerns that the excitation profile changes when the amplitude of slice-selective pulses is altered. The relatively small variation in T1,GABA values found between individuals (approximately 12%) supports the approach chosen; the largest source of the remaining variability is likely to be the uncertainty in integration of in vivo data with an imperfectly defined baseline.
To our knowledge, there have been no previous reports of GABA longitudinal relaxation times at 3T. The measured T1,GABA of 1.31 s is within the range found for other metabolites - Ethofer et al. show T1 values at 3 T ranging from 0.91 s for occipital white-matter myoinositol to 1.57 s for thalamic NAA (12). The relaxation times for NAA, Cr and Cho determined from the sum spectra lie within error of previously published values measured using inversion recovery (12,13). Other studies have suggested that metabolites show different relaxation times in white matter (WM) and gray matter (GM; generally T1 is shorter in WM than GM) (12,13), therefore it is possible that differences in voxel composition between subjects may contribute some of the observed variability of the current GABA T1 measurements.
A symmetrical, editing-based suppression of co-edited MM signals was used to limit the amount of MM contamination of the GABA peak at 3ppm. This method has not been widely applied at 3T, mainly due to the restriction on editing pulse selectivity that is imposed by using a TE of 68 ms (14). By increasing the TE, our current study has shown that it is possible to acquire good quality spectra without subtracting away all GABA signal (an alternative approach taken to that in (15)). Thus the measured T1GABA is largely uncontaminated by short-T1 MM signal. The difference in T1 values between GABA and MM forms the basis of another method for removing the MM contamination - that is, the acquisition of a GABA nulled MM-only spectrum (1). This method has previously been implemented based upon an assumed value for T1,GABA at 3 T (e.g. 1.1s in (11) and 1.4 s in (16)).
In conclusion, symmetrical, editing-based suppression of co-edited MM signals has been applied at 3T by increasing TE to 80 ms. This has been done in order to detect pure GABA signal for the purposes of determining the in vivo longitudinal relaxation time T1,GABA. The measured value of 1.31 seconds can be used for absolute quantification of GABA signals and to determine the inversion times for MM-only experiments.
Acknowledgements
This work was funded in part by NIH grants P41 EB015909 and R21 NS077300. NAJP holds an Autism Speaks Translational Postdoctoral Fellowship.
Grant Support: NIH; Grant number: P41 EB015909 and R21 NS077300.
References
- 1.Mescher M, Merkle H, Kirsch J, Garwood M, Gruetter R. Simultaneous in vivo spectral editing and water suppression. NMR Biomed. 1998;11(6):266–272. doi: 10.1002/(sici)1099-1492(199810)11:6<266::aid-nbm530>3.0.co;2-j. [DOI] [PubMed] [Google Scholar]
- 2.Puts NAJ, Edden RAE. In vivo magnetic resonance spectroscopy of GABA: A methodological review. Prog NMR Spect. 2012;60:29–41. doi: 10.1016/j.pnmrs.2011.06.001. [DOI] [PMC free article] [PubMed] [Google Scholar]
- 3.Boy F, Evans CJ, Edden RA, Singh KD, Husain M, Sumner P. Individual differences in subconscious motor control predicted by GABA concentration in SMA. Curr Biol. 2011;20(19):1779–1785. doi: 10.1016/j.cub.2010.09.003. [DOI] [PMC free article] [PubMed] [Google Scholar]
- 4.Puts NA, Edden RA, Evans CJ, McGlone F, McGonigle DJ. Regionally specific human GABA concentration correlates with tactile discrimination thresholds. J Neurosci. 2011;31(46):16556–16560. doi: 10.1523/JNEUROSCI.4489-11.2011. [DOI] [PMC free article] [PubMed] [Google Scholar]
- 5.Boy F, Evans CJ, Edden RA, et al. Dorsolateral prefrontal gamma-aminobutyric acid in men predicts individual differences in rash impulsivity. Biol Psychiatry. 2011;70(9):866–872. doi: 10.1016/j.biopsych.2011.05.030. [DOI] [PMC free article] [PubMed] [Google Scholar]
- 6.Gaetz W, Edgar JC, Wang DJ, Roberts TP. Relating MEG measured motor cortical oscillations to resting gamma-aminobutyric acid (GABA) concentration. Neuroimage. 2011;55(2):616–621. doi: 10.1016/j.neuroimage.2010.12.077. [DOI] [PMC free article] [PubMed] [Google Scholar]
- 7.Muthukumaraswamy SD, Evans CJ, Edden RA, Wise RG, Singh KD. Individual variability in the shape and amplitude of the BOLD-HRF correlates with endogenous GABAergic inhibition. Hum Brain Mapp. 2012;33(2):455–465. doi: 10.1002/hbm.21223. [DOI] [PMC free article] [PubMed] [Google Scholar]
- 8.Stagg CJ, Wylezinska M, Matthews PM, et al. Neurochemical effects of theta burst stimulation as assessed by magnetic resonance spectroscopy. J Neurophysiol. 2009;101(6):2872–2877. doi: 10.1152/jn.91060.2008. [DOI] [PMC free article] [PubMed] [Google Scholar]
- 9.Henry PG, Dautry C, Hantraye P, Bloch G. Brain GABA editing without macromolecule contamination. Magn Reson Med. 2001;45(3):517–520. doi: 10.1002/1522-2594(200103)45:3<517::aid-mrm1068>3.0.co;2-6. [DOI] [PubMed] [Google Scholar]
- 10.Edden RA, Intrapiromkul J, Zhu H, Cheng Y, Barker PB. Measuring T2 in vivo with J-difference editing: Application to GABA at 3 Tesla. J Magn Reson Imaging. 2011;35(1):229–234. doi: 10.1002/jmri.22865. [DOI] [PMC free article] [PubMed] [Google Scholar]
- 11.Edden RA, Puts NAJ, Barker PB. Macromolecule-suppressed GABA-Edited Magnetic Resonance Spectroscopy at 3T. Magn Reson Med. doi: 10.1002/mrm.24391. in press; 10.1002/mrm.24391. [DOI] [PMC free article] [PubMed] [Google Scholar]
- 12.Ethofer T, Mader I, Seeger U, et al. Comparison of longitudinal metabolite relaxation times in different regions of the human brain at 1.5 and 3 Tesla. Magn Reson Med. 2003;50(6):1296–1301. doi: 10.1002/mrm.10640. [DOI] [PubMed] [Google Scholar]
- 13.Mlynarik V, Gruber S, Moser E. Proton T (1) and T (2) relaxation times of human brain metabolites at 3 Tesla. NMR Biomed. 2001;14(5):325–331. doi: 10.1002/nbm.713. [DOI] [PubMed] [Google Scholar]
- 14.Evans CJ, McGonigle DJ, Edden RA. Diurnal stability of gamma-aminobutyric acid concentration in visual and sensorimotor cortex. J Magn Reson Imaging. 2010;31(1):204–209. doi: 10.1002/jmri.21996. [DOI] [PubMed] [Google Scholar]
- 15.Near J, Simpson R, Cowen P, Jezzard P. Efficient γ-aminobutyric acid editing at 3T without macromolecule contamination: MEGA-SPECIAL. NMR Biomed. 2011;24(10):1277–85. doi: 10.1002/nbm.1688. [DOI] [PubMed] [Google Scholar]
- 16.Bhagwagar Z, Wylezinska M, Jezzard P, et al. Reduction in occipital cortex gamma-aminobutyric acid concentrations in medication-free recovered unipolar depressed and bipolar subjects. Biol Psychiatry. 2007;61(6):806–812. doi: 10.1016/j.biopsych.2006.08.048. [DOI] [PubMed] [Google Scholar]