Abstract
In this work, we present a new MR spectroscopy approach for directly observing nuclear spins that undergo exchange, metabolic conversion, or, generally, any frequency shift during a mixing time. Unlike conventional approaches to observe these processes, such as exchange spectroscopy (EXSY), this rapid approach requires only a single encoding step and thus is readily applicable to hyperpolarized MR in which the magnetization is not replenished after T1 decay and RF excitations. This method is based on stimulated-echoes and uses phase-sensitive detection in conjunction with precisely chosen echo times in order to separate spins generated during the mixing time from those present prior to mixing. We are calling the method Metabolic Activity Decomposition Stimulated-echo Acquisition Mode or MAD-STEAM. We have validated this approach as well as applied it in vivo to normal mice and a transgenic prostate cancer mouse model for observing pyruvate-lactate conversion, which has been shown to be elevated in numerous tumor types. In this application, it provides an improved measure of cellular metabolism by separating [1-13C]-lactate produced in tissue by metabolic conversion from [1-13C]-lactate that has flowed into the tissue or is in the blood. Generally, MAD-STEAM can be applied to any system in which spins undergo a frequency shift.
Keywords: Hyperpolarized carbon-13 MR, MR spectroscopy, metabolic imaging, stimulated-echoes, magnetization exchange
Introduction
Hyperpolarized 13C nuclear magnetic resonance (NMR/MR) spectroscopy and magnetic resonance imaging (MRI) using dissolution dynamic nuclear polarization (DNP) provides the unique ability to non-invasively probe in vivo metabolism (1–3). It has significant potential to improve the detection and characterization of cancer in individual patients (4–14). The novel metabolic information this technique provides may have clinical applications in other metabolic disorders, such as ischemic heart disease (15–17) and inflammation (18), and has also been applied to imaging metabolism in the brain (19, 20) and lung (21). This information can be used to determine the severity of disease, as well as monitor the progression and response to therapy (6,8–10,13, 14). It has also been applied for novel liquid-state NMR experiments to observe rapid reactions (22). Dissolution DNP increases the injected substrate signal more than 10,000-fold, which provides sensitivity improvements over conventional MRI or MR spectroscopy. Furthermore, injected hyperpolarized agents probe active cellular enzyme-catalyzed metabolic conversions, while conventional methods can be confounded by signal from inactive pools of metabolites. For example, lactate that accumulates in cystic or necrotic regions in brain tumors (23) will likely be inaccessible to injected 13C-pyruvate (12).
Following injection, the observed signal is affected not only by cellular metabolism but also by vascularity, agent delivery, and transport in and out of cells. The signal likely includes components that originated in other tissues or in the blood and flowed into the voxel, which are not representative of tissue metabolism. For example, [1-13C]-pyruvate is enzymatically converted to [1-13C]-lactate in the blood by erythrocytes that contain lactate dehydrogenase (LDH) (24, 25). In the kidneys, a substantial portion of the high levels of [1-13C]-lactate observed following [1-13C]-pyruvate injection are from in-flowing metabolites, and not due to kidney metabolism (26).
In this paper we present a rapid MR spectroscopy method for direct detection of metabolic conversion that is applicable to in vivo imaging of hyperpolarized substrates. Most previous methods do not offer the ability to directly observe this conversion or to distinguish tissue conversion from in-flowing metabolites. Time-resolved methods offer the capability to observe flow and kinetics (27–32), an improvement over single time-point acquisitions, where the flow and kinetics can be estimated using modeling techniques. Metabolic conversion and magnetization exchange can be observed with saturation or inversion magnetization transfer (MT), which has recently been applied to hyperpolarized 13C MR using multiple acquisitions to quantify the conversion (33, 34).
2D Exchange spectroscopy (EXSY) (35) is a 2D-NMR spectroscopy method for directly observing exchange between compounds based on a stimulated-echo. It uses multiple experiments in which the encoding time (t1) is incremented as well as a multi-step phase-cycling scheme. Performing multiple encoding steps is difficult for detecting in vivo hyperpolarized compounds because the magnetization is not replenished. 1D stimulated-echo EXSY methods use multiple mixing times with judiciously chosen t1 times to measure exchange dynamics (36, 37). (MT experiments have also been designated as 1D EXSY.) Previous HP 2D-NMR experiments have been performed by using small or variable flip angle RF excitation pulses (38, 39), and by continuous (40) or interrupted (41) flow of hyperpolarized compounds. Ultrafast 2D-NMR spectroscopy requires only a single encoding step and has been applied to hyperpolarized compounds (38, 42), but it assumes spatial homogeneity in one direction that maybe violated in vivo.
The primary purpose of the method proposed here is to directly observe active cellular metabolic conversion. Moreover, it could also be used for other applications in which spins undergo a frequency shift, including determination of rates of chemical reactions, magnetization exchange, and observing changes in the local magnetic field environment. Similarly to EXSY, the approach is based on a stimulated-echo acquisition. For this reason, we have named our method Metabolic Activity Decomposition Stimulated-echo Acquisition Mode, or MAD-STEAM. Unlike 1D and 2D EXSY, MAD-STEAM requires only a single encoding and single acquisition step, an approach which is enabled by a phase-sensitive detection approach in which metabolites generated by metabolic conversion during the mixing time are phase shifted by and show up in the imaginary signal channel. Unlike MT methods, MAD-STEAM directly detects exchange and can also measure bi-directional exchange. The key new feature of this method is its ability to detect metabolic conversion and magnetization exchange between compounds in a single encoding and acquisition step, making it ideal for hyperpolarized MR. This method also suppresses signal from flowing metabolites, localizing the detected signal to stationary tissue. Generally, MAD-STEAM is not limited to metabolic conversion of hyperpolarized substrates and can be applied to any system in which spins undergo a frequency shift.
Theory
MAD-STEAM Signal Encoding
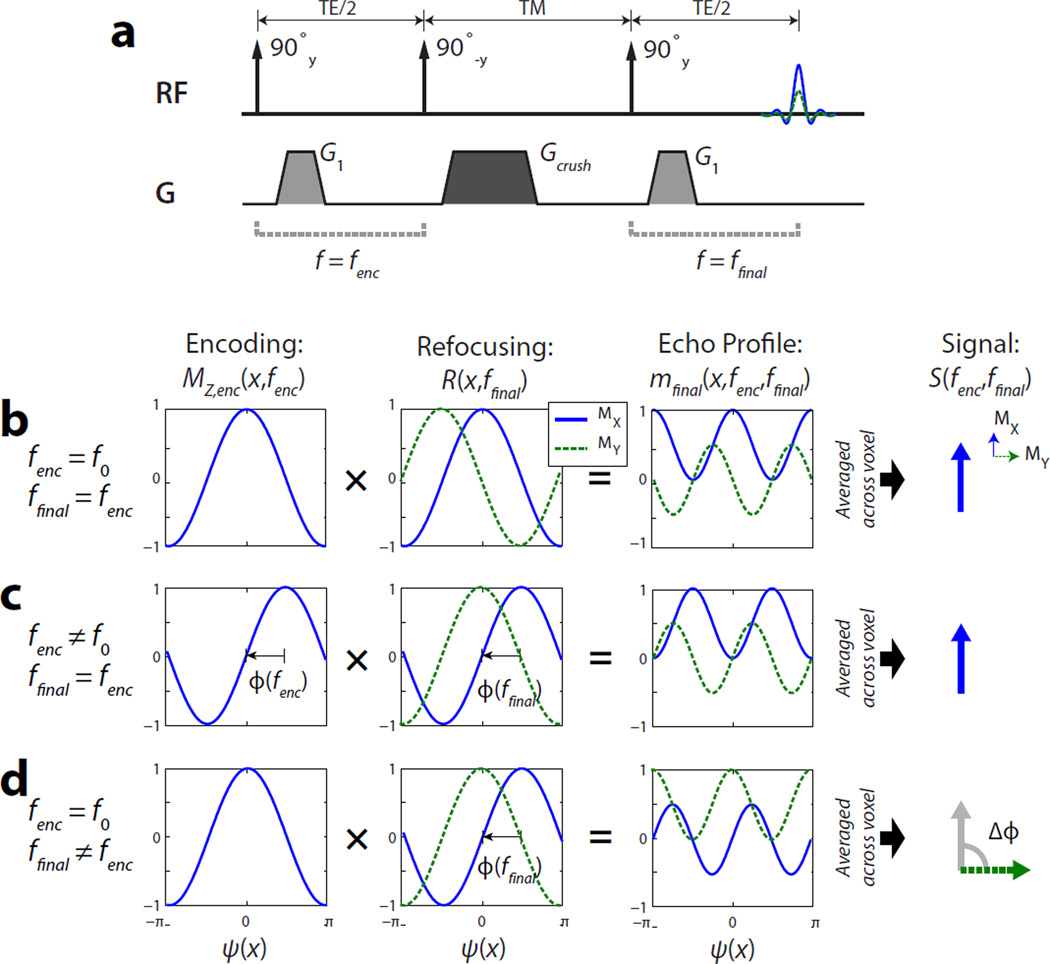
The signal encoding in the MAD-STEAM method is illustrated in Fig. 1. A 90°y − 90°−y stimulated-echo encoding followed by a crusher results in the following encoding along MZ:
| (1) |
where a spatial encoding is created by the gradients, G⃗(t):
| (2) |
| (3) |
and a spectral encoding is created by the time delay
| (4) |
where f is the precession frequency of an isochromat, and f0 is the reference center frequency of the RF pulses and receiver.
Figure 1.
Illustration of the phase-sensitive signal encoding in MAD-STEAM. (a) Stimulated-echo pulse sequence. (b,c) Signal encoding with no net frequency shift during the mixing time (TM), where the received signal has no phase shift (ie Δϕ = 0 from Eq. 8) (d) Signal encoding with a frequency shift during the mixing time, where the received signal a phase shift. In MAD-STEAM and this illustration example, TE is chosen such that Δϕ = π/2.
The final 90°y rotates MZ,enc onto MX and is followed by rephasing that can be described by a multiplication of the complex transverse magnetization, m = MX + iMY, with a rotation R(x⃗, f) around z that is represented by the complex term:
| (5) |
If a spin has a resonant frequency of fenc prior to the mixing time and ffinal after, during the rephasing, the final transverse magnetization is given by
| (6) |
Provided spatial modulation is sufficiently high across the voxel volume, V, the first exponential term integrates to zero across x⃗, and results in a received signal of
| (7) |
This includes the inherent 50% signal loss of a stimulated-echo as well as a phase shift, Δϕ(fenc, ffinal), that depends on the difference between the frequency of the spin at the time of encoding and finally at readout:
| (8) |
For spins that undergo no frequency shift during the mixing time (ie ffinal = fenc), there is no phase shift. However, for spins that do undergo a frequency shift, which can be caused by magnetization exchange, metabolic conversion, or a change in the local field, there can be a non-zero phase shift of the received signal.
Choosing this phase shift to be ±π/2 is the basis for the MAD-STEAM method, meaning spins undergoing metabolic conversion or exchange will be observed solely in the imaginary signal channel:
| (9) |
for an integer k and a frequency shift from fA to fB during the mixing time. The reverse conversion will also show up in the imaginary channel, but with an opposite sign:
| (10) |
Exchange Spectroscopy Interpretation
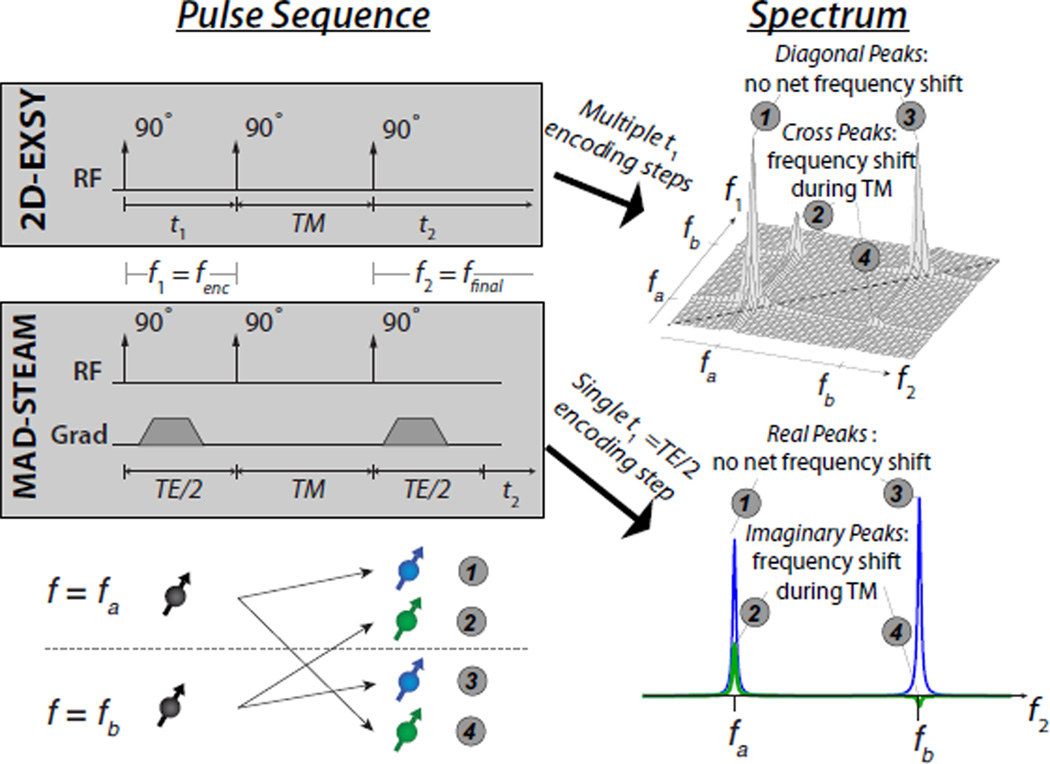
The MAD-STEAM experiment can also be viewed as a single step in an 2D exchange spectroscopy (EXSY) MR experiment (35), and this interpretation is illustrated in Fig. 2. EXSY is designed to measure longitudinal magnetization exchange and also uses a stimulated-echo formed by three 90° pulses. It is a 2D experiment in which the time between the first two 90° pulses, t1, is incremented between acquisitions and the stimulated-echo is acquired in the t2 dimension. This results in a 2D spectrum that is the Fourier Transform, ℱ{·}, of the 2D time data
| (11) |
Figure 2.
Illustration of the relationship between 2D exchange spectroscopy (EXSY) and MAD-STEAM. MAD-STEAM is a single step in an EXSY experiment, and their spectra are related by the relationship in Eq. 13. The MAD-STEAM TE is chosen such that the complex exponential weighting gives a phase difference of ±π/2 between the two peaks of interest.
In a 2D-EXSY spectrum, the diagonal peaks have undergone no net frequency shift while the cross peaks are a result of a frequency shift during the mixing time.
MAD-STEAM is a single step of 2D-EXSY with t1 = TE/2, and the time domain signal is:
| (12) |
The resulting MAD-STEAM 1D spectrum in relation to the 2D EXSY spectrum is then
| (13) |
where ✶ represents the convolution operation.
This result is a projection along one frequency dimension of the 2D EXSY spectrum multiplied by a complex exponential with a period of 2/TE, as illustrated in Fig. 2. This period means that the phase difference in the MAD-STEAM spectrum between an EXSY diagonal peak at f1 = fenc and a corresponding exchanging cross peak at f2 = ffinal is 2π(ffinal − fenc)TE/2, the result of in Eq. 8. In MAD-STEAM, the sampled t1 = TE/2 is chosen such that the phase shift between the peaks of interest is ±π/2. Note that previous 1D-EXSY methods with judiciously chosen encoding times (37) use t1 = (1/2+k/2)/(fB − fA) (assuming fB > fA with an integer k) for two-site exchange, while MAD-STEAM uses t1 = (1/4 + k/2)/(fB − fA).
Sources of Phase
MAD-STEAM uses the signal phase to separate exchanging or converting components, and thus is sensitive to other sources of phase in MR experiments. Coherent flow and other coherent bulk motion will introduce a spatially-dependant phase, but which does not vary with frequency. Provided all components of interest experience the same coherent motion this will not corrupt the MAD-STEAM phase-sensitive detection. Turbulent flow and incoherent motion such as diffusion are inherently suppressed by the encoding and rephasing gradients in the STEAM sequence, and this is the basis for STEAM diffusion imaging. In the mixing times used of greater than several seconds, most flow is incoherent and is thus suppressed, meaning MAD-STEAM is primarily observing extra-vascular components.
Other contributing sources to signal phase include RF amplifiers, which can have phase instability between excitations, RF coils with spatially varying phase profiles, and timing offsets that will introduce first order spectral phase.
Materials and Methods
Pulse Sequence
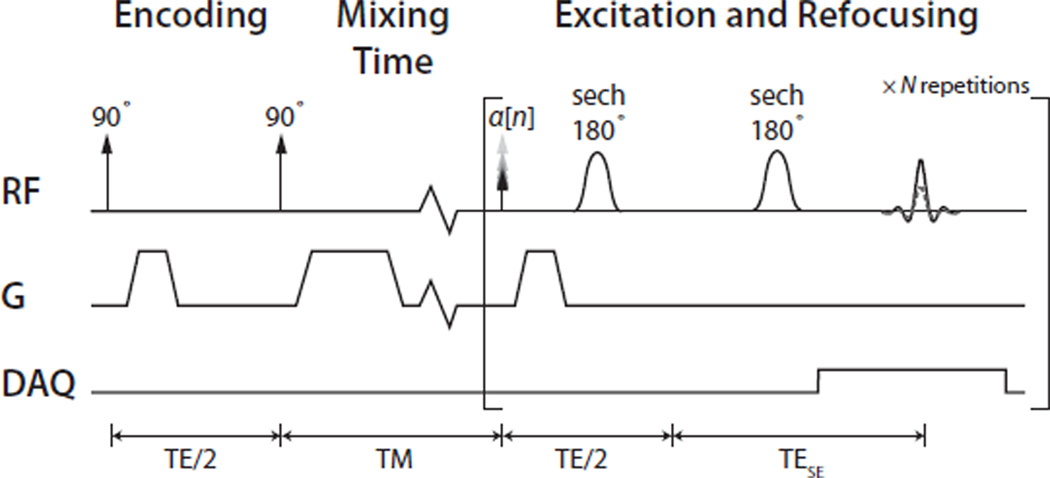
Figure 3 shows the pulse sequence used in the MAD-STEAM experiments shown. The 90° pulses were 1.8 ms, and the final 90° was slab-selective and used a progressive flip angle, α[n], as described in (43), in order to equalize the signal across multiple readouts by adjusting for the depletion of hyperpolarized magnetization by previous RF pulses. While not required for detection of exchange, these multiple readouts allow for observation of the conversion kinetics. Two non-selective adiabatic sech pulses as described in (44) (associated crusher gradients not shown) were used to move the echo later in time. This enables robust phase sensitive detection by symmetric sampling of the echo, which has narrow spectral linewidths in both the real and imaginary channels. In these experiments, TESE = 140 ms. The encoding gradient strength was chosen as a balance of (a) providing at least several 2π cycles of phase accumulation across the slab size for appropriate averaging of the STE modulation, and (b) minimizing losses from diffusion-weighting for the mixing time (TM) range of interest. A 102.4 ms readout was used with a 2.5 kHz spectral bandwidth.
Figure 3.
MAD-STEAM pulse sequence. The Encoding (90°-90°) section stores the magnetization along MZ with a sinusoidal encoding (MZ,enc). The encoding was refocused and data acquired at multiple mixing times (TM). These used a progressive flip angle, α[n], (43) to account for the depletion of stored magnetization by previous excitation pulses. An adiabatic double spin-echo was used following the excitation pulse and refocusing gradient to allow for symmetric sampling of the echo.
Pre-saturation of lactate or pyruvate-hydrate was performed in several experiments by applying 3 maximum-phase 20 ms saturation pulses with 150 Hz bandwidth and accompanying crusher gradients centered on the metabolite to be saturated prior to the MAD-STEAM sequence. Pulse sequence timings were calibrated on a phantom containing enriched [1-13C]lactate and [1-13C]acetate by removing any first-order spectral phase effects. 13Curea was included in all experiments as a phase reference, and was used to determine the zeroorder spectral phase correction.
Experimental Setup
Experiments were performed on a 3 Tesla clinical-research MRI system (GE Healthcare, Waukesha, WI, USA) with 40 mT/m, 150 mT/m/ms gradients and a broadband RF amplifier. A custom built, dual-tuned mouse birdcage coil was used for RF transmission and signal reception (45). Compounds consisting of neat [1-13C] pyruvic acid (14.2 M) with the trityl radical OX063 (15 mM) (Oxford Instruments, UK), and 99% 13C-urea (Sigma-Aldrich, St. Louis, MO) in glycerol (6.4 M) with the trityl radical OX063 (23 mM), were simultaneously polarized (46) in a HyperSense DNP system (Oxford Instruments, Abingdon, UK) at 3.35 T and a temperature of 1.3° K. The hyperpolarized compounds were dissolved to 60–80 mM (pyruvate) and 60–115 mM (urea) in a TRIS/NaOH/EDTA buffer to produce a solution with neutral pH that was used in phantom experiments or injected into the animals. The pH was measured from a separate aliquot of this solution.
Experiments
Two types of validation experiments were performed in syringes: (1) hydration experiments observing the conversion between pyruvate and pyruvate-hydrate and (2) metabolic assay experiments with lactate dehydrogenase (LDH) to observe the conversion between pyruvate and lactate.
The hydration experiments were performed on syringes containing 0.5–1 mL of hyperpolarized solution at approximately room temperature (≈ 296 K). The phase validation experiments were performed on the same day using solution from two dissolutions (pH = 8.0, 7.35) with 60 mM [1-13C]-pyruvate and 60 mM 13C-urea. The spin-echo MR spectroscopy comparison experiments were all performed using 4 syringes from a single dissolution (pH = 7.54) with 80 mM [1-13C]-pyruvate and 80 mM 13C-urea. The MAD-STEAM sequence used an encoding gradient on the Z axis with a spatial encoding period (1/|k⃗(T)|) of 3.6 mm, a diffusion-encoding of b(TM) = 0.15 + (TM − .05)2.6 s/mm2, and TM from 50 ms to 14.05 s.
Metabolic assay experiments were performed by adding the hyperpolarized solution to a syringe containing 25.56 units of LDH and 14 µM nicotinamide adenine dinucleotide (NADH) (Sigma-Aldrich, St. Louis, MO) dissolved in 2.5 mL phosphate buffer, similarly to (47). This was mixed with 0.5mL from the dissoluved pyruvate and urea mixture, resulting in 8.5 µM pyruavte and 9.8 µM urea. The MAD-STEAM acquisition was initiated as soon as possible following mixing to measure the metabolic conversion. The sequence used an encoding gradient on the Z axis with a spatial encoding period (1/|k⃗(T)|) of 5.2 mm, a diffusion-encoding of b(TM) = 0.019 + (TM − .01)1.45 s/mm2, and TM from 14 ms to 9.01 s.
Experiments were performed in normal mice and in a transgenic adenocarcinoma of mouse prostate (TRAMP) mouse model. All animal studies were carried out under a protocol approved by our Institutional Animal Care and Use Committee. The animals were placed on a 37°C heating pad in the RF coil, and anesthesia was maintained by a continual delivery of isoflurane (1–1.5%) with oxygen (1 liter/min). Respiratory rate and skin color were monitored by periodic visual inspection. In these studies, 350 µL of 80 mM [1-13C]-pyruvate and 115 mM 13C-urea solution were injected into the animals over 12 seconds. The MAD-STEAM pulse sequence was initiated 20–25 sec after the start of injection to allow for perfusion of the bolus into the tissue. The sequence used an encoding gradient on the Z axis with a spatial encoding period (1/|k⃗(T)|) of 3.0 mm, a diffusion-encoding of b(TM) = 0.056 + (TM − .01)4.36 s/mm2, and TM from 14 ms to 19.01 s.
The kinetics were estimated by fitting the experimental data to a two-site exchange model in MATLAB. In the saturation-recovery pyruvate hydration experiments, the data magnitude was normalized to the pyruvate (P) plus pyruvate-hydrate (H) signal to compensate for T1 decay, and fit to:
| (14) |
For the MAD-STEAM experiments without saturation, the real (ℜ{·}) and imaginary (ℑ{·}) components were used in a two-site exchange model between pyruvate (P) and either pyruvate-hydrate or lactate (X) including T1 decay (R1P, R1X):
| (15) |
The T2 of the 13C isotopes used in these studies has been measured to be > 100 ms in vivo at 3T (48). T2 decay at the overall TEs of 153–155 ms will weight the data towards longer T2 components (which have less dipolar coupling to the local environment), but this weighting will not affect the analysis because it was constant for all mixing times.
Results
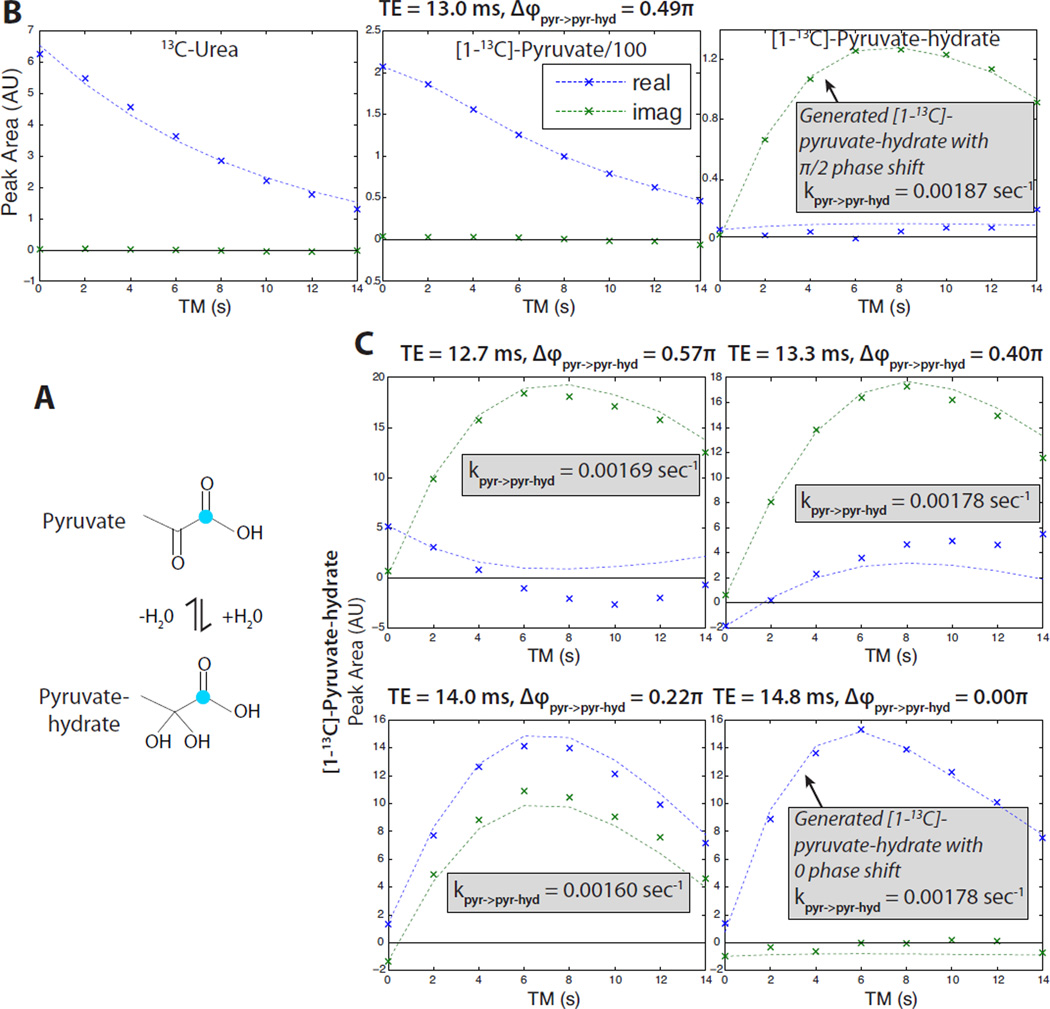
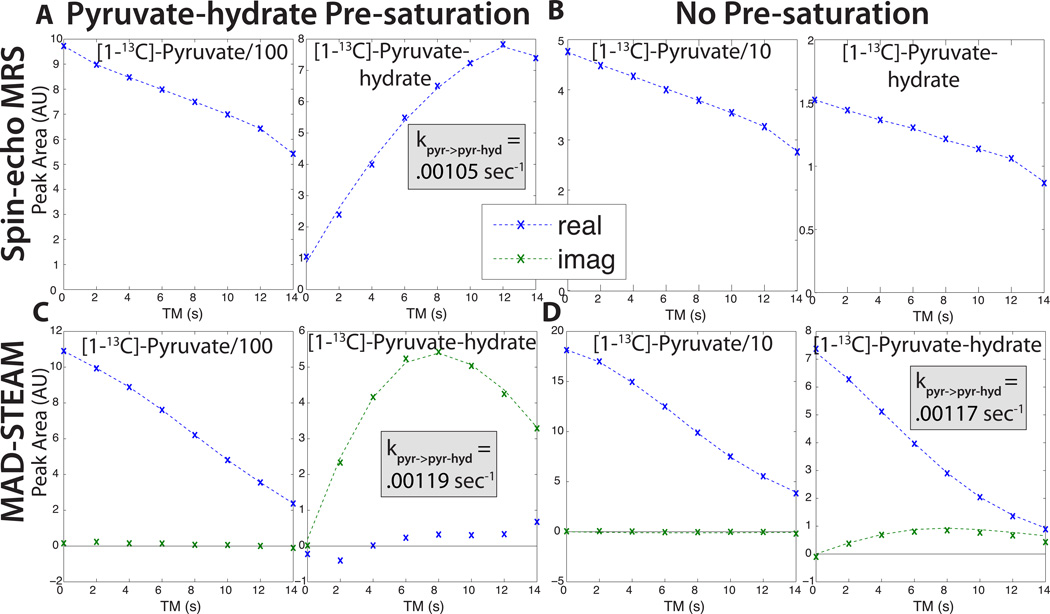
In the syringe experiments shown in Fig. 4, real-time exchange between pyruvate (pyr) and pyruvate-hydrate (pyr-hyd) in water was observed, validating the MAD-STEAM method. Experiments at different TE times with pre-saturation of pyruvate-hydrate show that the pyruvate-hydrate generated from pyruvate during the mixing time appears with the expected Δϕ as predicted by Eq. 8 with fpyr−hyd − fpyr = 270 Hz at 3T. We also compared the pyruvate hydration kinetics derived from MAD-STEAM to a conventional saturation-recovery experiment in Fig. 5. The rate of pyruvate-hydrate formulation was similar between the conventional spin-echo and MAD-STEAM saturation-recovery experiments (A,C), and also between the MAD-STEAM experiments with and without pre-saturation (C,D). These rates were slower than our previous saturation-recovery MAD-STEAM experiments, which is likely due to the different pyruvate and NaOH buffer concentrations of 80 versus 60 mM used.
Figure 4.
Validation of the MAD-STEAM method observing pyruvate (pyr) hydration following pre-saturation of the pyruvate-hydrate (pyr-hyd) resonance. (A) Pyruvic acid dissolved into an aqueous solution creates exchange between pyruvate and pyruvate-hydrate, which are in equilibrium. (Teal indicates enriched 13C.) (B) TE = 13.0 ms experiment showing urea (phase reference) and the conversion from pyruvate to pyruvate-hydrate. (C) Various TE experiments showing the phase of the generated pyruvate-hydrate. In all of different TE experiments shown, the experimental data (x’s) phase matches well with the expected curves (dashed lines), which are based on the predicted phase shift, Δϕ, and the fitted conversion rate. Diffferences between the data and expected curves are likely due to imperfect pyruvate-hydrate saturation.
Figure 5.
Comparison of pyruvate hydration kinetics using (A) Spin-echo MR spectroscopy with pre-saturation of pyruvate-hydrate. (B) Spin-echo MR spectroscopy without presaturation (Note: the kinetics cannot be esimated from this experiment). (C) MAD-STEAM with TE = 13.0 ms and pre-saturation of pyruvate-hydrate. (D) MAD-STEAM with TE = 13.0 ms and no pre-saturation. The two-site exchange fits (dashed lines) were very similar between both spin-echo and MAD-STEAM saturation recovery, as well as between MAD-STEAM with and without pre-saturation. The experimental data is denoted by x’s.
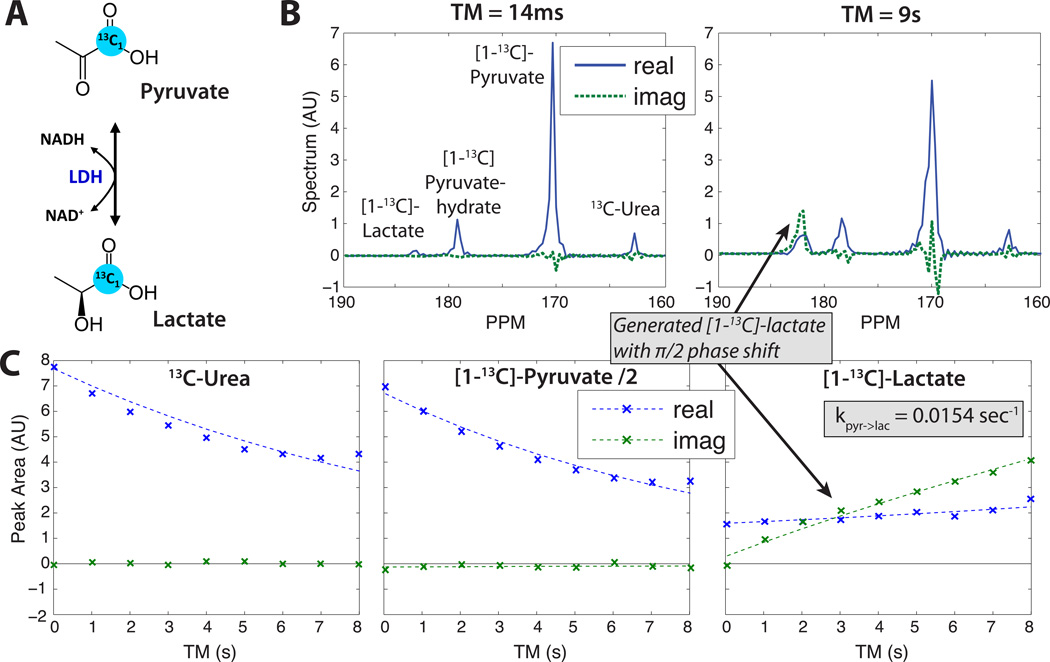
MAD-STEAM LDH assay experiments to observe the conversion from pyruvate to lactate (lac) are shown in Fig. 6, for which TE = 14.0 ms was used to give a phase shift this pathway for flac − fpyr = 393 Hz at 3T. These experiments validated the MAD-STEAM approach because all metabolites initially had the same phase, but the lactate generated through metabolic conversion had the expected phase shift. The relatively flat real lactate signal is likely the result of RF miscalibration with the progressive flip angle used across TM, for which smaller than desired flip angles will cause a relatively flat and even increasing modulation over TM (49).
Figure 6.
Ex vivo LDH enzyme assay validation using TE = 14.0 ms to observe the conversion from pyruvate to lactate. (A) Pyruvate to lactate conversion is mediated by the LDH enzyme and NAD cofactors. (B) Spectra at first and last time points. (C) Peak amplitude time courses: data (x’s) and fitted two-site exchange model with exponential decay (dashed lines). Lactate was partially suppressed prior to the experiment by pre-saturation pulses.
Note that in these pyruvate-lactate experiments, Δϕpyr−hyd→pyr = −0.22π, and pyruvate-hydrate converting to pyruvate will create some negative imaginary component that will potentially corrupt the pyruvate phase. Previous investigators have assumed the formation rate of polarized pyruvate-hydrate as 0.02sec−1 in vivo based on inversion transfer experiments (33). For this rate and an equilibrium ratio of pyruvate:pyruvate-hydrate ≈ 11 : 1 (measured from in vivo experiments), up to 8.3% of pyruvate can be generated from pyruvate-hydrate over our maximum TM of 19 sec, which could cause up to a 5.9% of the pyruvate to be imaginary, or a pyruvate phase shift of up to −3.5°. This would have a small effect on the detection of conversion between pryuvate and lactate.
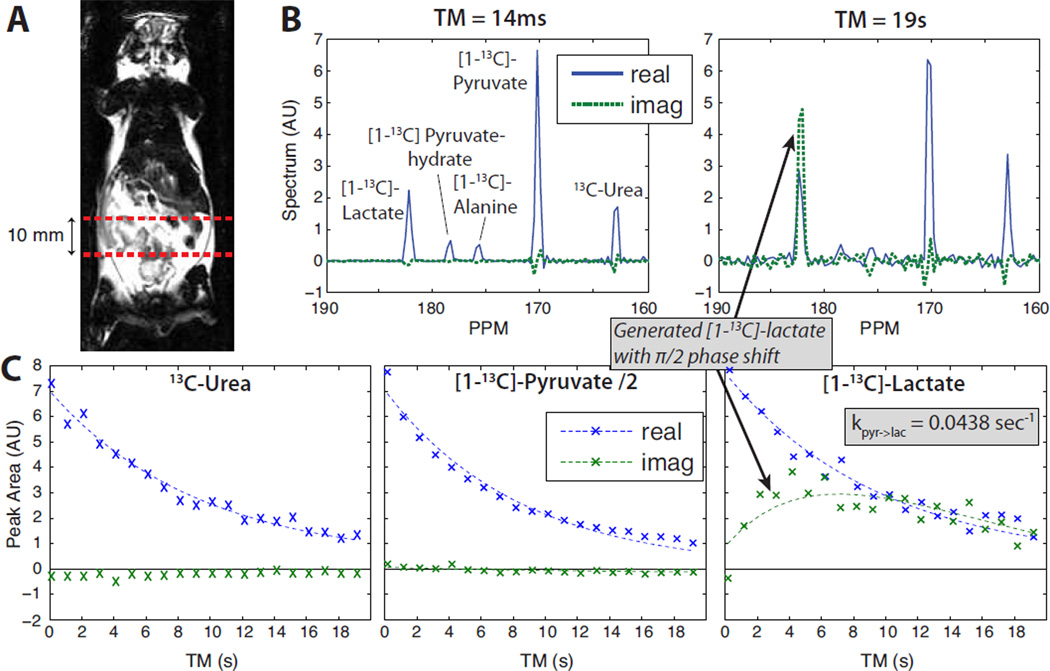
Experimental results in a normal mouse are shown in Figure 7, in which the MAD-STEAM method was applied to a slab across the abdomen where there is known to be relatively high metabolic conversion from pyurvate to lactate. The spectrum from the first time point (TM = 14 ms) is almost entirely in the real channel because little metabolic conversion has occured at this short mixing time. The real lactate at this time point is due to metabolic conversion prior to the experiment (which began 20 s after the start of injection to allow for perfusion of the pyruvate). With increasing mixing times, pyruvate remained primarily in the real channel throughout the 19 sec experiment, while the lactate curves show a clear build-up of an imaginary component from metabolic conversion. By TM = 10 sec, the lactate in the real (originally encoded) and imaginary (generated from pyruvate) components were roughly equal.
Figure 7.
Normal mouse results from a 10 mm slice through the abdomen. The pulse sequence started 20 sec after the start of injection to allow for perfusion of the bolus. (A) Slab location on a coronal image. (B) Spectra at first and last time points. (C) Peak amplitude time courses: data (x’s) and fitted two-site exchange model with exponential decay (dashed lines).
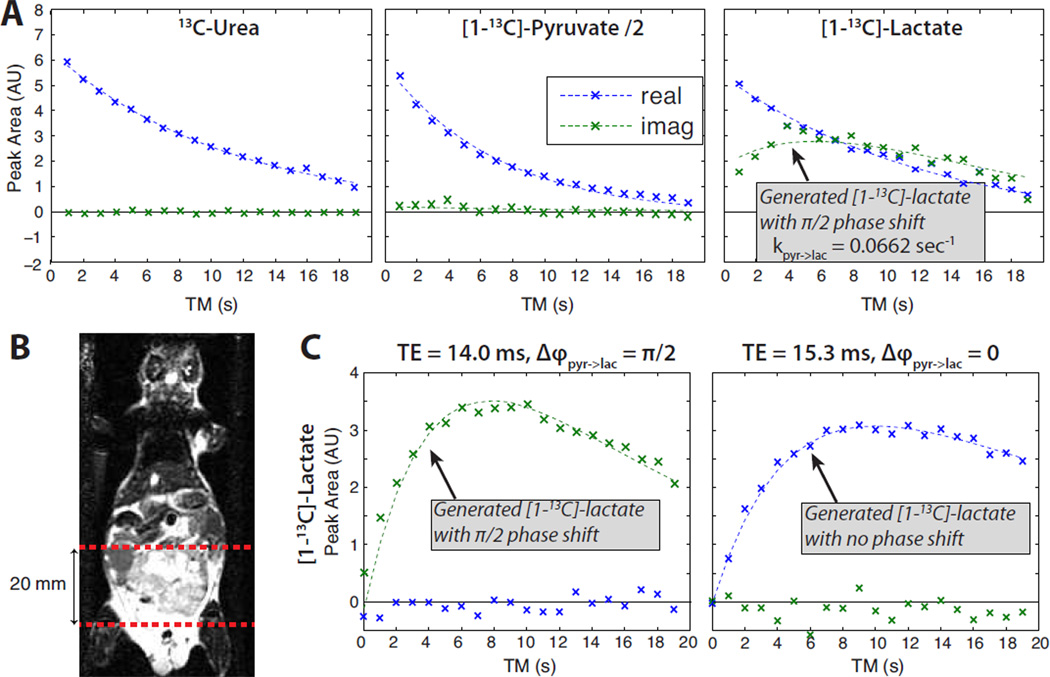
Similar results observing pyruvate-lactate conversion were also obtained in a transgenic prostate tumor mouse model (TRAMP), shown in Figure 8, in which [1-13C]-lactate has been demonstrated to be a biomarker of disease, disease progression, and response to therapy (5,6). In a slab across the tumor, there was substantial generation of lactate within 4 sec after encoding, and the measured rate constant kpyr→lac was greater than in the abdomen shown in Figure 7. There also is a slight decrease in the imaginary pyruvate component over the experiment, which could be generated by the back-reaction from encoded lactate to pyruvate but also may include contributions from pyruvate-hydrate to pyruvate conversion. Experiments were also performed with saturation of lactate prior to the MAD-STEAM sequence, shown in Fig. 8C, to validate this method in vivo. TEs of 14.0 and 15.3 ms were chosen such that the expected phase of generated lactate, Δϕpyr→lac, would be either or 0, respectively. In both experiments, the generated lactate appeared primarily in the expected real or imaginary channel, providing an in vivo validation of MAD-STEAM.
Figure 8.
Prostate tumor mouse model results from a 20 mm slab across a tumor. The MAD-STEAM pulse sequence was started 25 sec after the start of injection to allow for perfusion of the bolus. (A) Peak amplitude time courses without pre-saturation: data (x’s) and fits (dashed lines). (B) Slab location on a coronal image. (C) Lactate time courses following pre-saturation of lactate. These experiments used TE = 14.0 ms (left) and 15.3 ms (right) to modulate the phase of lactate generated from pyruvate (Δϕpyr→lac) similarly to Fig. 4. All curves were normalized to the peak pyruvate, and the relative amounts of lactate generated were similar across all three experiments.
Discussion
We have demonstrated a new MR technique for directly measuring active metabolic conversion non-invasively using hyperpolarized 13C agents. The technique was validated in syringe experiments observing the hydration of hyperpolarized [1-13C]-pyruvate, and our results also demonstrated direct observation of conversion between hyperpolarized [1-13C]-pyruvate and [1-13C]-lactate both ex vivo and in vivo. This technique is not limited to hyperpolarized [1-13C]-pyruvate. It could be applied to other hyperpolarized 13C substrates, such as [1, 4-13C]-fumarate, [2-13C]-fructose, [5-13C]-glutamine, and [1-13C]-dehydroascorbate (DHA) all of which have been shown to undergo enzyme-catalyzed metabolic conversions in vivo. Another potential application is hyperpolarized 129Xe gas imaging, for which the in vivo chemical shift is very sensitive to the local environment (50), which has allowed for novel characterizations of microstructures (51, 52) and lung function (53). MAD-STEAM would allow for direct observation of molecules transitioning between environments. Applied to lung function imaging, this could provide improved evaluation of lung function by monitoring the transition of hyperpolarized 129Xe molecules between the lung space, lung parenchyma, and blood. MAD-STEAM can also generally be applied to non-hyperpolarized MR experiments, provided the nuclei are undergoing metabolic conversion, exchange, or any other chemical shift that is slower than the encoding time and RF pulse durations but faster than T1 recovery.
In all of these applications, MAD-STEAM data provides an excellent basis for kinetic modeling, and we have shown preliminary results of kinetic model fits. Compared with a conventional dynamic spin-echo MR spectroscopy (as in Fig. 5), MAD-STEAM adds additional information by separating pre-existing and newly generated signal components. This provides improved accuracy for kinetic modeling. Future studies will further examine the use of kinetic models and their application to disease processes. Note that MAD-STEAM does not distinguish between metabolic flux and magnetization exchange, both of which have been shown to be occuring in vivo following a hyperpolarized [1-13C]-pyruvate injection (54), so the measured rate constants will include both effects. MAD-STEAM also does not inherently distinguish between transport (e.g. via monocarboxylate transporters for pyruvate and lactate) and metabolic conversion. Thus the measured MAD-STEAM pyruvate to lactate rates in vivo are not true enzymatic rate constants since they may also include the effects of transport.
In comparison to other methods, the SNR of MAD-STEAM has an inherent 50% loss that affects all stimulated-echo based methods (such as 2D-EXSY). When compared to 1D and 2D EXSY methods, this new approach requires only a single encoding and acquisition step (the multiple acquisitions shown are not required to measure the exchanging component pool sizes). The contrast is similar across these methods, as they also explicitly separate exchanging components and measure bidirectional exchange. MAD-STEAM, in its current form, is limited to two-site exchange, but we are working on extensions to measure multisite exchange. MT-based methods also require multiple acquisition steps, since a reference must be measured prior to MT measurements, but they do not suffer from the inherent 50% SNR loss. One main drawback to MT is that it only measures one-directional exchange. MAD-STEAM is more sensitive to motion than EXSY and MT methods due to the gradient encoding used, although these other methods are still somewhat sensitive to motion between the multiple steps required. The motion sensitivity in MAD-STEAM can be exploited as a feature to suppress moving spins.
There are several trade-offs and limitations to this technique. The frequency shift between the exchanging nuclei must be precisely known in order to choose TE such that a phase shift is achieved. When observing larger frequency shift systems MAD-STEAM will be more sensitive to any errors in TE. The method is also currently limited to observing two-site exchange except in cases where the chemical shift between sites allows for a single TE to create phase shifts for multiple exchange pathways. For two products at ffinal1, ffinal2 from one substrate at fenc, the exceptional case is a solution to
| (16) |
for integers k1, k2 that result in TE values on the order or less than T2.
Proper phasing is critical to MAD-STEAM in order to detect real and imaginary components. In these experiments, we used simultaneously injected 13C-urea as a reference since it is an inert perfusion agent that does not undergo metabolic conversion. This phase referencing assumes that all 13C-labeled compounds are in the same locations within the slab. Proper phasing may also be accomplished using proton images to determine the loaded coil phase spatial profile and/or an external reference object to track phase offets in each acquisition.
In MAD-STEAM, exchange or conversion pathways other that the pathway of interest will potentially corrupt the phase and thus the kinetic measurements of the compounds of interest. Conversion in these pathways to the compounds of interest will appear with a phase as predicted by Eq. 8. There may be exceptional cases where the chemical shifts result in no phase shift. In the results, we estimated the maximum phase shift contribution from pyruvate-hydrate in our pyruvate to lactate experiments at TE = 14.0 ms to be relatively small in vivo, ≤ |3.5°|. In these experiments, pyruvate is also converted to alanine, and the reverse reaction would create pyruate with Δϕala→pyr = 0.44π, potentially introducing some corruptive positive imaginary pyruvate component, although we believe this effect would be small in vivo. One way to eliminate corrupting sources of phase is to apply pre-saturation to other compounds that are not of interest. Following saturation, there would be no net conversion from these other compounds to the compounds of interest and thus no phase corruption. For example, when measuring conversion between [1-13C]-pyruvate and [1-13C]-lactate, this could be accomplished by saturating [1-13C]-pyruvate-hydrate and [1-13C]-alanine prior to the MAD-STEAM sequence.
The STEAM encoding gradient is required for proper spatial averaging of the sinusoidal modulation, but it also introduces motion sensitivity. The motion sensitivity is advantageous in removing flowing metabolite signals, and can also introduce diffusion-weighting. The minimum gradient area should be chosen to provide at least several 2π cycles of phase accumulation across the voxel size, but should be kept near this threshold if no diffusion-weighting is desired. The diffusion-weighting b-value is proportional to the mixing time, which will limit the maximum TM before ithere is significant diffusion signal loss. Hyperpolarized MAD-STEAM is limited to a single 90-90 encoding because it uses up the entire magnetization. The signal amplitude is reduced by half, inherent to the stimulated-echo, but some of this can be recovered by using a super-stimulated echo (26, 55).
Highlights.
Rapid approach for measuring magnetization exchange and metabolic conversion
Single encoding step enables use of this approach with hyperpolarized substrates
In vivo validation with hyperpolarized pyruvate to lactate conversion
Only metabolites in tissues were measured because owing spins were suppressed
Acknowledgements
The authors would particularly like to acknowledge Dr. Ralph Hurd for his insight into stimulated-echoes, Dr. James Tropp for the 1H/13C mouse coil used in all experiments, and Dr. Kayvan Keshari and Dr. Hikari Yoshihara for discussions on the hydration of pyruvate. We would also like to thank Kristen Scott, Dr. Robert Bok, Dr. Cornelius Von Morze, Dr. Simon Hu, Dr. Subramaniam Sukumar, Peter Shin, Galen Reed, and Yan Xing for assistance performing the experiments. This work was supported by NIH grants (R00-EB012064, P41-EB013598, R01-EB007588 & R01-CA111291), and UC Discovery Grant ITLbio04-10148 with GE Healthcare.
Footnotes
Publisher's Disclaimer: This is a PDF file of an unedited manuscript that has been accepted for publication. As a service to our customers we are providing this early version of the manuscript. The manuscript will undergo copyediting, typesetting, and review of the resulting proof before it is published in its final citable form. Please note that during the production process errors may be discovered which could affect the content, and all legal disclaimers that apply to the journal pertain.
References
- 1.Ardenkjaer-Larsen JH, Fridlund B, Gram A, Hansson G, Hansson L, Lerche MH, Servin R, Thaning M, Golman K. Increase in signal-to-noise ratio of > 10,000 times in liquid-state NMR. Proc Natl Acad Sci U S A. 2003;100:10158–10163. doi: 10.1073/pnas.1733835100. [DOI] [PMC free article] [PubMed] [Google Scholar]
- 2.Golman K, Ardenkjaer-Larsen JH, Petersson JS, Mansson S, Leunbach I. Molecular imaging with endogenous substances. Proc Natl Acad Sci U S A. 2003;100:10435–10439. doi: 10.1073/pnas.1733836100. [DOI] [PMC free article] [PubMed] [Google Scholar]
- 3.Golman K, in ‘t Zandt R, Thaning M. Real-time metabolic imaging. Proc Natl Acad Sci U S A. 2006;103:11270–11275. doi: 10.1073/pnas.0601319103. [DOI] [PMC free article] [PubMed] [Google Scholar]
- 4.Kurhanewicz J, Vigneron DB, Brindle K, Chekmenev EY, Comment A, Cunningham CH, DeBerardinis RJ, Green GG, Leach MO, Rajan SS, Rizi RR, Ross BD, Warren WS, Malloy CR. Analysis of cancer metabolism by imaging hyperpolarized nuclei: Prospects for translation to clinical research. Neoplasia. 2011;13:81–97. doi: 10.1593/neo.101102. [DOI] [PMC free article] [PubMed] [Google Scholar]
- 5.Chen AP, Albers MJ, Cunningham CH, Kohler SJ, Yen YF, Hurd RE, Tropp J, Bok R, Pauly JM, Nelson SJ, Kurhanewicz J, Vigneron DB. Hyperpolarized C-13 spectroscopic imaging of the TRAMP mouse at 3T–initial experience. Magn Reson Med. 2007;58:1099–1106. doi: 10.1002/mrm.21256. [DOI] [PubMed] [Google Scholar]
- 6.Albers MJ, Bok R, Chen AP, Cunningham CH, Zierhut ML, Zhang VY, Kohler SJ, Tropp J, Hurd RE, Yen YF, Nelson SJ, Vigneron DB, Kurhanewicz J. Hyperpolarized C-13 lactate, pyruvate, and alanine: Noninvasive biomarkers for prostate cancer detection and grading. Cancer Res. 2008;68:8607–8615. doi: 10.1158/0008-5472.CAN-08-0749. [DOI] [PMC free article] [PubMed] [Google Scholar]
- 7.Darpolor MM, Yen YF, Chua MS, Xing L, ClarkeKatzenberg RH, Shi W, Mayer D, Josan S, Hurd RE, Pfefferbaum A, Senadheera L, So S, Hofmann LV, Glazer GM, Spielman DM. In vivo mrsi of hyperpolarized [1-(13)c]pyruvate metabolism in rat hepatocellular carcinoma. NMR Biomed. 2011;24:506–513. doi: 10.1002/nbm.1616. [DOI] [PMC free article] [PubMed] [Google Scholar]
- 8.Day SE, Kettunen MI, Gallagher FA, Hu DE, Lerche M, Wolber J, Golman K, Ardenkjaer-Larsen JH, Brindle KM. Detecting tumor response to treatment using hyperpolarized 13C magnetic resonance imaging and spectroscopy. Nat Med. 2007;13:1382–1387. doi: 10.1038/nm1650. [DOI] [PubMed] [Google Scholar]
- 9.Witney TH, Kettunen MI, Hu De, Gallagher FA, Bohndiek SE, Napolitano R, Brindle KM. Detecting treatment response in a model of human breast adenocarcinoma using hyperpolarised [1-13c]pyruvate and [1,4-13c2]fumarate. Br J Cancer. 2010;103:1400–1406. doi: 10.1038/sj.bjc.6605945. [DOI] [PMC free article] [PubMed] [Google Scholar]
- 10.Day SE, Kettunen MI, Cherukuri MK, Mitchell JB, Lizak MJ, Morris HD, Matsumoto S, Koretsky AP, Brindle KM. Detecting response of rat c6 glioma tumors to radiotherapy using hyperpolarized [1- 13c]pyruvate and 13c magnetic resonance spectroscopic imaging. Magn Reson Med. 2011;65:557–563. doi: 10.1002/mrm.22698. [DOI] [PMC free article] [PubMed] [Google Scholar]
- 11.Saito K, Matsumoto S, Devasahayam N, Subramanian S, Munasinghe JP, Morris HD, Lizak MJ, ArdenkjaerLarsen JH, Mitchell JB, Krishna MC. Transient decrease in tumor oxygenation after intravenous administration of pyruvate. Magnetic Resonance in Medicine. 2012;67:801–807. doi: 10.1002/mrm.23065. [DOI] [PMC free article] [PubMed] [Google Scholar]
- 12.Park I, Larson PEZ, Zierhut ML, Hu S, Bok R, Ozawa T, Kurhanewicz J, Vigneron DB, VandenBerg SR, James CD, Nelson SJ. Hyperpolarized 13C MR metabolic imaging: application to brain tumors. Neuro Oncol. 2010;12:133–144. doi: 10.1093/neuonc/nop043. [DOI] [PMC free article] [PubMed] [Google Scholar]
- 13.Park I, Bok R, Ozawa T, Phillips JJ, James CD, Vigneron DB, Ronen SM, Nelson SJ. Detection of early response to temozolomide treatment in brain tumors using hyperpolarized 13c mr metabolic imaging. Journal of Magnetic Resonance Imaging. 2011;33:1284–1290. doi: 10.1002/jmri.22563. [DOI] [PMC free article] [PubMed] [Google Scholar]
- 14.Hu S, Balakrishnan A, Bok RA, Anderton B, Larson PEZ, Nelson SJ, Kurhanewicz J, Vigneron DB, Goga A. 13C-pyruvate imaging reveals alterations in glycolysis that precede c-MYC induced tumor formation and regression. Cell Metabolism. 2011;14:131–142. doi: 10.1016/j.cmet.2011.04.012. [DOI] [PMC free article] [PubMed] [Google Scholar]
- 15.Merritt ME, Harrison C, Storey C, Sherry AD, Malloy CR. Inhibition of carbohydrate oxidation during the first minute of reperfusion after brief ischemia: NMR detection of hyperpolarized 13CO2 and . Magn Reson Med. 2008;60:1029–1036. doi: 10.1002/mrm.21760. [DOI] [PMC free article] [PubMed] [Google Scholar]
- 16.Schroeder MA, Cochlin LE, Heather LC, Clarke K, Radda GK, Tyler DJ, Shulman RG. In vivo assessment of pyruvate dehydrogenase flux in the heart using hyperpolarized carbon-13 magnetic resonance. Proc Natl Acad Sci U S A. 2008;105:12051–12056. doi: 10.1073/pnas.0805953105. [DOI] [PMC free article] [PubMed] [Google Scholar]
- 17.Chen AP, Hurd RE, Schroeder MA, Lau AZ, Gu Yp, Lam WW, Barry J, Tropp J, Cunningham CH. Simultaneous investigation of cardiac pyruvate dehydrogenase flux, krebs cycle metabolism and ph, using hyperpolarized [1,2-13c2]pyruvate in vivo. NMR in Biomedicine. 2012;25:305–311. doi: 10.1002/nbm.1749. [DOI] [PMC free article] [PubMed] [Google Scholar]
- 18.MacKenzie JD, Yen YF, Mayer D, Tropp J, Hurd R, Spielman DM. Detection of inflammatory arthritis using hyperpolarized 13c-pyurvate with magnetic resonance imaging and spectroscopy. Radiology. 2011;259:414–420. doi: 10.1148/radiol.10101921. [DOI] [PMC free article] [PubMed] [Google Scholar]
- 19.Hurd RE, Yen YF, Tropp J, Pfefferbaum A, Spielman DM, Mayer D. Cerebral dynamics and metabolism of hyperpolarized [1-(13)c]pyruvate using time-resolved mr spectroscopic imaging. J Cereb Blood Flow Metab. 2010;30:1734–1741. doi: 10.1038/jcbfm.2010.93. [DOI] [PMC free article] [PubMed] [Google Scholar]
- 20.Marjanska M, Iltis I, Shestov AA, Deelchand DK, Nelson C, Uğurbil K, Henry PG. In vivo 13c spectroscopy in the rat brain using hyperpolarized [1-(13)c]pyruvate and [2-(13)c]pyruvate. J Magn Reson. 2010;206:210–218. doi: 10.1016/j.jmr.2010.07.006. [DOI] [PMC free article] [PubMed] [Google Scholar]
- 21.Pullinger B, Profka H, ArdenkjaerLarsen JH, Kuzma NN, Kadlecek S, Rizi RR. Metabolism of hyperpolarized [1-(13) c]pyruvate in the isolated perfused rat lung - an ischemia study. NMR Biomed. 2012;25:1113–1118. doi: 10.1002/nbm.2777. [DOI] [PMC free article] [PubMed] [Google Scholar]
- 22.Hilty C, Bowen S. Applications of dynamic nuclear polarization to the study of reactions and reagents in organic and biomolecular chemistry. Org. Biomol. Chem. 2010;8:3361–3365. doi: 10.1039/c004420m. [DOI] [PubMed] [Google Scholar]
- 23.Kugel H, Heindel W, Ernestus RI, Bunke J, du Mesnil R, Friedmann G. Human brain tumors: spectral patterns detected with localized h-1 mr spectroscopy. Radiology. 1992;183:701–709. doi: 10.1148/radiology.183.3.1584924. [DOI] [PubMed] [Google Scholar]
- 24.Brindle KM, Campbell ID, Simpson RJ. A 1h-nmr study of the activity expressed by lactate dehydrogenase in the human erythrocyte. Eur J Biochem. 1986;158:299–305. doi: 10.1111/j.1432-1033.1986.tb09751.x. [DOI] [PubMed] [Google Scholar]
- 25.Romijn JA, Chinkes DL, Schwarz JM, Wolfe RR. Lactate-pyruvate interconversion in blood: implications for in vivo tracer studies. Am J Physiol. 1994;266:E334–E340. doi: 10.1152/ajpendo.1994.266.3.E334. [DOI] [PubMed] [Google Scholar]
- 26.Larson PEZ, Kerr AB, Reed GD, Hurd RE, Kurhanewicz J, Pauly JM, Vigneron DB. Generating super stimulated-echoes in MRI and their application to hyperpolarized C-13 diffusion metabolic imaging. IEEE Trans Med Imaging. 2012;31:265–275. doi: 10.1109/TMI.2011.2168235. [DOI] [PMC free article] [PubMed] [Google Scholar]
- 27.Larson PEZ, Hu S, Lustig M, Kerr AB, Nelson SJ, Kurhanewicz J, Pauly JM, Vigneron DB. Fast dynamic 3D MR spectroscopic imaging with compressed sensing and multiband excitation pulses for hyperpolarized 13C studies. Magn Reson Med. 2011;65:610–619. doi: 10.1002/mrm.22650. [DOI] [PMC free article] [PubMed] [Google Scholar]
- 28.Lau AZ, Chen AP, Ghugre NR, Ramanan V, Lam WW, Connelly KA, Wright GA, Cunningham CH. Rapid multislice imaging of hyperpolarized 13c pyruvate and bicarbonate in the heart. Magn Reson Med. 2010;64:1323–1331. doi: 10.1002/mrm.22525. [DOI] [PubMed] [Google Scholar]
- 29.Mayer D, Yen YF, Tropp J, Pfefferbaum A, Hurd RE, Spielman DM. Application of subsecond spiral chemical shift imaging to real-time multislice metabolic imaging of the rat in vivo after injection of hyperpolarized 13C1-pyruvate. Magn Reson Med. 2009;62:557–564. doi: 10.1002/mrm.22041. [DOI] [PMC free article] [PubMed] [Google Scholar]
- 30.Wiesinger F, Weidl E, Menzel MI, Janich MA, Khegai O, Glaser SJ, Haase A, Schwaiger M, Schulte RF. Ideal spiral csi for dynamic metabolic mr imaging of hyperpolarized [1-13c]pyruvate. Magnetic Resonance in Medicine. 2012 Jul;68(1):8–16. doi: 10.1002/mrm.23212. [DOI] [PubMed] [Google Scholar]
- 31.von Morze C, Reed G, Shin P, Larson PEZ, Hu S, Bok R, Vigneron DB. Multi-band frequency encoding method for metabolic imaging with hyperpolarized [1-(13)c]pyruvate. J Magn Reson. 2011;211:109–113. doi: 10.1016/j.jmr.2011.04.007. [DOI] [PMC free article] [PubMed] [Google Scholar]
- 32.Reed GD, Larson PEZ, von Morze C, Bok RA, Lustig M, Kerr AB, Pauly JM, Kurhanewicz J, Vigneron DB. A method for simultaneous echo planar imaging of hyperpolarized 13c pyruvate and 13c lactate. J Magn Reson. 2012;217:41–47. doi: 10.1016/j.jmr.2012.02.008. [DOI] [PMC free article] [PubMed] [Google Scholar]
- 33.Kettunen MI, Hu D, Witney TH, McLaughlin R, Gallagher FA, Bohndiek SE, Day SE, Brindle KM. Magnetization transfer measurements of exchange between hyperpolarized [1-13C]pyruvate and [1-13C]lactate in a murine lymphoma. Magn Reson Med. 2010;63:872–880. doi: 10.1002/mrm.22276. [DOI] [PubMed] [Google Scholar]
- 34.Zeng H, Lee Y, Hilty C. Quantitative rate determination by dynamic nuclear polarization enhanced nmr of a diels-alder reaction. Analytical Chemistry. 2010;82:8897–8902. doi: 10.1021/ac101670n. [DOI] [PubMed] [Google Scholar]
- 35.Jeener J, Meier BH, Bachmann P, Ernst RR. Investigation of exchange processes by two-dimensional nmr spectroscopy. The Journal of Chemical Physics. 1979;71:4546–4553. [Google Scholar]
- 36.Engler R, Johnston E, Wade C. Dynamic parameters from nonselectively generated 1d exchange spectra. Journal of magnetic resonance. 1988;77:377–381. [Google Scholar]
- 37.Perrin C, Engler R. Accurate rate constants for chemical exchange from improved weighted linear-least-squares analysis of multiple 1d-exsy data. Journal of Magnetic Resonance, Series A. 1996;123:188–195. [Google Scholar]
- 38.Mishkovsky M, Frydman L. Progress in hyperpolarized ultrafast 2d nmr spectroscopy. ChemPhysChem. 2008;9:2340–2348. doi: 10.1002/cphc.200800461. [DOI] [PubMed] [Google Scholar]
- 39.Zeng H, Bowen S, Hilty C. Sequentially acquired two-dimensional nmr spectra from hyperpolarized sample. Journal of Magnetic Resonance. 2009;199:159–165. doi: 10.1016/j.jmr.2009.04.011. [DOI] [PubMed] [Google Scholar]
- 40.Seydoux R, Pines A, Haake M, Reimer JA. Nmr with a continuously circulating flow of laser-polarized 129xe. The Journal of Physical Chemistry B. 1999;103:4629–4637. [Google Scholar]
- 41.Cheng CY, Pfeilsticker J, Bowers CR. Dramatic enhancement of hyperpolarized xenon-129 2d-nmr exchange cross-peak signals in nanotubes by interruption of the gas flow. Journal of the American Chemical Society. 2008;130:2390–2391. doi: 10.1021/ja078031i. [DOI] [PubMed] [Google Scholar]
- 42.Frydman L, Blazina D. Ultrafast two-dimensional nuclear magnetic resonance spectroscopy of hyperpolarized solutions. Nat Phys. 2007;3:415–419. [Google Scholar]
- 43.Zhao L, Mulkern R, Tseng CH, Williamson D, Patz S, Kraft R, Walsworth RL, Jolesz FA, Albert MS. Gradient-echo imaging considerations for hyperpolarized 129Xe MR. J Magn Reson B. 1996;113:179–183. [PubMed] [Google Scholar]
- 44.Cunningham CH, Chen AP, Albers MJ, Kurhanewicz J, Yen YF, Hurd RE, Pauly JM, Nelson SJ, Vigneron DB. Double spin-echo sequence for rapid spectroscopic imaging of hyperpolarized 13C. J Magn Reson. 2007;187:357–362. doi: 10.1016/j.jmr.2007.05.014. [DOI] [PubMed] [Google Scholar]
- 45.Derby K, Tropp J, Hawryszko C. Design and evaluation of a novel dual-tuned resonator for spectroscopic imaging. J Magn Reson. 1990;86:256–262. [Google Scholar]
- 46.Wilson DM, Keshari KR, Larson PEZ, Chen AP, Criekinge MV, Bok R, Nelson SJ, Macdonald JM, Vigneron DB, Kurhanewicz J. Multi-compound polarization by dnp allows simultaneous assessment of multiple enzymatic activities in vivo. J Magn Reson. 2010;205:141–147. doi: 10.1016/j.jmr.2010.04.012. [DOI] [PMC free article] [PubMed] [Google Scholar]
- 47.Howell BF, McCune S, Schaffer R. Lactate-to-pyruvate or pyruvate-to-lactate assay for lactate dehydrogenase: a re-examination. Clin Chem. 1979;25:269–272. [PubMed] [Google Scholar]
- 48.Yen YF, LeRoux P, Mayer D, King R, Spielman D, Tropp J, ButtsPauly K, Pfefferbaum A, Vasanawala S, Hurd R. T2 relaxation times of 13c metabolites in a rat hepatocellular carcinoma model measured in vivo using 13c-mrs of hyperpolarized [1-13c]pyruvate. NMR Biomed. 2010;23:414–423. doi: 10.1002/nbm.1481. [DOI] [PMC free article] [PubMed] [Google Scholar]
- 49.Deppe MH, Teh K, ParraRobles J, Lee KJ, Wild JM. Slice profile effects in 2d slice-selective mri of hyperpolarized nuclei. J Magn Reson. 2010;202:180–189. doi: 10.1016/j.jmr.2009.11.003. [DOI] [PubMed] [Google Scholar]
- 50.Miller KW, Reo NV, SchootUiterkamp AJ, Stengle DP, Stengle TR, Williamson KL. Xenon nmr: chemical shifts of a general anesthetic in common solvents, proteins, and membranes. Proc Natl Acad Sci U S A. 1981;78:4946–4949. doi: 10.1073/pnas.78.8.4946. [DOI] [PMC free article] [PubMed] [Google Scholar]
- 51.Ito T, Fraissard J. 129xe nmr study of xenon adsorbed on y zeolites. The Journal of Chemical Physics. 1982;76:5225–5229. [Google Scholar]
- 52.Ripmeester J. Nuclear shielding of trapped xenon obtained by proton-enhanced, magicangle spinning xenon-129 nmr spectroscopy. Journal of the American Chemical Society. 1982;104:289–290. [Google Scholar]
- 53.Mugler JP, 3rd, Altes TA, Ruset IC, Dregely IM, Mata JF, Miller GW, Ketel S, Ketel J, Hersman FW, Ruppert K. Simultaneous magnetic resonance imaging of ventilation distribution and gas uptake in the human lung using hyperpolarized xenon-129. Proc Natl Acad Sci U S A. 2010;107:21707–21712. doi: 10.1073/pnas.1011912107. [DOI] [PMC free article] [PubMed] [Google Scholar]
- 54.Moreno KX, Sabelhaus SM, Merritt ME, Sherry AD, Malloy CR. Competition of pyruvate with physiological substrates for oxidation by the heart: implications for studies with hyperpolarized [1-13c]pyruvate. Am J Physiol Heart Circ Physiol. 2010;298:H1556–H1564. doi: 10.1152/ajpheart.00656.2009. [DOI] [PMC free article] [PubMed] [Google Scholar]
- 55.Hennig J, Il’yasov KA, Weigel M. Imaging with positive t1-contrast using superstimulated echoes. Magnetic Resonance in Medicine. 2012 Oct;68(4):1157–1165. doi: 10.1002/mrm.24111. [DOI] [PubMed] [Google Scholar]


