

Abstract
Objectives
We hypothesized that arterial spin labeling (ASL) magnetic resonance imaging (MRI) at 3 Tesla (T) would be a reliable non-contrast technique for measuring peak exercise calf muscle blood flow in both healthy volunteers and patients with peripheral arterial disease (PAD) and will discriminate between these groups.
Background
Prior work demonstrated the utility of first-pass gadolinium-enhanced calf muscle perfusion MRI in patients with PAD. However, patients with PAD often have advanced renal disease and cannot receive gadolinium.
Methods
PAD patients had claudication and an ankle brachial index 0.4–0.9. Age-matched normal subjects (NL) had no PAD risk factors and were symptom-free with exercise. All performed supine plantar flexion exercise in a 3T MRI scanner using a pedal ergometer until exhaustion or limiting symptoms and were imaged at peak exercise with 15 averaged ASL images. Peak perfusion was measured from ASL blood flow images by placing a region of interest in the calf muscle region with the greatest signal intensity. Perfusion was compared between PAD and NL and repeat testing was performed in 12 subjects (5 NL, 7 PAD) for assessment of reproducibility.
Results
Peak exercise calf perfusion (mean±SD) of 15 NL (age 54±9 years) was higher than in 15 PAD (age 64±5 years, ABI 0.70±0.14) (80±23mL/min-100g vs. 49±16mL/min-100g, p<0.001). Five NL performed exercise matched to PAD and again demonstrated higher perfusion (84±25mL/min-100g, p<0.002). As a measure of reproducibility, intra-class correlation coefficient between repeated studies was 0.87 (95% CI 0.61–0.96). Inter-observer reproducibility was 0.96 (95% CI 0.84–0.99).
Conclusions
ASL is a reproducible non-contrast technique for quantifying peak exercise blood flow in calf muscle. Independent of exercise time, ASL discriminates between NL and PAD. This technique may prove useful for clinical trials of therapies for improving muscle perfusion, especially in patients unable to receive gadolinium.
Keywords: Peripheral arterial disease, Magnetic resonance imaging, Perfusion, Arterial spin labeling
Introduction
Peripheral arterial disease (PAD) affects more than 8 million adults in the United States (1). In addition to the increased cardiovascular mortality (2), patients with PAD have impaired exercise tolerance, reduced quality of life and a decline in functional capacity over time (3). The ankle brachial index (ABI) is the traditional non-invasive measure of PAD, however abnormal blood flow to the lower extremity measured by an ABI < 0.90 does not correlate well with time to initial claudication and maximum claudication distance (4). The ABI measures the ratio of the systolic blood pressure obtained at the ankle (highest of either dorsalis pedis or posterior tibial arteries) to the maximal brachial artery blood pressure. An ABI of 1.0–1.3 is considered normal, an ABI between 0.90–1.0 borderline for PAD and ABI < 0.90 diagnostic of lower extremity peripheral arterial disease.
We have shown that gadolinium-enhanced calf muscle perfusion measured by magnetic resonance imaging (MRI) at peak exercise using a plantar-flexion ergometer discriminates patients with PAD from normal subjects independent of exercise workload (5) and that it correlates with walking distance (6). We also used this technique in a clinical trial of lipid lowering therapy in PAD (7) and showed that LDL lowering did not improve calf muscle perfusion in PAD. One important limitation to the use of gadolinium in MRI perfusion studies is the risk of nephrogenic systemic fibrosis in patients with chronic kidney disease and a glomerular filtration rate less than 30ml/min/1.73m2 (8).
Arterial spin labeling (ASL) is an MRI technique initially conceived in the 1990’s (9) that is capable of quantifying perfusion in a spatially and temporally resolved fashion without the use of exogenous contrast (10). Water in arterial blood is given a different longitudinal magnetization from the surrounding tissue which decays with T1. Therefore the magnetically labeled water in arterial blood acts as a tracer wherein inflowing blood is tagged and the rate at which it enters the imaging plane is measured. One acquires both tagged and control images to take advantage of the different states of magnetization seen with inflowing arterial blood compared to the surrounding static (9;10) tissue. The use of ASL to measure calf muscle perfusion in patients with PAD was first described by Wu et al. (11) who used a continuous ASL technique in the setting of thigh tourniquet occlusion to measure post-ischemic reactive hyperemia using the endpoints of peak hyperemic flow and time-to-peak perfusion.
In the present study, we aimed to determine if ASL MRI using a pulsed ASL technique would reliably and reproducibly quantification calf muscle perfusion measured at peak plantar flexion exercise. Furthermore, we studied whether ASL MRI could differentiate patients with PAD from normal subjects.
Methods
Study Design
We recruited normal subjects without known cardiovascular disease between the ages of 30 and 85. The normal volunteers had no history of tobacco use, hyperlipidemia or diabetes and were free from any exercise induced symptoms. Patients with PAD were recruited from the vascular lab and were between the ages of 30 and 85 years with symptoms of intermittent claudication and an ankle-brachial index (ABI) between 0.4 and 0.9 measured during the screening period. Exclusion criteria included rest pain, critical limb ischemia, contraindication to MRI, or pregnancy. All subjects provided written informed consent prior to study enrollment. The study protocol was approved by the Human Investigation Committee at the University of Virginia.
Study Protocol
Magnetic resonance protocol
All subjects performed supine plantar flexion exercise using a pedal ergometer (5) until exhaustion or limiting symptoms. Images were obtained immediately following end-exercise using a flexible calf coil in a Siemens 3T Trio. Patients with PAD had their most symptomatic leg studied. A metronome was used to guide the rate of exercise at 50 rpm. At end-exercise, 15 averaged arterial spin labeled images were acquired using a pulsed ASL pulse sequence with single-shot echo-planar imaging readouts (field of view 200×200 mm, matrix 64×64, repetition time 4000 ms, echo time 32 ms, slice thickness 10 mm). Pulsed arterial spin labeling was performed using the proximal inversion with control for off-resonance effects (PICORE) technique (12), which labels blood proximal to the imaged slice. Two potential sources of error in perfusion quantitation using pulsed ASL are the variable transit delay of spins from the labeling region to the imaging slice and the contamination of the perfusion signal by intravascular blood flowing through the slice. The QUIPSS II with thin-slice TI1 periodic saturation (Q2TIPS) technique minimizes these errors by applying a train of saturation pulses at the distal edge of the labeled region, thus producing a well-defined temporal bolus (13). The Q2TIPS technique was used in this study, with the train of saturation pulses starting at 700 ms (inversion time 1) and ending at 1600 ms (saturation stop time), with the overall inversion time (inversion time 2) set to 1800 ms. (Figure 1). The signal averaging was performed with motion correction. In order to verify reproducibility, repeat testing on different days was performed in a group of 12 subjects (5 NL, 7 PAD).
Figure 1. Post-exercise ASL calf muscle perfusion in a normal volunteer [A] and PAD subject [B].

Shown is an axial image of the calf belonging to a normal volunteer [A] with increased muscle blood flow seen in red for both the anterior tibialis (arrow) and gastrocnemius muscles (double arrow). For the PAD subject [B] the axial image shows increase calf muscle blood flow in the gastrocneumius (thin arrow).
Data analysis
Perfusion was measured on post-processing relative blood flow axial images on a Leonardo workstation (Siemens Healthcare, Erlangen, Germany) by placing a region of interest in the calf muscle area with the greatest signal intensity. Care was taken in placement of the region of interest in the calf muscle to avoid the periphery of the muscle group where there can be contamination of blood flow with nearby vessels or artifact at the edge of the imaging plane. Data analysis was performed by two readers (AMW, RJ) for measurement of inter-observer variability. The relative blood flow images were quantitative perfusion maps given in ml/min-100g that were calculated during the online image reconstruction using a standard ASL model (14).
Statistical Analysis
Primary outcome measures were peak calf muscle perfusion and plantar flexion exercise time. All patients’ baseline characteristics were presented as mean±SD for continuous variables and n (%) for categorical variables. Interobserver agreement was measured with intra-class correlation coefficient. Comparisons between normals and PAD MRI and results were done with unpaired t-test. The exercise time data was not normally distributed based upon the Kolmogorov-Smirnov test for normality. Therefore, the exercise times between PAD and NL were compared using a Wilcoxon sum-of-ranks test. Inter-quartile ranges (IQR) for the exercise times were reported. All statistical analyses were performed using PASW Statistics 18, release version 18.0.0 (SPSS Inc, Chicago IL).
Results
Patients
The baseline patient characteristics for the study are presented in Table 1. There were 15 normal subjects (ages 54±9), five of whom had ABI testing with normal mean of 1.08±0.06, 15 PAD patients (ages 65±5, p<0.001 for age) with mild-moderate PAD (ABI 0.70±0.14) and an additional 5 normal subjects (ages 52±6) who exercised to a predetermined matched time of those with PAD (240 seconds).
Table 1.
Subject Characteristics
| Characteristic | PAD (n=15) | Normals (n=15) | Normals, matched exercise (n=5) |
|---|---|---|---|
| Age - yr | 64±9 | 54±9 | 52±6 |
| Ankle Brachial Index | 0.70±14 | N/A | N/A |
| Male sex – n (%) | 6(40) | 7(47) | 2(40) |
| Active Tobacco Use | 8(53) | 0 | 0 |
| Former Tobacco Use | 3(20) | 0 | 0 |
| Hypertension | 12(80) | 0 | 0 |
| Diabetes | 7(47) | 0 | 0 |
| Prior lower extremity stent | 5(33) | 0 | 0 |
| Prior lower extremity bypass surgery | 3(20) | 0 | 0 |
Quantitative Calf Muscle Perfusion
In the normal subjects, the anterior tibialis (9/15) and gastrocnemius (6/15) were the calf muscles with the highest calf muscle perfusion. In contrast, for all PAD subjects, the calf muscle with the highest perfusion was the anterior tibialis. Peak exercise calf perfusion (mean±SD) (Table 2) was higher in the normals (80±23mL/min-100g) than in PAD (49±16mL/min-100g, p<0.001). The normals exercised for longer (median, 660 s, IQR 320–912 s) than the PAD subjects (195 s, IQR 135–285 s, p<0.005). However, the 5 additional normals who performed exercise matched to PAD (240 s) demonstrated higher perfusion (84±25mL/min-100g, p<0.002) than those with PAD. In the 12 studies of test-retest reliability, average group perfusion on the 2 different days was 69±31mL/min-100g and 66±32mL/min-100g and intra-class correlation coefficient 0.87 (95% CI 0.61–0.96). Interobserver agreement was excellent with an intra-class correlation coefficient of 0.96 (95% CI 0.84–0.99). Box-plot (Figure 2) demonstrates the difference in median perfusion between normals and PAD subjects.
Table 2.
MRI results
| PAD (n=15) | NL (n=15) | NL matched exercise time (n=5) | |
|---|---|---|---|
| Exercise time, sec | 195 s, IQR 135–285 s | 660 s, IQR 320–912 s * | 240 |
| Peak perfusion, mL/min-100g | 48±16 | 80±23* | 84±25* |
p < 0.01 vs PAD
Values are listed as median + inter-quartile range (IQR) for exercise time and mean±SD for peak perfusion
Figure 2. Box plot of median peak exercise calf muscle perfusion in normals and PAD subjects.
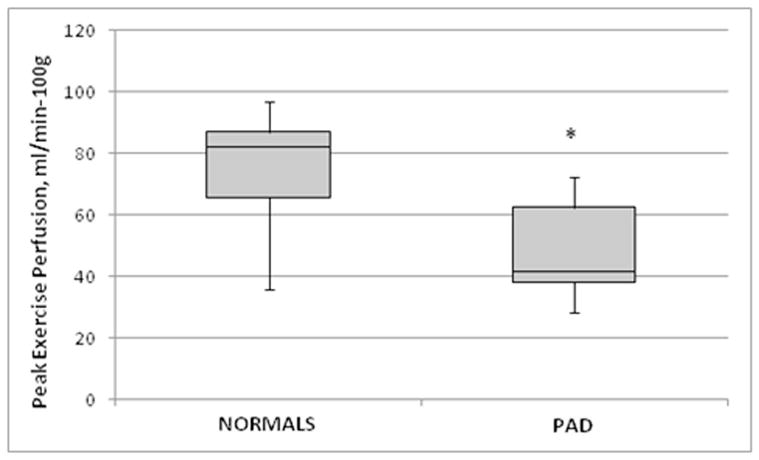
The down whisker represents the first quartile minus the minimum value and up whisker represents the maximum minus the third quartile.
The peak exercise perfusion data for the normal subjects alone at the 2 time points was 99.0±19 and 94±18 mL/min-100g, intra-class correlation coefficient of 0.80 and the PAD subjects was 47±16 and 46±23 mL/min-100g, intra-class correlation coefficient of 0.78. The maximal exercise times for the study population as a whole had a median of 200s (IQR 152–332s) and on repeat testing was 232s (IQR 172–357s), with intra-class correlation coefficient of 0.98.
Discussion
This study examined a group of normal volunteers and patients with PAD using ASL MRI to quantitatively determine calf muscle perfusion at peak exercise without the use of exogenous contrast. We found that quantitative perfusion using ASL could be reliably obtained in both normals and those with PAD. Inter-observer agreement was excellent. We found a significant difference between peak calf muscle perfusion in normals and PAD subjects. In the normal subjects whose exercise time was matched to that of the PAD subjects, calf muscle perfusion was similarly higher. These findings are similar to that found by gadolinium-enhanced measures (7). One advantage to ASL based measures of calf muscle perfusion is the avoidance of administering intravenous gadolinium, particularly since a significant number of patients with PAD have chronic kidney disease. Those with severe chronic kidney disease are are not candidates for gadolinium due to concerns for nephrogenic systemic fibrosis. In addition ASL MRI offers the advantage of avoiding the need for intravenous access and directly quantify perfusion rather than using signal intensity in the muscle after contrast infusion as a surrogate measure of blood flow.
There are four types of ASL preparations which differ by the technique used to magnetically label the inflowing blood (15): 1) pulsed ASL (PASL), 2) continuous ASL (CASL), 3) pseudo-continuous (PCASL) and 4) velocity-selective ASL (VS-ASL). We chose the pulsed ASL technique which uses short radio-frequency pulses in the tagging plane to invert a thick region of spins (16) using the PICORE technique (12). Advantages of PASL imaging include a higher inversion efficiency and lower radio-frequency power deposition than other techniques (14). The Q2TIPS method improves the peripheral imaging by applying a train of radiofrequency saturation pulses during a pre-specified time period, which reduces systematic errors resulting from variable arterial transit delay and from contamination by intravascular signal (17).
In order to measure calf muscle blood flow with either ASL or contrast-enhanced techniques, a region of interest is placed in the calf muscle group which showed the greatest change in signal intensity after exercise. In 70% of our study subjects, the muscle group exercised by the pedal ergometer was the anterior tibialis, with the remainder using the gastrocnemius. In clinical trials, patients serve as their own controls and the same muscle group studied at baseline would need to be followed over time. An alternative approach to calf muscle exercise is measuring hyperemia after thigh occlusion. The latter technique could reduce the variability in muscle group stimulation that can be seen with plantar flexion exercise which depends in part upon exactly how the subject performs the exercise. However, exercise may be more physiologically relevant than occlusion/hyperemia, especially in the setting of PAD since it is exercise-induced symptoms (claudication) that is the hallmark of the disease.
A recent study by Wu et al. (11) was the first report using CASL to measure calf muscle perfusion in patients with varying degrees of PAD. The CASL technique uses long, continuous radio-frequency pulses in a constant gradient field wherein the spins are continuously inverted as they travel through the inversion plane (14), resulting in a higher perfusion sensitivity than PASL. One important limitation to the current CASL technique is the need for continuous radiofrequency transmit hardware that may limit its application to research scanners. Wu et al. (11) used a tourniquet system with a thigh cuff to create ischemia-hyperemia and measured peak hyperemic flow as well as time-to-peak. They found a graded dependence of the time-to-peak with the severity of PAD measured by ABI, however the peak hyperemic flow was relatively preserved until the ABI was less than 0.7. There are three key differences between the present study and that of Wu et al. (11); 1) we used a PASL sequence not optimized for time to peak measurements, 2) instead of thigh occlusion we studied patients at peak plantar flexion exercise while in the scanner, and 3) we report reproducibility and inter-reader reliability data. The thigh occlusion technqiue may be more physiologically relevant in PAD patients given their exercise limitation. However, the two techniques of stressing the calf in the MRI environment have not yet been compared head-to-head.
Ultrasound is another imaging modality used in patients with PAD to evaluate perfusion. A recent study used contrast ultrasound calf muscle perfusion imaging (18) with microbubbles to evaluate arterial perfusion reserve in normals and patients with PAD using transient arterial occlusion. One of the challenges in using time-to-peak measurements is the bias introduced by changes in patient hemodynamic factors such as volume status and cardiac output which may change over time. A study by Lindner et al, used contrast-enhanced ultrasound with intravenous injection of lipid-shelled octafluoropropane microbubbles to study microvascular blood flow in the gastrocnemius and soleus muscles at rest and after 2 minutes of plantar flexion exercise (19). They found that after correcting for diabetes, the only diagnostic tests that predicted severity of lower extremity PAD were contrast-enhanced exercise blood flow and perfusion reserve. At this point, we are unable to measure perfusion reserve with ASL MRI due to low resting blood flow in the calf muscle and insensitivity to the low flows due to low signal-to-noise ratios. The strengths of ultrasound for calf muscle perfusion include portability and lack of contraindications to patients with implanted ferrous metal. Future studies are needed to compare contrast enhanced ultrasound and MRI methods for the evaluation of skeletal muscle perfusion in PAD.
Limitations
In order to determine an area under the curve for test characteristics of ASL calf muscle perfusion we would need to have invasive arterial monitoring with the use of microspheres to quantify perfusion in-vivo. This study has been done in small number of animals (20) which showed clear agreement between ASL calf muscle perfusion and microsphere measurements.
PAD patients were older than normal subjects by 10 years on average. This age difference could influence the average calf muscle perfusion seen in the two groups as age is known to affect calf perfusion measures (21). In a small study (21) of 6 young (26±2 years old) versus 6 older (70±2 years old) subjects, there as a significant difference in peak exercise calf muscle perfusion measured with ASL between the groups (60 ± 7 mL/100 g/minute versus 43 ± 10 mL/100 g/minute, respectively). However, it is unlikely that a 10 year age difference could account for the extent of the difference between the normals and PAD seen in our study.
Given time constraints, we studied only the most symptomatic leg for calf muscle perfusion. We are unable to measure work expenditure during the plantar-flexion exercise using the current ergometer. Future studies will incorporate revisions to the ergometer where workload can be monitored.
Despite the promising contrast-enhanced ultrasound data using perfusion reserve (19), with the current ASL technique, we are unable to measure resting calf muscle perfusion, however this is challenging even with MRI contrast-enhanced techniques due to low resting calf blood flow (22). At present, we do not have kinetic data for blood volume and mean transit time. Future ASL pulse sequences, including spiral data acquisition may facilitate obtaining this data.
Conclusions
Arterial spin labeling MRI using a pulsed ASL sequence is a reproducible, non-contrast technique for quantifying peak exercise blood flow in calf muscle. ASL MRI is able to discriminate between normal volunteers and patients with PAD independent of exercise time. This technique may be useful in clinical trials of therapies aimed at improving calf muscle perfusion in patients with PAD.
Acknowledgments
Funding sources: Supported by National Heart Lung Blood Institute R01 HL075792 (CMK), and National Institute of Biomedical Imaging and Bioengineering T32 EB003841 (AMW).
We would like to acknowledge the contributions of Jayne Missel RN, the University of Virginia Vascular Lab and Josef Pfeuffer of Siemens Health Care.
Abbreviations
- ABI
ankle-brachial index
- ASL
arterial spin labeling
- NL
normal subject
- MRI
magnetic resonance imaging
- PAD
peripheral arterial disease
Footnotes
Disclosures: Drs. Meyer, Epstein, and Kramer receive research support from Siemens Healthcare.
Reference List
- 1.Lloyd-Jones D, Adams R, Brown TM, et al. Heart disease and stroke statistics—2010 update: a report from the American Heart Association Statistics Committee and Stroke Statistics Subcommittee. Circulation. 2010;121:e46–e215. doi: 10.1161/CIRCULATIONAHA.109.192667. [DOI] [PubMed] [Google Scholar]
- 2.Criqui MH, Langer RD, Fronek A, et al. Mortality over a period of 10 years in patients with peripheral arterial disease. New Engl J Med. 1992;326:381–386. doi: 10.1056/NEJM199202063260605. [DOI] [PubMed] [Google Scholar]
- 3.McDermott MM, Liu K, Greenland P, et al. Functional decline in peripheral arterial disease: associations with the ankle brachial index and leg symptoms. JAMA. 2004;292:453–461. doi: 10.1001/jama.292.4.453. [DOI] [PubMed] [Google Scholar]
- 4.Gardner AW, Skinner JS, Cantwell BW, Smith LK. Prediction of claudication pain from clinical measurements obtained at rest. Med Sci Sports Exerc. 1992;4(2):163–170. [PubMed] [Google Scholar]
- 5.Isbell DC, Epstein FH, Zhong X, et al. Calf muscle perfusion at peak exercise in peripheral arterial disease: measurement by first pass contrast-enhanced magnetic resonance imaging. J Mag Reson. 2007;25:1013–1020. doi: 10.1002/jmri.20899. [DOI] [PMC free article] [PubMed] [Google Scholar]
- 6.Anderson JD, Epstein FH, Meyer CH, et al. Multifactorial determinants of functional capacity in peripheral arterial disease: uncoupling of calf muscle perfusion and metabolism. J Am Coll Cardiol. 2009;54:628–635. doi: 10.1016/j.jacc.2009.01.080. [DOI] [PMC free article] [PubMed] [Google Scholar]
- 7.West AM, Anderson JD, Epstein FH, et al. LDL lowering does not improve calf muscle perfusion, energetics, or exercise performance in peripheral arterial disease. J Am Coll Cardiol. 2011;58:1068–1076. doi: 10.1016/j.jacc.2011.04.034. [DOI] [PMC free article] [PubMed] [Google Scholar]
- 8.Kribben A, Witzke O, Hillen U, Barkhausen J, Daul AE, Erbel R. Nephrogenic systemic fibrosis: pathogenesis, diagnosis and therapy. J Am Coll Cardiol. 2009;53:1621–1628. doi: 10.1016/j.jacc.2008.12.061. [DOI] [PubMed] [Google Scholar]
- 9.Detre JA, Zhang W, Roberts DA, et al. Tissue specific perfusion imaging using arterial spin labeling. NMR Biomed. 1994;7:75–82. doi: 10.1002/nbm.1940070112. [DOI] [PubMed] [Google Scholar]
- 10.Williams DS, Detre JA, Leigh JS, Koretsky AP. Magnetic resonance imaging of perfusion using spin inversion of arterial water. Proc Natl Acad Sci USA. 1992;89:212–216. doi: 10.1073/pnas.89.1.212. [DOI] [PMC free article] [PubMed] [Google Scholar]
- 11.Wu W-C, Mohler E, Ratcliffe SJ, Wehrli FW, Detre JA, Floyd TF. Skeletal muscle microvascular flow in progressive peripheral arterial disease: assessment with continuous arterial spin-labeling perfusion magnetic resonance imaging. J Am Coll Cardiol. 2012;53:2372–2377. doi: 10.1016/j.jacc.2009.03.033. [DOI] [PMC free article] [PubMed] [Google Scholar]
- 12.Wong EC, Buxton BB, Frank LR, et al. Implementation of quantitative perfusion imaging techniques for functional brain mapping using pulsed arterial spin labeling. NMR Biomed. 1997;10:237–249. doi: 10.1002/(sici)1099-1492(199706/08)10:4/5<237::aid-nbm475>3.0.co;2-x. [DOI] [PubMed] [Google Scholar]
- 13.Luh WM, Wong EC, Bandettini PA, Hyde JS. QUIPSS II with thin-slice TI1 periodic saturation: a method for improving accuracy of quantitative perfusion imaging using pulsed arterial spin labeling. Magn Reson Med. 1999;41:1256–1264. doi: 10.1002/(sici)1522-2594(199906)41:6<1246::aid-mrm22>3.0.co;2-n. [DOI] [PubMed] [Google Scholar]
- 14.Wang J, Licht DL, Jahng G-H, et al. Pediatric perfusion imaging using pulsed arterial spin labeling. J Magn Reson Imag. 2003;18:404–413. doi: 10.1002/jmri.10372. [DOI] [PubMed] [Google Scholar]
- 15.Pollock JM, Tan H, Kraft RA, Whitlow CT, Burdette JH, Maldjian JA. Arterial spin labeled MRI perfusion imaging: clinical applications. Magn Reson Imaging Clin N Am. 2009;17(2):315–338. doi: 10.1016/j.mric.2009.01.008. [DOI] [PMC free article] [PubMed] [Google Scholar]
- 16.Edelman RR, Siewert B, Darby DG, et al. Qualitative mapping of cerebral blood flow and functional localization with echo-planar MR imaging and signal targeting with alternating radiofrequency. Radiology. 1994;192:513–520. doi: 10.1148/radiology.192.2.8029425. [DOI] [PubMed] [Google Scholar]
- 17.Noguchi T, Yoshiura T, Hiwatashi A, et al. Quantitative perfusion imaging with pulsed arterial spin labeling: a phantom study. Magn Reson Med Sci. 2007;6(2):91–97. doi: 10.2463/mrms.6.91. [DOI] [PubMed] [Google Scholar]
- 18.Amarteifio E, Weber MA, Wormsbecher S, et al. Dynamic contrast enhanced ultrasound for assessment of skeletal muscle microcirculation in peripheral arterial disease. Invest Radiol. 2011;46(8):504–508. doi: 10.1097/RLI.0b013e3182183a77. [DOI] [PubMed] [Google Scholar]
- 19.Lindner JR, Womack L, Barrett EJ, et al. Limb stress-rest perfusion imaging with contrast ultrasound for assessment of peripheral arterial disease severity. JACC Cardiovasc Img. 2008;1:343–350. doi: 10.1016/j.jcmg.2008.04.001. [DOI] [PMC free article] [PubMed] [Google Scholar]
- 20.Pohmann R, Kunnecke B, Fingerle J, von Kienlin M. Fast perfusion measurements in rat skeletal muscle at rest and during exercise with single-voxel FLAIR (flow-sensitive alternating inversion recovery) Magn Reson Med. 2006;55:108–115. doi: 10.1002/mrm.20737. [DOI] [PubMed] [Google Scholar]
- 21.Wray DW, Nishiyama SK, Monnet A, Duteil S, Carlier PG, Richardson RS. Multiparametric NMR-based assessment of skeletal muscle perfusion and metabolism during exercise in elderly persons: preliminary findings. J Gerontol A Biol Sci Med Sci. 2009;64(9):968–974. doi: 10.1093/gerona/glp044. [DOI] [PMC free article] [PubMed] [Google Scholar]
- 22.Jiji RS, West AM, Epstein FH, et al. Reproducibility of contrast enhanced calf muscle perfusion MRI measures in peripheral arterial disease. Circulation. 2011;124:A11374. [Google Scholar]