

The Kennedy pathway and the Lands cycle are two principal metabolic modules of glycerolipid metabolism. This work examines the crosstalk of these two pathways and shows that loss of Lands cycle activity leads to an enhanced de novo phosphatidylcholine PC synthesis through the Kennedy pathway and PC turnover in Arabidopsis developing seeds.
Abstract
It has been widely accepted that the primary function of the Lands cycle is to provide a route for acyl remodeling to modify fatty acid (FA) composition of phospholipids derived from the Kennedy pathway. Lysophosphatidylcholine acyltransferase (LPCAT) is an evolutionarily conserved key enzyme in the Lands cycle. In this study, we provide direct evidence that the Arabidopsis thaliana LPCATs, LPCAT1 and LPCAT2, participate in the Lands cycle in developing seeds. In spite of a substantially reduced initial rate of nascent FA incorporation into phosphatidylcholine (PC), the PC level in the double mutant lpcat1 lpcat2-2 remained unchanged. LPCAT deficiency triggered a compensatory response of de novo PC synthesis and a concomitant acceleration of PC turnover that were attributable at least in part to PC deacylation. Acyl-CoA profile analysis revealed complicated metabolic alterations rather than merely reduced acyl group shuffling from PC in the mutant. Shifts in FA stereo-specific distribution in triacylglycerol of the mutant seed suggested a preferential retention of saturated acyl chains at the stereospecific numbering (sn)-1 position from PC and likely a channeling of lysophosphatidic acid, derived from PC, into the Kennedy pathway. Our study thus illustrates an intricate relationship between the Lands cycle and the Kennedy pathway.
INTRODUCTION
Glycerolipid molecules serve as basic structural elements of cellular membrane systems and a major form of energy reserve in seeds. A comprehensive picture of the separate enzymatic steps leading to the biosynthesis of principal phospholipid molecules and triacylglycerol (TAG) was first formulated by Kennedy (1961), and the eponymous pathway describing glycerolipid synthesis has been one of the hallmarks of lipid biochemistry. Using acyl-CoA and stereospecific numbering (sn)-glycerol-3-phosphate (G3P) as primary substrates, the Kennedy pathway begins with stepwise acylation of G3P catalyzed by two fatty acyltransferases, acyl-CoA:sn-glycerol-3-phosphate acyltransferase (GPAT) and acyl-CoA lysophosphatidic acid acyltransferase (LPAAT), leading to the formation of phosphatidic acid (PA). Phosphatidic acid phosphatase (PAP) subsequently catalyzes the dephosphorylation of PA to generate diacylglycerol (DAG). The synthesis of phosphatidylcholine (PC) is accomplished by the transfer of phosphocholine from cytidine-5′-diphosphate (CDP)-choline to DAG (Kennedy and Weiss, 1956). DAG is also an immediate precursor for TAG biosynthesis through the acyl-CoA–dependent acylation of the sn-3 position by diacylglycerol acyltransferase. TAG can also be formed independent of acyl-CoA donors by phospholipid:diacylglycerol acyltransferase (PDAT), which transfers an acyl group from the sn-2 position of PC to the sn-3 position of DAG to yield TAG (Banaś et al., 2000; Dahlqvist et al., 2000; Zhang et al., 2009). A fascinating aspect of glycerolipid biosynthesis is that there often exists an asymmetric distribution of fatty acid (FA) molecules between the sn-1 and sn-2 positions: Saturated and monounsaturated FAs are normally found at sn-1, whereas polyunsaturated fatty acids (PUFAs) are enriched at sn-2. Pioneering work on plant acyltransferases has shown that GPATs and LPAATs are not only stereo-specific with regard to acylation of the glycerol backbone but also selective in terms of acyl-CoA donors (Griffiths et al., 1985; Ohlrogge and Browse, 1995; Oo and Huang, 1989; Bourgis et al., 1999; Kim and Huang, 2004; Kim et al., 2005). Therefore, the substrate specificity of the acyltransferases of the Kennedy pathway is one of the determining factors of the composition of glycerolipid molecules.
In addition to the acyl-CoA selectivity of GPAT and LPAAT, the fatty acyl diversity of glycerolipids is also governed by the Lands cycle (Lands, 1958). The Lands cycle is one of the major routes of PC acyl remodeling or acyl exchange (Bates et al., 2007, 2009). The concept has its origin from a key observation of Lands during a 14C-tracer experiment of PC synthesis that the ratio of labeled FA versus glycerol in PC was much higher than that in TAG (Lands, 1958). This has since been attributed to the rapid turnover of the sn-2 acyl moiety of phospholipids, which is accomplished through a metabolic cycle that first involves deacylation of PC to produce lysophosphatidylcholine (LPC), followed by reacylation of LPC to regenerate PC (Lands, 1960). The deacylation step was proposed to be the function of phospholipase A2 (PLA2), and the reacylation of LPC has been shown to be mediated by lysophosphatidylcholine acyltransferase (LPCAT). Acyl exchange at the sn-2 of PC can produce a new PC molecule different in fatty acyl chains, but in contrast with the de novo glycerolipid pathway, which includes incorporation of glycerol backbone, the Lands cycle does not lead to net gain of glycerolipid molecules (Bates et al., 2009; Shindou and Shimizu, 2009). In plants, there is an alternate acyl editing route that operates through CoA:PC exchange and also involves LPCAT. The reversibility of the LPCAT is significant, and the combined forward and reverse reactions of LPCAT could, by itself, achieve acyl exchange (Stymne and Stobart, 1984; Yurchenko et al., 2009).
The primary function of the Lands cycle is believed to provide a metabolic route allowing de novo–synthesized PC to undergo maturation in the remodeling pathway (Hill and Lands, 1970; Shindou and Shimizu, 2009). Recent progress in plants has implicated acyl editing in incorporating nascent FA 18:1cisΔ9 (18:1) into PC (Bates et al., 2007, 2009) and trafficking newly synthesized FAs from the exteriors of the plastids to other intracellular compartments (Bessoule et al., 1995; Tjellström et al., 2012). Active acyl exchange has been shown to be particularly active in developing cotyledons of several species (Slack et al., 1977; Stymne and Glad, 1981; Stymne and Stobart, 1984) and was proposed to exert control over the FA composition of the acyl-CoA pool (Stobart et al., 1983; Stymne et al., 1983; Stymne and Stobart, 1984; Pérez-Chacón et al., 2009; Astudillo et al., 2011). A shared principal enzymatic component of the two acyl editing mechanism in plants is LPCAT, the molecular identity of which remained elusive until very recently. The molecular cloning of the Arabidopsis thaliana lysophospholipid acyltransferase genes, LPLAT1 and LPLAT2 (Ståhl et al., 2008), homologous to the yeast YOR175c of the membrane-bound O-acyltransferase family enzymes involved in Lands cycle (Benghezal et al., 2007; Chen et al., 2007; Jain et al., 2007; Riekhof et al., 2007; Tamaki et al., 2007), provides a molecular handle to delineate the functional significance of acyl editing in plant lipid metabolism. Evidence suggesting a specific role of LPCAT2 in generating PC for TAG synthesis via PDAT has been recently reported (Xu et al., 2012).
It is clear that incorporation of newly synthesized FAs into storage lipids in seeds is much more complicated than simply a linear metabolic pathway of G3P-PA-DAG-TAG. The DAG that originated from G3P through the de novo pathway is rapidly converted to PC and then reconverted back to DAG before it is eventually channeled to TAG (Bates et al., 2007, 2009; Bates and Browse, 2011, 2012). Hence, there is exquisite spatial and temporal coordination of various routes of fatty acyl flux pertinent to glycerolipid assembly. Given the existence of many kinetically distinctive routes of DAG and PC interconversion, the dynamics of these metabolites could potentially involve interaction of the Kennedy pathway and the Lands cycle. Indeed, an implicit assumption of a close coordination between the two pathways can be made as it was observed that the acyl exchange system was stimulated under conditions in which the Kennedy pathway was operating (Stymne et al., 1983). However, this has never been explored in any eukaryotic systems. In this study, we systematically dissected metabolic alterations of glycerolipid biosynthesis of Arabidopsis deficient in LPCAT to address the central question of crosstalk between the Kennedy pathway and the Lands cycle.
RESULTS
Differential Expression Patterns of the LPCATs
To avoid confusion and in accordance with conventional nomenclature for Arabidopsis genes, we follow the naming of LPCAT1 and LPCAT2 for At1g12640 and At1g63050 (Xu et al., 2012). The two genes have a similar structure, both containing eight exons and seven introns with their deduced amino acid sequences showing a sequence identity of 91%. To investigate their temporal and spatial expression patterns, promoter fragments of the LPCAT genes were fused with β-glucuronidase (GUS) reporter gene. GUS activity analysis of the transgenic lines showed that the LPCAT1 promoter was active in the seedling, rosette leaves, petals, and stigma (Figures 1A to 1D). During seed development, LPCAT1 promoter activity could also be detected at the chalazal endosperm and at the later developmental stage, the vascular bundles in silique coat as well (Figures 1E and 1F). When compared with LPCAT1, LPCAT2 promoter activity was much stronger in developing embryos, from early to late stages of seed development (Figure 1). LPCAT2 was also particularly active in pollen grains (Figures 1I and 1J). A preferential expression pattern of LPCAT2 in developing seeds was also evident based on information available at the Arabidopsis eFP browser (http://www.bar.utoronto.ca/; Winter et al., 2007).
Figure 1.

LPCATs Are Expressed in Various Tissues.
Promoter:GUS fusion analysis of LPCAT1 ([A] to [F]) and LPCAT2 ([G] to [L]) reveals distinct patterns of spatial expression. Tissues in (A) to (E) and (G) to (K) from the T2 generation and tissues in (F) and (L) from the T1 generation were analyzed. The LPCAT1 promoter was active in the seedling (A), rosette leaves (B), flower, particularly in sepals (white arrow in [C]) and stigma (black arrow in [C]), the chalazal endosperm (white arrowheads in [E] and [F]) from the globular stage (E) to the mature cotyledon stage (F), and the vascular bundle in the silique coat (white arrow in [F]). The LPCAT2 promoter was active in the seedling (G), rosette leaves (H), and anthers of flowers (black arrow in [I]), particularly pollen grains (black arrows in [J]). During seed development, the LPCAT2 promoter activity was maintained in both endosperm and embryo (white arrow in [K] and inset in [L]) from the globular stage (K) to the mature cotyledon stage (L). Bars = 1 mm (A) and (G), 1 cm in (B) and (H), 200 μm in (C), (D), (F), (I), (J), and (L), and 20 μm in (E), (K), and inset in (L).
Seed FA Composition Phenotype of the lpcat Mutants
We identified homozygous T-DNA insertion knockout mutants, lpcat1 (SALK_123480), lpcat2-2 (SAIL1213_G01), and lpcat2-3 (SALK_004728), using two gene-specific primers and the T-DNA left border primers (Alonso et al., 2003) (see Supplemental Figure 1A online). Insertion site of lpcat1 was located in the seventh exon of LPCAT1, whereas the lpcat2-2 and lpcat2-3 mutants had insertions at the first and the eighth exon of LPCAT2, respectively (see Supplemental Figure 1B online). The lpcat2-2 and lpcat2-3 alleles are different from the lpcat2 allele reported by Xu et al. (2012). Double mutants were generated from a cross of lpcat1 × lpcat2-2. The lpcat1 lpcat2-2 was confirmed to be a null mutant for both genes as full-length transcript of neither LPCAT1 nor LPCAT2 was detectable (Figure 2A). We also attempted a cross between lpcat1 and lpcat2-3, but for reasons that remain unknown, we failed to recover any double mutant.
Figure 2.

Alterations in Seed FA Composition Correlate with Transcript Abundance of LPCATs.
(A) and (C) RT-PCR analysis revealed the deficiency of full-length transcripts of LPCAT1 and LPCAT2 in homozygous lpcat1 lpcat2-2 double mutant (A) and accumulated transcripts of both LPCAT1 and LPCAT2 in their respective overexpressed transgenic lines (C). 18S rRNA was used as an internal positive control. OE1-3 and OE1-6 represent two lines overexpressing LPCAT1; OE2-8 and OE2-9 represent two lines overexpressing LPCAT2. Control indicates the line transformed with an empty vector. WT, the wild type.
(B) and (D) FA composition in mature seeds of lpcat1 lpcat2-2 (B) and overexpression lines (D). Minor FAs were omitted. Data represent mean and sd of at least four independent biological replicates. Asterisks indicate significant difference at P < 0.05 compared with the wild type based on Student’s t test.
Data on rosette leaf FA composition of the single and double lpcat mutants are presented in Supplemental Table 1 online. There were no discernable differences in FA compositions of vegetative tissues under standard growth conditions (see Supplemental Table 1 online) nor were there significant differences in seed oil content of mature seed (see Supplemental Figure 2 online). Consistent with a weak expression profile of LPCAT1 in developing seed, the FA composition of lpcat1 was very close to that of the wild type, except a slight increase of 20:1 (4.4% higher) and a minor decrease of 18:3cisΔ9,12,15 (α-18:3) (2.4% lower) (see Supplemental Table 2 online). This weak FA phenotype was detected in all four batches of seeds raised at different times. It is noteworthy that evidence of a minor phenotype of lpcat1 in seed FA composition was also indicated by Xu et al. (2012). By contrast, the lpcat2-2 and lpcat2-3 mutants exhibited a more clear phenotype, with a decreased proportion of 18:2cisΔ9 (18:2) (10 and 9.5% lower) and an increased proportion of 20:1cisΔ11 (20:1) (see Supplemental Table 2 online). The lpcat1 lpcat2-2 double mutant displayed a FA phenotype with an additional increased proportion of 20:1 (23.4% in lpcat1 lpcat2-2 versus 18.1% in the wild type) and further reduction of PUFAs, including 18:2 and α-18:3 (42.4% in lpcat1 lpcat2-2 versus 46% in the wild type) (Figure 2B; see Supplemental Table 2 online).
To seek additional evidence of a direct relationship between mutant FA compositional changes and the function of the LPCATs, we produced transgenic suppression lines using RNA interference (RNAi) (see Supplemental Figure 3 online). In keeping with the mutant lines, TAG in seeds of the RNAi lines had reduced 18:2 and increased 20:1 (see Supplemental Table 3 online). We also generated transgenic lines that overexpressed LPCAT1 and LPCAT2 under the control of the constitutive 35S promoter (Figure 2C). The overexpression lines had a decreased 20:1 and elevated 18:2 (Figure 2D), both of which were opposite of the FA compositional change in the insertion mutants. The metabolic consequence resulting from overexpression of either LPCAT1 or LPCAT2 was similar (Figure 2D), suggesting that when ectopically expressed these two genes exert comparable metabolic functions. Taken together, these results show that there was indeed a causal relationship between LPCATs and the seed FA composition phenotype.
FA Stereo-Specific Distribution Changes in TAGs
FA composition of TAGs by simple gas chromatography (GC) analysis is often insufficient to portray the full extent of metabolic alterations in glycerolipid assembly of mutants (Katavic et al., 1995) because it does not reveal positional shift of FAs in TAG. Table 1 and Supplemental Table 4 online present data from stereo-specific analysis of TAG isolated from wild-type and lpcat1 lpcat2-2 mature seeds, tallying FA distribution at each of the three positions (set A) and each FA distribution across all three positions (set B). Both sets of data in wild-type seed illustrated predominant distributions of 18:2 and 18:3 at the sn-2 position of TAG. The proportion of 18:1 was fairly evenly distributed across three positions. In the TAG of lpcat1 lpcat2-2, although it had a comparable level of total 18:1, there was a decrease (6.4%) of this FA at the sn-2 position and an increase (6.8%) at the sn-3 position (set B; Table 1). PUFAs, including 18:2 and 18:3, on the other hand, had substantially decreased 18:2 (5.8%) and 18:3 (6.2%) at the sn-1 position but minor changes at the other two positions. The decreases of 18:2 and 18:3 in TAG could hence be largely explained by their decreases at the sn-1 position (Table 1). The proportion of long-chain FA 20:1 was increased at both sn-1 and sn-3 positions in the double mutant (Table 1, set A), but the increase at the sn-1 position was greater than that at the sn-3 position (Table 1, set B). The distributions of saturated fatty acyls, 16:0 and 18:0, were increased at the sn-1 position, and this was contrasted by their markedly decreased distributions at the sn-3 position.
Table 1. Stereo-Specific Analysis of TAG Fractions from Mature Seeds.
| FA Composition (Mol %) |
|||||||
| 16:0 | 18:0 | 18:1 | 18:2 | 18:3 | 20:1 | ||
| Set A | |||||||
| The wild type | TAG | 9.2 | 4.0 | 16.3 | 30.0 | 16.8 | 15.8 |
| sn-1 | 17.3 | 4.7 | 16.5 | 31.2 | 18.1 | 9.7 | |
| sn-2 | 0.9 | 0.4 | 15.1 | 49.5 | 29.0 | 0.6 | |
| sn-3 | 9.3 | 6.9 | 17.4 | 9.3 | 3.3 | 37.2 | |
| lpcat1 lpcat2-2 | TAG | 8.0 | 3.6 | 16.5 | 28.5 | 15.1 | 19.8 |
| sn-1 | 20.6 | 6.6 | 16.5 | 25.4 | 11.9 | 14.0 | |
| sn-2 | 1.1 | 0.4 | 12.1 | 48.6 | 30.5 | 0.9 | |
| sn-3 | 2.1 | 3.9 | 21.0 | 11.4 | 2.7 | 44.4 | |
| Set B | |||||||
| The wild type | sn-1 | 63.0 | 40.0 | 33.7 | 34.7 | 35.7 | 20.3 |
| sn-2 | 3.3 | 2.5 | 30.7 | 55.0 | 57.7 | 1.3 | |
| sn-3 | 33.7 | 57.5 | 35.6 | 10.3 | 6.6 | 78.4 | |
| lpcat 1 lpcat2-2 | sn-1 | 86.2 | 61.1 | 33.3 | 29.8 | 26.5 | 23.8 |
| sn-2 | 5.0 | 2.8 | 24.3 | 56.8 | 67.5 | 1.5 | |
| sn-3 | 8.8 | 36.1 | 42.4 | 13.4 | 6.0 | 74.7 | |
Set A, distribution of FAs at each sn position; set B, distribution of each FA across all three sn positions. Minor FAs were omitted. Data shown are from one representative replicate, and another replicate is shown in Supplemental Table 4 online.
LPCAT Deficiency Leads to a Compromised Lands Cycle
Based on the distribution of labeled glycerol backbone and FAs in PC and TAG, Lands concluded that fatty acyl moieties were incorporated into PC independent of the de novo glycerolipid pathway (Lands, 1958). This proposition rested on the rationale that if the de novo–synthesized DAG and PC had a straightforward precursor-product relationship starting from G3P, the ratios of labels between the glycerol backbone and the FA should be constant among various glycerolipid molecules. As demonstrated widely in eukaryotic systems, this is not the case due to the input of the Lands cycle (Lands, 1958). To test the operation of the Lands cycle in lpcat1 lpcat2-2, we first determined LPCAT enzyme activity using microsomal preparations from developing siliques. Assessed through the forward reaction of LPC acylation, only 4% of LPCAT activity was detected in lpcat1 lpcat2-2 when compared with the wild type (Figure 3A). The steady state level of LPC, the substrate of LPCAT, was found at a level approximately threefold of that in the wild type based on lipidomic analysis (Figure 3B). Next, we conducted dual labeling using 14C-acetate and 3H-glycerol. Developing seeds at 9 to 10 d after anthesis were incubated in half-strength Murashige and Skoog (MS) medium containing 0.1 mM [14C]acetate and 0.2 mM [3H]glycerol under 300 μmol m−2 s−1 light, according to Slack et al. (1977). The labels in DAG and PC were monitored at 5 min after feeding. As shown in Figure 3C and Supplemental Table 5 online, wild-type developing seeds had a ratio of 14C/3H (FA versus backbone) in PC, approximately twofold of that in DAG (3.4 versus 1.7). In lpcat1 lpcat2-2, the PC displayed a 14C/3H ratio of 2.6, and the ratio in DAG was 2.2. This suggested that there was much closer precursor-product relationship between DAG and PC in the mutant.
Figure 3.

LPCAT Enzyme Activity and the Operation of the Lands Cycle Are Compromised in lpcat1 lpcat2-2 Developing Seeds.
(A) LPCAT enzyme assay from microsomal preparations of developing siliques. Data represent mean and sd of three independent biological replicates.
(B) The mol % of steady state LPC from developing seeds determined by ESI-MS/MS. Values are means and sd of five independent replicates.
(C) The distributions of fatty acyl moieties and backbone, which were double labeled with [14C]acetate and [3H]glycerol, in PC (black) and DAG (white) species. Labeled PC and DAG species were transmethylated so that 14C-labeled fatty acyl group and 3H-labeled backbone were counted separately. The comparison of the ratio of 14C/3H between PC and DAG in both the wild type and lpcat1 lpcat2-2 after 5 min labeling is shown. Data represent mean and sd of two independent biological replicates. The absolute radioactivity is shown in Supplemental Table 5 online.
(D) Stereochemical distribution of [14C]acyl chains in PC labeled with [14C]acetate reveals asymmetric distributions between sn-1 (black) and sn-2 (white) positions in the wild type and relatively even patterns in lpcat1 lpcat2-2. Three time points 5, 15, and 45 min, were monitored. Data represent mean and sd of two independent biological replicates. The absolute radioactivity is shown in Supplemental Table 6 online.
To track the distribution of newly synthesized FAs, we then examined the stereo-specific incorporation of FAs into PC through a 14C-acetate feeding experiment. In the wild type after 5 min of feeding, the level of the label at the sn-2 position of PC was more than twofold higher than that of the sn-1 position. This reflected the Lands cycle operation, which preferentially replaces fatty acyl moieties at the sn-2 position of PC (Figure 3D; see Supplemental Table 6 online). By contrast, the allotment of labeled acyl chains in lpcat1 lpcat2-2 between the two positions of PC displayed a relatively even pattern, with 54 and 46% of the labels associated with sn-1 and sn-2, respectively (Figure 3D). It was also observed that the relative sn-1 to sn-2 positional labeling equilibrated in lpcat1 lpcat2-2 by 45 min (Figure 3D). This stereo-specific pattern in PC of lpcat1 lpcat2-2 was comparable with that found in DAG from soybean (Glycine max) embryos (Bates et al., 2009). Taken together, these results provided direct in vivo evidence that the LPCATs participate in the Lands cycle.
Altered Partitioning of Newly Synthesized FAs in lpcat1 lpcat2-2
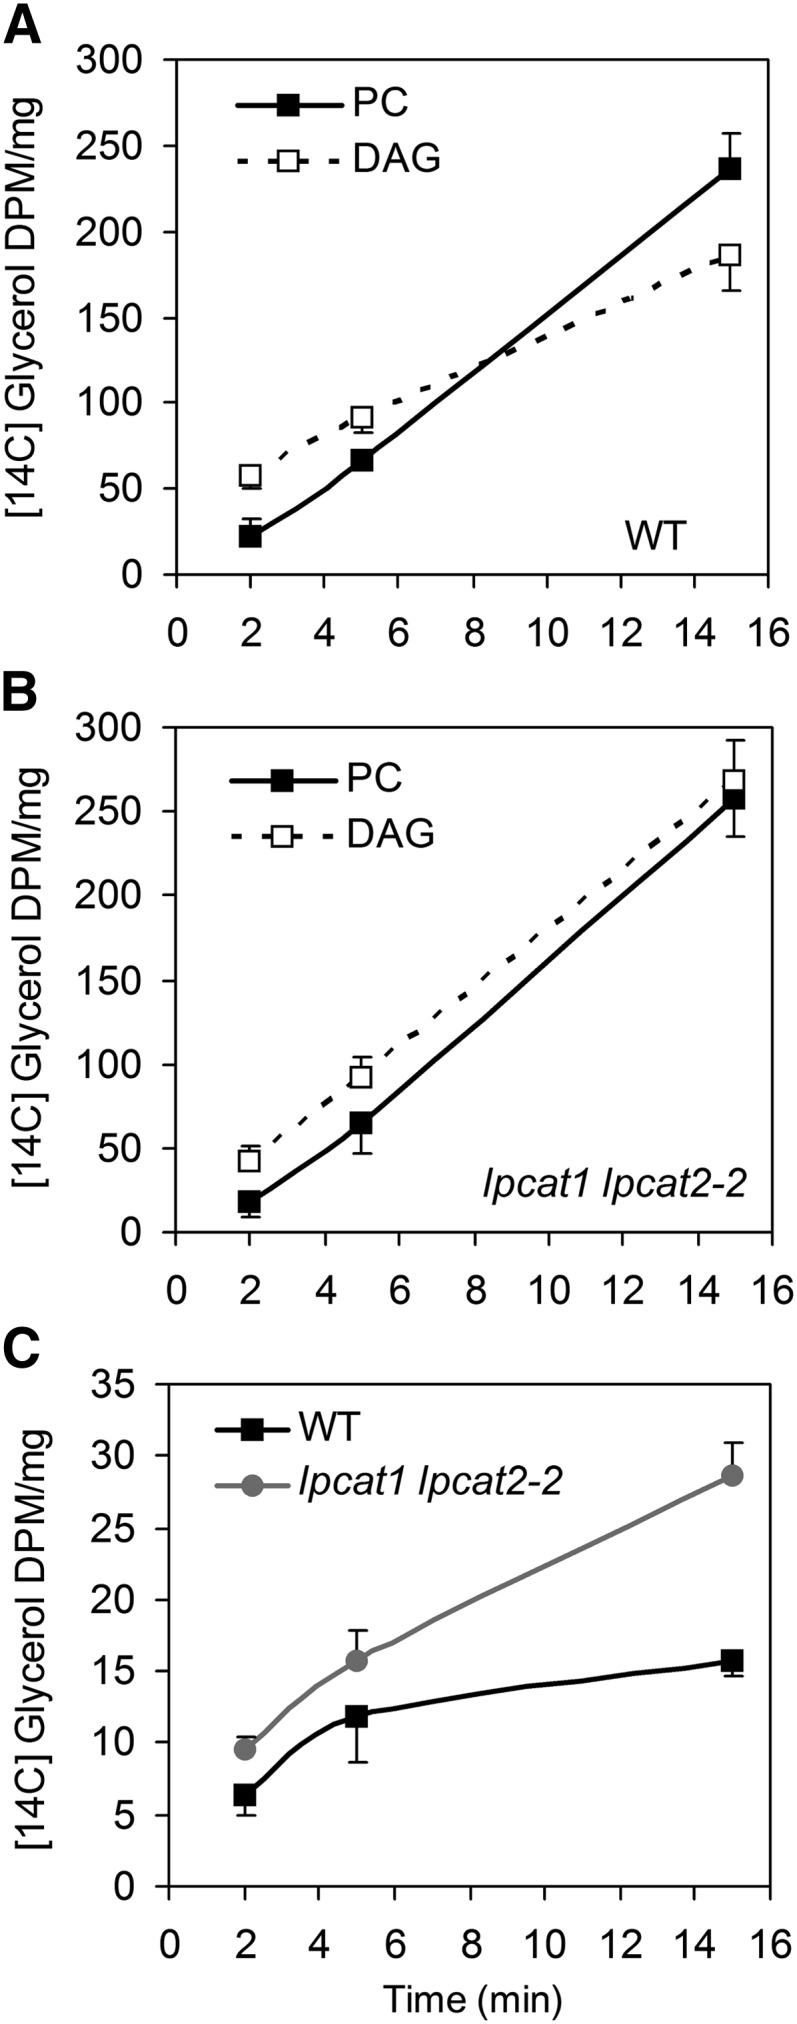
Newly synthesized FAs are primarily partitioned between the Kennedy pathway and the direct acylation of lysophospholipids into phospholipids (Bates et al., 2009). To investigate the consequence of a deficient Lands cycle on FA partitioning, we performed 14C-acetate feeding experiments. In wild-type seeds, the incorporation of 14C into both PC and DAG, presented as disintegrations per minute (DPM)/mg fresh weight, was linear during the incubation time, but the slope of increase in PC was much greater than that of DAG (Figures 4A and 4B). This was consistent with the notion that a large proportion of newly synthesized FAs enter PC (Bates et al., 2007, 2009; Tjellström et al., 2012). In lpcat1 lpcat2-2 seeds, close to parallel slopes of 14C incorporation into PC and DAG were observed (Figures 4C and 4D). Significantly, we found that the label in PC at 2 min was higher than that of DAG (Figure 4B) in wild-type seeds, whereas in lpcat1 lpcat2-2, the label in PC was at only about half of that in DAG (Figure 4D). When the labels in PC were compared between the wild type and lpcat1 lpcat2-2, the mutant seeds had ∼35% of labels of that in the wild-type seeds at the initial labeling of 2 min (Figure 4E). However, as the feeding duration extended, the increase of PC in lpcat1 lpcat2-2 gained pace, and by 45 min the PC reached a level that was close to 80% of that in the wild type (Figure 4E). Thus, the lower rate of PC production from newly synthesized FAs in lpcat1 lpcat2-2 was ameliorated with prolonged incubation time. Also, in contrast with the lesser labels in PC, the labeled DAG in lpcat1 lpcat2-2 was significantly higher, starting from 15 min, and reached almost twofold of that found in the wild type by 45 min (Figure 4F). The labels in PA and TAG were largely comparable between the wild type and lpcat1 lpcat2-2, and the total labels incorporated in glycerolipids were also similar (see Supplemental Figures 4A to 4C online).
Figure 4.

The Initial Incorporation Rates of Newly Synthesized FAs Are Affected in the lpcat1 lpcat2-2 Developing Seeds.
(A) to (F) The incorporations of [14C]acetate are presented in DPM/mg fresh weight. Predominant incorporation of 14C into PC is shown for the wild type (WT; [A] and [B]), and closer incorporation rates into PC and DAG are shown for lpcat1 lpcat2-2 ([C] and [D]). Two- to 45-min time course ([A] and [C]); 2- to 15-min course ([B] and [D]). Results in (E) and (F) represent relative levels of 14C in PC (E) and DAG (F) in lpcat1 lpcat2-2 compared with the wild type. Data represent mean and sd of two biological replicates.
(G) and (H) The incorporations of [14C]-18:1 during the time course of 5, 15, and 45 min are presented in the wild type (G) and lpcat1 lpcat2-2 (H) in DPM/mg fresh weight.
(I) and (J) Relative levels of 14C in PC (I) and DAG (J) in lpcat1 lpcat2-2 compared with the wild type. Data represent mean and sd of three biological replicates.
Given that nascent FAs exported from plastids are predominantly 18:1 (Pollard and Ohlrogge, 1999; Koo et al., 2004), we further validated the data of [14C]acetate feeding with [1-14C]-18:1, which can be directly incorporated into PC and DAG. This experiment recaptured several metabolic features uncovered in the 14C-acetate labeling. First, the 18:1 incorporation into PC in lpcat1 lpcat2-2 reached a level comparable to the wild type by the end of incubation period, despite that the initial incorporation (5 min) was only 0.6-fold of that in the wild type (Figures 4G to 4I). Second, the label in DAG was higher in lpcat1 lpcat2-2 seeds from as early as 5 min, and the increase became more evident as the labeling proceeded (Figures 4G, 4H, and 4J). Third, there was no reduction in the overall incorporation of 18:1 into total glycerolipids (see Supplemental Figure 4D online), reconfirming that the FA flux toward glycerolipid assembly as a whole was not decreased. These data suggested that in lieu of a reduced direct incorporation of nascent FAs for PC generation in lpcat1 lpcat2-2, FA flux toward DAG synthesis was enhanced and ultimately compensated for the decreased incorporation of acyl chains into PC.
The Flux toward de Novo PC Synthesis Is Enhanced in lpcat1 lpcat2-2
We next investigated PC synthesis through the Kennedy pathway by 14C-glycerol feeding, followed by examining the flux partitioning of the G3P backbone. In the wild type, labeled PC lagged behind DAG initially but accumulated quickly so that by 10 min the label in PC surpassed that in DAG (Figure 5A). In lpcat1 lpcat2-2, the label in PC, which was at a level comparable to the wild type on a fresh weight basis, was below that of DAG during the 15-min feeding experiment (Figure 5B). The lpcat1 lpcat2-2 seeds generated DAG at a much faster rate, at 150% of the wild type by 15 min (Figures 5A and 5B). We also observed a higher level of PA in lpcat1 lpcat2-2 (Figure 5C). Having concerns that some of the label could originate from the acyl moieties (Bates et al., 2009; Bates and Browse, 2011), we separated backbone fractions of the labeled PC, DAG, and TAG by transmethylation. The relative levels of these lipid molecules at 15 min were not affected by labels found in the acyl groups (see Supplemental Figure 5C online). No reduction of labels in TAG and total lipids was observed in lpcat1 lpcat2-2, indicating that DAG to TAG conversion was not compromised (see Supplemental Figures 5A and 5B online). Collectively, these results suggested that there was an enhanced flux through the de novo glycerolipid pathway in lpcat1 lpcat2-2.
Figure 5.
LPCAT Deficiency Affects the Flux into de Novo Glycerolipid Synthesis.
[14C]Glycerol backbone feeding during the time course of 2, 5, and 15 min. Presented as DPM/mg fresh weight, the kinetics of labeled PC and DAG are shown in the wild type (WT) (A) and lpcat1 lpcat2-2 (B). Comparison of labeled PA between the wild type and lpcat1 lpcat2-2 is presented in (C). Values are mean and sd of two biological replicates. Note: These values included small proportions of [14C]glycerol incorporated into acyl chains. Our analysis confirmed that the relative levels of PC, DAG, and TAG in the wild type and lpcat1 lpcat2-2 were not affected by labels in the acyl groups (see Supplemental Figure 5C online).
To assess PC synthesis, we further conducted a [methyl-14C]-choline feeding experiment. During the course of a 2-h incubation, the incorporation rate into PC on a fresh weight basis in lpcat1 lpcat2-2 was 1.5- to ∼1.8-fold greater than the wild type (Figure 6A). We also observed much higher incorporation of [14C]choline into LPC in the double mutant (Figure 6B). To rule out the potential effect of different endogenous choline levels in the wild type and lpcat1 lpcat2-2, which might result in different dilution factors for the added 14C choline, we measured free choline content and found that its level in lpcat1 lpcat2-2 (2.45 ± 0.32 nmol mg−1 fresh weight, n = 6, ±sd) was comparable to that in the wild type (2.03 ± 0.14 nmol mg−1 fresh weight, n = 6, ±sd). Together, these data confirmed that lpcat1 lpcat2-2 developing seeds had an increased flux of de novo PC synthesis from DAG.
Figure 6.

Incorporation of [14C]Choline into PC and LPC in the lpcat1 lpcat2-2 Developing Seeds.
[14C]Choline feeding for 1 and 2 h shows that lpcat1 lpcat2-2 seeds contain higher 14C in PC (A) and LPC (B) compared with the wild type (WT). Data are presented as DPM/mg fresh weight. Values are mean and sd of three independent replicates.
Accelerated PC Turnover Occurs in lpcat1 lpcat2-2 Developing Seeds
Lipidomics analysis indicated that the steady state level of PC was not significantly different in lpcat1 lpcat2-2 (see Supplemental Figure 6 online). Since the level of PC is governed by de novo synthesis as well as breakdown, we investigated PC turnover in lpcat1 lpcat2-2 developing seeds by pulse-chase experiment. After labeling for 1 h with [methyl-14C]-choline, followed by washing three times with fresh medium, the developing seeds (80 mg) were incubated in 2 mL of fresh medium containing 10 mM cold choline at room temperature. An aliquot of 500 μL seed and medium mixture was taken out at different time points, and for each aliquot, three 14C-containing fractions including total lipid (organic), intracellular water-soluble (aqueous), and extracellular (medium) pools were separately analyzed. The predominant component in the lipid fraction was PC, which, in both the wild type and lpcat1 lpcat2-2, displayed a slight increase in label at the beginning of the chase, presumably due to ongoing transfer of 14C into PC from precursor residuals inside the seeds (Figure 7A, Table 2). In the wild type, only a marginal decrease in PC label was observed after 8 h, the longest chase duration possible without significantly affecting tissue viability. By contrast, approximately one-third of the label from PC in lpcat1 lpcat2-2 was lost by the end of the chase, and this occurred despite the fact that the mutant contained much higher label in PC at the beginning of the chase (Figure 7A, Table 2). Since most choline and choline-derived metabolites (phosphoryl-choline and CDP-choline) were water soluble, choline label from PC turnover should be captured by the gain in the extracellular fraction and intracellular fraction. This was indeed the case as the combined labels of extracellular and intracellular water soluble fractions experienced little change in the wild type, whereas in lpcat1 lpcat2-2, the amount of decrease in PC could be almost entirely accounted for by the increased label in the other two fractions (Table 2; see Supplemental Table 7 online). When the extracellular and water-soluble fractions were subjected to thin layer chromatography (TLC), only free 14C-choline was detected (see Supplemental Figure 7 online). These results indicated that PC degradation was accelerated in lpcat1 lpcat2-2, leading to the deposition of free choline. The conclusion of a faster PC turnover in lpcat1 lpcat2-2 was also drawn from pulse-chase experiments with 14C-18:1. In the wild type, less than a quarter of the label associated with PC was lost after 4-h chase. In comparison, only one half of the label in PC was left in lpcat1 lpcat2-2 (Figure 7B; see Supplemental Figures 7 and 8 online). In this experiment, it was not possible to trace accurately the fate of the lost 14C-18:1, since it could be destined to multiple routes including deposition to neutral lipids.
Figure 7.

Accelerated PC Turnover in lpcat1 lpcat2-2.
(A) After 1-h pulse labeling with [14C]choline, the chase was conducted in nonlabeled medium. The labels in PC at 0, 1, 4, and 8 h were determined. Values are mean and sd of two independent replicates. WT, the wild type.
(B) The chase was conducted after a 45-min pulse labeling with [14C]-18:1. The labels in PC were determined at 0, 1, 2, and 4 h. Data are representative of two independent experiments, and another replicate is shown in Supplemental Figure 8 online.
Table 2. Accelerated PC Turnover in lpcat1 lpcat2-2 Developing Seeds.
| Chase Time (h) |
|||||||
| Set A | Fractions | 0 | 1 | 4 | 8 | ||
| The wild type | Extracellular and water soluble | 20,867 ± 212 | 19,173 ± 521 | 20,801 ± 571 | 20,636 ± 123 | ||
| PC | 2,851 ± 245 | 2,686 ± 60 | 3,013 ± 30 | 2,588 ± 88 | |||
| LPC | 232 ± 20 | 314 ± 59 | 395 ± 56 | 364 ± 37 | |||
| lpcat1 lpcat2-2 | Extracellular and water soluble | 24,811 ± 901 | 26,030 ± 153 | 27,959 ± 1,068 | 27,560 ± 636 | ||
| PC | 5,258 ± 440 | 5,892 ± 118 | 4,864 ± 529 | 3,381 ± 175 | |||
| LPC | 787 ± 65 | 1,055 ± 27 | 979 ± 94 | 724 ± 125 | |||
| Set B | |||||||
| The wild type | Extracellular and water soluble | 87.4 ± 0.9 | 86.5 ± 0.1 | 85.9 ± 0.4 | 87.5 ± 0.4 | ||
| PC | 11.7 ± 1.0 | 12.1 ± 0.1 | 12.4 ± 0.2 | 11.0 ± 0.3 | |||
| LPC | 0.9 ± 0.1 | 1.4 ± 0.2 | 1.6 ± 0.3 | 1.5 ± 0.1 | |||
| lpcat1 lpcat2-2 | Extracellular and water soluble | 80.4 ± 0.3 | 78.9 ± 1.2 | 82.8 ± 1.5 | 87.1 ± 1.1 | ||
| PC | 17.0 ± 0.2 | 17.9 ± 0.2 | 14.3 ± 1.7 | 10.7 ± 0.7 | |||
| LPC | 2.6 ± 0.4 | 3.2 ± 0.1 | 2.9 ± 0.3 | 2.3 ± 0.4 | |||
Developing seeds (80 mg) were incubated for 1 h in 1 mL of half-strength MS medium containing 1 μCi [methyl-14C]choline and then washed three times, followed by incubation in 2 mL of fresh medium containing 10 mM nonradioactive choline at room temperature. At each time point, an aliquot of 500 μL mixture including seeds and medium was removed for analysis. Set A indicates the absolute radioactivity (DPM) in each fraction when normalized as 20 mg developing seeds; set B indicates percentage of 14C in each fraction. Values are mean of two biological replicates. The data for separate extracellular and water-soluble fractions are presented in Supplemental Table 7 online.
Genes Involved in PC Synthesis and Degradation Are Upregulated in lpcat1 lpcat2-2
To search further clues of metabolic alterations in lpcat1 lpcat2-2, the transcriptome of developing seeds was surveyed using the Affymetrix ATH1 gene chip. As expected, the transcripts of LPCAT1 and LPCAT2 were detected at extremely low levels in lpcat1 lpcat2-2 (see Supplemental Data Sets 1 and 2 online). The main focus of the transcriptome analysis was on the expression of genes involved in PC synthesis and degradation. Previous observations indicated that there was a meaningful correlation between pathways and the transcript abundance of genes encoding enzymes involved in PC metabolism (Eastmond et al., 2010). In lpcat1 lpcat2-2, all three members of the phosphoethanolamine N-methyltransferase (PEAMT) family were substantially upregulated, highlighted by a 3.8-fold elevation of PEAMT3, and 1.4- and 1.3-fold increases in PEAMT1 and PEAMT2. This suggested that an increased demand of choline was a part of the metabolic adjustment in lpcat1 lpcat2-2 since PEAMT is crucial for PC synthesis in mediating the step of choline synthesis in Arabidopsis (Eastmond et al., 2010). In addition, slightly increased transcript levels of CTP-PHOSPHOCHOLINE CYTIDYLTRANSFERASE1 (CCT1) and CCT2, considered to have a substantial effect in PC biosynthesis, were also detected (see Supplemental Data Sets 1 and 2 online).
In terms of genes involved in PC degradation, we specifically inspected those grouped into PLA (Ryu, 2004) and phospholipase D (PLD) (Wang, 2000) families. The Arabidopsis PLA superfamily has been classified into four groups (Ryu, 2004; Chen et al., 2011): PC hydrolyzing PLA1, PA-preferring PLA1, secretory PLA2 (sPLA2), and the patatin-like PLA (PAT-PLA). Among the 27 PLA family members, transcripts of sPLA2-α and the three PAT-PLAs (PAT-PLA-IIβ, PAT-PLA-IIIα, and PAT-PLA-IIIδ) were all significantly upregulated in the lpcat1 lpcat2-2 seeds (see Supplemental Data Sets 1 and 2 online). sPLA2-α has been shown to be specific for sn-2 position of PC hydrolysis (Lee et al., 2005), and in vitro studies on PAT-PLAs have also revealed their greater preference for the sn-2 than the sn-1 position in PC hydrolysis (Rietz et al., 2010; Li et al., 2011). The increased transcript levels of these genes suggest that increased sn-2 deacylation of PC contributed to the maintenance of PC content in lpcat1 lpcat2-2. Twelve PLD family orthologs in the Arabidopsis genome were also surveyed. Most of the PLDs were unchanged in lpcat1 lpcat2-2, with the exception of the PLDα1 at 0.77-fold and PLDζ2 at 1.24-fold. However, neither of them was deemed statistically significant based on p-value (see Supplemental Data Sets 1 and 2 online).
We performed quantitative real-time PCR (qRT-PCR) on selected genes to verify the microarray data. Results from qRT-PCR analysis on all genes were strongly correlated with the microarray data (Figure 8). In the cases of CCT1 and PLDζ2, neither microarray data nor qRT-PCR result showed a statistically significant difference between the wild type and lpcat1 lpcat2-2 (Figure 8). Hence, transcript profiling data indicated that there was an enhanced choline synthesis, contributing to de novo PC synthesis as well as a substantially elevated expression of PLAs encoding enzymes known to be involved in PC deacylation.
Figure 8.

Genes Associated with PC Synthesis and Breakdown Are Upregulated in lpcat1 lpcat2-2.
The relative expression level of representative genes from the microarray data was verified by qRT-PCR. The transcript levels were normalized first to those of TUBULIN3 and then further normalized to the levels in the wild type (WT). Data represent mean and sd of five biological replicates. Asterisks indicate significant difference at P < 0.05 compared with the wild type based on Student’s t test.
The Accelerated PC Remodeling Process Alters the Composition of the Acyl-CoA Pool
The next area of investigation probed how the increased PC turnover impacted the acyl-CoA pool. Acyl-CoA esters extracted from the developing seeds were separated according to Larson and Graham (2001). Data are presented as mol % (Figure 9A), and two representative chromatographic traces for the wild type and lpcat1 lpcat2-2 are provided (Figure 9B). In the wild type, the predominant molecular species of acyl-CoA were 20:1 (21.4%) and 18:2 (20.0%), followed by 16:0 (16.1%) and α-18:3 (8.1%) (Figure 9A). Oleic acid (18:1), in spite of accounting for 75% of newly exported FAs from the plastid, represented only 5.4% of the molecular species in the acyl-CoA pool. There was a drastic readjustment in the acyl-CoA pool of lpcat1 lpcat2-2 developing seeds (Figure 9A). Specifically, 18:1-CoA increased almost fivefold to 25% of the total acyl species, a level that surpassed both 20:1 and 18:2 to become the most abundant acyl-CoA species. The 20:1-CoA and 18:2-CoAs were also increased. The levels of 18:3-CoA and 18:0-CoA were comparable to the wild type. Significantly, there was a nearly twofold reduction in the level of 16:0-CoA. Other molecular species of acyl-CoAs that were represented with a reduced proportion included 14:0, 20:0, and 22:1cisΔ13 (22:1). The 20:0-CoA and 22:1-CoA were detected at levels far exceeding the mol % that would have been expected based on their proportions in glycerolipids (Figure 9A). It is possible that the major proportion of these very long chain acyl-CoAs represent an acyl-CoA pool not accessible to the Kennedy pathway, such as serving as substrates for extracellular lipid synthesis. The acyl-CoA profiling data clearly demonstrated a widespread impact on the acyl-CoA composition in the lpcat1 lpcat2-2 developing seeds, confirming the previously proposed links between PC turnover and the acyl-CoA pool (Stymne et al., 1983).
Figure 9.

LPCAT Deficiency Impacts the Composition of the Acyl-CoA Pool.
(A) Comparison of mol % of the acyl CoA esters of the wild type (WT) and lpcat1 lpcat2-2 developing seeds reveals shifts in the composition of fatty acyl moieties. Data represent mean and sd of three independent replicates. Asterisks indicate significant difference at P < 0.05 compared with the wild type based on Student’s t test.
(B) Representative chromatographic traces of the wild type and lpcat1 lpcat2-2 are shown. ISTD, internal standard.
DISCUSSION
The Lands cycle is a membrane lipid remodeling process that is evolutionarily conserved among eukaryotes. Despite recent progress on the molecular cloning of its biochemical components (Benghezal et al., 2007; Chen et al., 2007; Jain et al., 2007, 2009; Tamaki et al., 2007; Hishikawa et al., 2008; Soupene et al., 2008; Ståhl et al., 2008; Zhao et al., 2008; Kazachkov et al., 2008), the metabolic significance of LPCAT in acyl lipid metabolism remains to be fully explored. LPCAT1 and LPCAT2 were the only two genes from Arabidopsis capable of complementing the yeast lca1Δ mutant in a functional screening (Zheng et al., 2012). Together with the finding that only minimal microsomal LPCAT enzyme activity was detected in lpcat1 lpcat2-2, it is reasonable to assume that LPCAT1 and LPCAT2 are the principal LPCATs in Arabidopsis. Extensive studies in acyl exchange during seed development have led to the proposal that one important aspect of LPCAT function is to channel newly synthesized FAs into PC for desaturation to PUFAs (Bates et al., 2007, 2009). The lpcat1 lpcat2-2 double mutant, possessing normal growth and seed development under standard growth conditions, provided an opportunity to test this notion directly. Comparison of seed FA profiles showed that reduction in FA desaturation in storage lipid, particularly 18:2, content was indeed correlated with a deficiency in LPCATs but the extent of alteration was hardly substantial (Figure 2). Beneath this modest reduction in overall FA desaturation was a disturbance in the Kennedy pathway of glycerolipid metabolism. Because of the high flux of FA synthesis, the developing seed of lpcat1 lpcat2-2 mutant provided an excellent system in which to address the interplay between the Kennedy pathway and Lands cycle; in turn, exploring this question in the context of acyl-editing has provided a deeper understanding of the processes influencing storage lipid biosynthesis in seed tissues.
To establish the framework that LPCATs are components of the Lands cycle, we applied the approach of dual labeling the glycerol backbone and FA that led to the original concept of the Lands cycle (Lands, 1958). As seen in the wild type, because replacement of acyl groups in PC occurs on an existing glycerol backbone, the ratio of labeled FA versus labeled glycerol backbone in PC is much higher than that in the DAG originating from the Kennedy pathway. In lpcat1 lpcat2-2, the ratio of labels in PC was still higher than that in DAG but the difference between PC and DAG was evidently subdued (Figure 3C). Previous studies have shown that kinetics of remodeling between the two acyl groups in PC is different. The sn-2 replacement occurs at a much faster pace, and as a result, PC is highly sn-2 labeled (Bates et al., 2007, 2009; Tjellström et al., 2012). This was confirmed in the wild-type developing seeds where the label at the sn-2 of PC was approximately twofold of that at the sn-1. Positional analysis of nascent 14C-FA incorporated in PC showed that the label of PC at the sn-2 in lpcat1 lpcat2-2 looked remarkably similar to that of DAG observed by Bates et al. (2009). The much closer precursor-product relationship in acyl groups in DAG and PC in the lpcat1 lpcat2-2 seeds provided direct in vivo evidence that the LPCATs participate in the Lands cycle.
The lpcat1 lpcat2-2 mutant had a much higher level of LPC, regardless of whether it was assessed through 14C-choline labeling or via total lipid analysis through electrospray ionization–tandem mass spectrometry (ESI-MS/MS). We note that even with the wild type, the 14C choline labeling data showed a much higher LPC/PC ratio (5%) than that of the lipidomic analysis (0.2%). In a similar experiment with rat blood cells, when 32P incorporation was monitored, the LPC was found to represent 25% of total label in lipids, although it contained <5% of total lipid phosphorus (Paysant-Diament et al., 1961). This was considered evidence demonstrating a unique metabolic activity of LPC in lipid metabolism (Lands, 1965). A likely scenario that explains the higher label in LPC would be one that newly generated PC from the de novo pathway undergoes faster deacylation than bulk PC. The PC regenerated from LPC reacylation is thus expected to be a part of the bulk PC that goes through a slower pace of turnover.
The proposed role of acyl remodeling has been largely focused on its participation in channeling nascent FA into PC (Bates et al., 2007, 2009). Our data that LPCAT1 and LPCAT2 are responsible for ∼60% incorporation of newly synthesized FAs into PC in wild-type Arabidopsis are in line with that proposition (Figure 4). Data presented here show that in lpcat1 lpcat2-2, despite a reduced initial incorporation rate of newly synthesized FAs into PC, the level of label in PC became comparable to the wild type as the duration of feeding was extended (Figure 4). Lipidomic data also showed that the steady state level of PC was not significantly changed in lpcat1 lpcat2-2. Existing knowledge of lipid biochemistry would attribute this metabolic adjustment to de novo PC biosynthesis. Direct evidence supporting an increased contribution from the de novo pathway to PC synthesis emerged from the 14C-choline feeding experiment where the lpcat1 lpcat2-2 had a PC synthesis rate much higher than that of the wild type (Figure 6). The higher choline incorporation rate detected in our experiment was not caused by different dilution factors of the added label in the mutant seed because we confirmed that the size of the endogenous choline pool in the mutant was not reduced. Furthermore, the expression of the PEAMT genes encoding a key enzyme of choline synthesis was induced in lpcat1 lpcat2-2 (Figure 9; see Supplemental Data Set 2 online). These results indicated that the metabolic response of increased de novo PC synthesis involves a series of highly orchestrated molecular steps (Tasseva et al., 2004; Keogh et al., 2009). The weak phenotype of reductions of 18:2 and 18:3 in the TAG of lpcat1 lpcat2-2 also supports the notion that Arabidopsis developing seeds have the capacity to channel 18:1 into PC for desaturation to 18:2 and 18:3 beyond the Lands cycle as well as metabolic plasticity for mobilizing PUFAs into TAG. Among the candidates participating in this process is the recently discovered phosphatidylcholine:diacylglycerol cholinephosphotransferase (PDCT), which converts the PC with unsaturated FA into DAG destined to TAG (Lu et al., 2009).
In light of the observed increase in de novo PC synthesis in lpcat1 lpcat2-2, one apparent question was what metabolic alterations contributed to the maintenance of steady state PC. Results shown here demonstrate that concurrent to the ongoing de novo PC synthesis in lpcat1 lpcat2-2 there was an acceleration of PC turnover. In 14C-choline pulse-chase experiments, we showed that in the mutant the label in PC was liberated into the aqueous, soluble form of free choline at a much faster pace than the wild type. This is analogous to what was previously observed in yeast where deficiency of LPCAT led to accelerated PC turnover and a much steeper decline of choline label in PC (Chen et al., 2007). A faster PC turnover in lpcat1 lpcat2-2 was also evident in pulse-chase experiments with 14C-18:1. Close to half of the label in PC was lost in the mutant, while under the same experimental conditions the wild type experienced a loss of less than a quarter of its label associated with PC. A faster rate of acyl group turnover from PC might lead to higher label in the free FAs; however, this would not be expected to be easily captured because competing pathways for 18:1 are much more complicated than that for choline.
A more challenging task was to understand how the increased PC turnover arises and from what step(s) of PC homeostasis. The PDCT reaction by itself would not result in a release of choline as was observed in the lpcat1 lpcat2-2 mutant. PLD and reversible aminoalcoholphosphotransferase (AAPT) could also contribute to an increased PC turnover. The increased release of choline during the PC remodeling process in particular raised the possibility of an increased PLD or AAPT contribution in converting PC to DAG in lpcat1 lpcat2-2. We detected no increase in the expression of either PLD or AAPT. Since a change in transcript level does not necessarily correlate with a change in enzyme activity, it is still possible that PLD or AAPT participates in the increased PC turnover in lpcat1 lpcat2-2. A third route of PC turnover is PC deacylation. PC deacylation can be achieved through both the reverse reaction of LPCAT that catalyzes the transfer of acyl group from PC into the acyl-CoA pool (Stymne and Stobart, 1984; Bafor et al., 1991; Ichihara et al., 1995; Yurchenko et al., 2009) and the action of PLA2. Under a subcellular context where the reverse reaction is compromised, the diminished reverse deacylation via LPCAT, as would have been expected in the lpcat1 lpcat2-2 mutant, could potentially result in a compensatory response from PLA2. Indeed, we detected significant upregulations at the transcript levels of four PLAs through transcriptome profiling. Greater enzymatic preference of these PLAs toward the sn-2 position revealed by previous studies (Rietz et al., 2010; Li et al., 2011) clearly raised the prospect of increased 1-acyl-LPC production during PC deacylation in the mutant. Therefore, the accumulated LPC in lpcat1 lpcat2-2 could be derived from a combination of defective LPC reacylation and an accelerated PC deacylation by PLA.
Besides modulating FA composition of PC, the Lands cycle is expected to influence the composition of the acyl-CoA pool. Results reported here show that there was drastically increased 18:1 in the acyl-CoA pool of lpcat1 lpcat2-2. A consistently higher level of very-long-chain FA (20:1) was also detected. This was likely an outcome of a larger intermediate pool of 18:1 available for elongation (Bao et al., 1998). The acyl-CoA profile analysis also yielded one surprise: The most significantly reduced acyl-CoA species was 16:0 (Figure 9), not the proportion of 18:2 and/or 18:3. This indicates that, as far as acyl-exchange is concerned, the metabolic alteration in lpcat1 lpcat2-2 was not simply a defect in the influx of 18:1 from 18:1-CoA into PC and an efflux of PUFAs from PC to the acyl-CoA pool. More significantly, the positional shifts of FA in the TAGs of double mutant cannot be fully explained by changes of acyl-CoA provision. For example, although there was a reduction of 16:0-CoA in the acyl-CoA pool, the level of 16:0 in TAG was increased at the sn-1 position. Furthermore, there was increased 18:2 in the acyl-CoA pool, but a decrease of this FA at sn-1 was found.
To rationalize the impact of LPCATs on a number of different routes of lipid metabolism in seeds, we present a conceptual model (Figure 10) that extends from previous studies (Bates and Browse, 2012) and attempt to account for metabolic changes in the fatty acyl-CoA pool as well as the stereo-specific redistribution of FAs in the TAG of lpcat1 lpcat2-2. This model operates with a framework emphasizing the Lands cycle as a branching loop adhered to the Kennedy pathway. In wild-type Arabidopsis, a large portion of the de novo synthesized FAs (mostly 18:1) is channeled into PC via LPCATs. In lpcat1 lpcat2-2, the loss of this route to generate PC leads to the metabolic adjustment of an enhanced de novo PC synthesis through the Kennedy pathway. The increased de novo PC synthesis in turn invokes an accelerated PC turnover so that a stable cellular PC content would be maintained. The PC turnover could be attributable at least in part to an increased deacylation of PC at the sn-2, possibly by PLA2. An attractive possibility in lpcat1 lpcat2-2 is that a portion of the LPA feeding into the Kennedy pathway comes from the LPC originated from the deacylation of PC. Since the sn-1 acylation through the Kennedy pathway prefers saturated FA (Griffiths et al., 1985), the de novo PC is expected to have the 16:0 almost exclusively at the sn-1. Hence, the simplest explanation for an increased 16:0 at the sn-1 of TAG is that an increased sn-2 deacylation leads to a decreased16:0 in the acyl-CoA pool and a higher retention of sn-1 16:0 in the glycerolipid flux destined for TAG synthesis. However, we caution that in wild-type developing seeds, it remains to be verified if the LPA derived from the Lands cycle contributes to the Kennedy pathway significantly and that a LPC-specific lysophospholipase has yet to be identified.
Figure 10.

Working Model of the Interplay between the Kennedy Pathway and the Lands Cycle.
This model summarizes the major steps of the Kennedy pathway and the Lands cycle. The Kennedy pathway encompasses TAG synthesis steps mediated by GPAT, LPAAT, PAP, and diacylglycerol acyltransferase, as well as the reaction steps of de novo PC synthesis. The Lands cycle, depicted by blue arrows, involves the deacylation of de novo–synthesized PC by PLA2 or the LPCAT reverse reaction and the reacylation of LPC to PC through LPCAT. Several alternative reactions, including PDCT, PLD + PAP, and the reversed reaction of AAPT, mediate PC-DAG interconversion. TAG synthesis can also be accomplished via PDAT. In the wild type, as shown in green arrows and lines, major flux of newly synthesized fatty acyl-CoAs (pool A, largely 18:1) is channeled through the sn-2 position of LPC by LPCAT. The FAs originating from PC deacylation mix with the nascent acyl-CoA to form pool B. In the lpcat1 lpcat2-2 mutant, compromised reacylation of 18:1 to LPC is indicated with a stop sign, while both the Kennedy pathway and PC deacylation route are enhanced. The dashed line in red denotes a potential route of LPC to LPA conversion catalyzed by an unidentified enzyme in plants.
The interconversion of PC and DAG represents a hub of metabolic interactions in lipid metabolism, which involves many enzymatic components of competing pathways that affect TAG synthesis in seed. Most notably, the PDCT presents a route of exchange of DAG moieties between distinctive pools of PC and DAG (Lu et al., 2009). The dgat1 mutant deficient in the acyl-CoA dependent conversion of DAG to TAG displayed a phenotype of reduced seed oil content and reduced very long chain FA 20:1 (Katavic et al., 1995; Routaboul et al., 1999; Zou et al., 1999). Contribution of an acyl-CoA–independent acylation of DAG involving PDAT has also been confirmed (Zhang et al., 2009). The PDAT reaction uses PC as acyl donor and concomitantly generates LPC. Very recently evidence has been presented suggesting a specific role of LPCAT2 in generating PC for TAG synthesis via PDAT (Xu et al., 2012). Since the PDAT reaction generates LPC, it concerns PC deacylation as well. If PDAT mainly targets LPCAT-derived PC, as a null mutant, lpcat1 lpcat2-2 should be severely impaired in generating substrate for PDAT. The implications of the above postulations are twofold: The increased PC turnover detected in lpcat1 lpcat2-2 does not involve PDAT and the contribution of PDAT to oil synthesis was incapacitated in lpcat1 lpcat2-2. Future studies will be required to verify these assumptions.
The Lands cycle has been detected across the eukaryotic systems and in various plant developmental stages. Whereas this study focused on LPCATs and highlighted the metabolic interplay between acyl-editing and de novo PC synthesis in seeds, an intriguing question remains: Why is the Lands cycle a necessary component of glycerolipid metabolism? In light of the rather subtle alterations of FA composition in the lpcat1 lpcat2-2 mutant, the view of the Lands cycle as a major factor in modulating FA composition in PC needs to be revised. The significant alterations in the acyl-CoA pool in the mutant appear to suggest that LPCATs are a component of the Lands cycle that shield fluctuations of the acyl-CoA pool from imminently affecting de novo DAG synthesis via the Kennedy pathway (Williams et al., 2000). This is of great significance because cellular membranes as well as signaling molecules of glycerolipid origin, most of which use DAG as substrate, will not suffer from any sudden changes in the acyl-CoA pool and certain developmental stages or environmental conditions will inevitably instigate fluctuations in the FA composition of the acyl-CoA pool. We must recognize, however, that the biological significance of glycerolipid assembly resides as much in the context of lipid metabolism as in the milieu of cell biology (Tian et al., 2008). Whether cells could take advantage of the Lands cycle to help adapt to stress conditions and whether the interplay between the Kennedy pathway and Lands cycle participate in shaping membrane systems and cellular signaling events remain intriguing questions for future investigations.
METHODS
Plant Material and Growth Conditions
All Arabidopsis thaliana plants used in this study were of the ecotype Columbia. lpcat1 (SALK_123480), lpcat2-2 (SAIL_1213_G01), and lpcat2-3 (SALK_004728) were obtained from the ABRC at Ohio State University (Alonso et al., 2003). Homozygous T-DNA insertions were verified using two gene-specific primers (LP1 and RP1 for SALK_123480; LP2 and RP2 for SALK_004728; and LP3 and RP3 for SAIL_1213_G01) and left border primers (LBa1 for SALK_123480 and SALK_004728 and LB1 for SAIL_1213_G01). All mutants were backcrossed with wild-type plants twice to purify their backgrounds. The lpcat1 lpcat2-2 double mutant was generated using lpcat1 as the pollen recipient and lpcat2-2 as the pollen donor. Homozygous double mutants were identified by PCR genotyping. For comparison, these single and double mutants were always grown along with the wild type. In this study, the developing seeds and developing siliques were collected at 9 to 10 d after flowering, when TAG accumulation was sharply increasing and the embryo almost occupied the whole space between the integuments (Baud et al., 2002). All Arabidopsis plants were grown at 22 to 24°C with a 16-h-light/8-h-dark photoperiod at 150 μmol m−2 s−1.
RT-PCR Analysis
Total RNA was extracted from different tissues (RNeasy mini plant kit; Qiagen), and cDNA was synthesized with SuperScript II reverse transcriptase (Invitrogen). To check the full-length transcripts, primers JW160/JW217 for LPCAT1 and JW162/JW218 for LPCAT2 were used for RT-PCR. The Arabidopsis 18S rRNA was amplified using primers 18S-F and 18S-R as internal positive controls. For quantitative real-time RT-PCR, 1 μg of total RNA was used for cDNA synthesis with a QuantiTect reverse transcription kit (Qiagen). Specific primers (temperature, 57 to 63°C) were designed to generate PCR products between 70 and 140 bp using NCBI Primer-BLAST (http://blast.ncbi.nlm.nih.gov/Blast.cgi). TUBULIN3 was used as an endogenous control for normalization. Reactions were performed with Power SYBR Green PCR Master Mix (Applied Biosystems) as previously described (Shen et al., 2010). The primers used for qRT-PCR are listed in Supplemental Table 8 online.
Microarray Analysis
Purified total RNA extracted from developing seeds was suspended in diethylpyrocarbonate-treated water to a final concentration of 500 ng/μL. Synthesis of cDNA, cRNA labeling, hybridization, and scanning were performed at the Botany Affymetrix Genechip Facility, University of Toronto, Canada. Three independent biological replicates were performed for both the wild type and lpcat1 lpcat2-2. The data were processed using robust multiarray analysis for background adjustment and normalization (Gentleman et al., 2004), and further details of the analysis were described by Shen et al. (2010).
Plasmid Construction and Arabidopsis Transformation
For gene-specific promoter fusions with the GUS reporter, the LPCAT1 and LPCAT2 promoter sequences containing ∼2.0 kb (amplified with primers JW193 and JW194) and 1.5 kb (amplified with primers JW175 and JW176) fragments immediately upstream of the start codons, respectively, were inserted into the PmeI-SpeI and SacI-BglII sites of the pER330 vector (Huang et al., 2009). The obtained plasmids were recombined by Gateway LR Clonase II enzyme (Invitrogen) into the entry vector pER367 (Huang et al., 2009), which contains the GUS cassette, resulting in the plasmids pCJ025 and pCJ022.
To construct the RNAi silencing vector, LPCAT1 and LPCAT2 gene-specific fragments were amplified by PCR using primers JW119-NotI/JW120-XmaI and JW115-XmaI/JW116-AscI, then subcloned into the NotI and AscI sites of pER367 vector sequentially to connect the two fragments together. The resultant plasmid was recombined with the Gateway system (Invitrogen) vector pH7GWIWG2 (II) containing the 35S promoter using the Gateway LR Clonase II enzyme, generating the plasmid pCJ011.
To generate constructs for ectopic expression, LPCAT1 and LPCAT2 cDNA fragments were amplified with cDNA from Arabidopsis rosette leaf total RNA using the primers JW160/JW217 (for LPCAT1) and JW162/JW218 (for LPCAT2). The resultant PCR fragments were subcloned between the NotI and AscI sites of entry vector pER367. The obtained pER367 harboring LPCAT1 or LPCAT2 cDNA was recombined with the destination vector pER330 under the control of the cauliflower mosaic virus 35S promoter using the Gateway LR Clonase II enzyme, and the resultant plasmids were designated pCJ027 and pCJ028. All of the primers used above are shown in Supplemental Table 9 online. For stable transformation, plants were transformed by the floral dip method (Clough and Bent, 1998) using Agrobacterium tumefaciens GV3101.
GUS Assay
Tissues were immersed in GUS staining solution (0.1 M sodium phosphate, pH 7.0, 1.0 mM potassium ferricyanide, 1.0 mM potassium ferrocyanide, 10 mM EDTA, and 50 mg X-Gluc dissolved in 1 mL DMSO) for incubation overnight at 37°C. Then, the stained tissues were washed with 70% ethanol to remove the chlorophyll.
FA Composition and Lipid Analysis
Seed FA profile and oil content measurement was adapted from the method of Li et al. (2006). About 5 mg of mature seeds was treated with 1 mL of 5% H2SO4 (v/v) in methanol at 80°C for 2 h. Fifty micrograms of C15:0 TAG was used as internal standard. The fatty acid methyl ester (FAME) extracts were analyzed by GC with a flame ionization detector on a DB-23 column. The total FAMEs were used to calculate the total oil for comparison purposes.
The FA composition in leaf tissues was determined according to previously described (Shen et al., 2010). The eighth leaf of each plant was heated in 2 mL of 10% methanol-KOH at 80°C for 2 h. After the mixture was cooled to room temperature, 1 mL of 6 n HCl was added, and the mixture was extracted twice with 2 mL of hexane. The extracts were dried under nitrogen stream and then supplemented with 2 mL of 3 n methanolic HCl (Supelco Canada) and heated at 80°C for 2 h. The FAMEs were extracted with hexane and determined by GC.
Total lipid extraction was performed according to the protocol from the Kansas Lipidomics Research Center (http://www.k-state.edu/lipid/lipidomics/AT-seed-extraction.html). Briefly, developing seeds were heated in 2 mL isopropanol with 0.01% butylated hydroxytoluene at 85°C for 10 min to inactivate lipases and then homogenized using a micropestle. Chloroform and methanol were added for extraction. After several rounds of extraction, the combined extracts were washed by 1 M KCl to remove proteins and carbohydrates. The final solvent was dried under nitrogen stream, and the lipid extract was dissolved in chloroform. For lipidomic analysis, 2 to 5 mg dry weight of developing seeds was used per replicate. ESI-MS/MS analysis was performed at the Kansas Lipidomic Research Center (Welti et al., 2002).
Microsomal Preparation and LPCAT Enzyme Activity Assay
The microsomal fractions were prepared according to method previously described (Stymne and Stobart, 1984). All manipulations were performed at 1 to 4°C. Briefly, ∼1 g developing siliques of the wild type and lpcat1 lpcat2-2 were collected, followed by grinding with buffer containing 0.1 M potassium phosphate, pH 7.2, 0.1% BSA, and 0.33 M Suc. The homogenate was filtered and centrifuged at 4000g for 10 min to remove tissue debris, and the supernatant was centrifuged at 12,000g for 40 min. The resulting supernatant was further centrifuged at 10,000g for 90 min. The microsomal fraction was resuspended in 0.1 M phosphate buffer by sonication and stored at −80°C until use.
The lysophospholipid acylation activity was determined based on procedures described previously (Zheng et al., 2012). The assay was conducted in reaction buffer containing 0.1 M potassium phosphate, 6 μM [14C]oleoyl-CoA (20 nCi/nmol), and 200 μM lysophospholipids. The reactions were initiated by adding 60 μg microsomal proteins into the prewarmed mixture at 30°C, followed by 4 min of shaking at 700 rpm on a thermomixer (Eppendorf). The reaction was stopped by the addition of acetic acid:water (5: 95, v/v, 170 μL) and chloroform:methanol (2:1, v/v, 500 μL), then immediate vortexing. After centrifugation, the lower (organic) phase was transferred and dried under nitrogen stream. The lipid residue was redissolved in chloroform (40 μL) and separated on silica G60 TLC plates (Merck) using a solvent system of chloroform:methanol:acetic acid:water (90:15:10:3, v/v/v/v). Phospholipid species were scraped off the TLC plate, and the radioactivities were determined by scintillation counter (Beckman Coulter LS6500).
Short Time-Course Labeling
[1-14C]Acetic acid-sodium salt (specific activity 55 mCi/mmol), [1-14C] 18:1 (specific activity 54 mCi/mmol), [14C (U)] glycerol (specific activity 150 mCi/mmol), and [methyl-14C]-choline chloride (specific activity 55 mCi/mmol) were from American Radiolabeled Chemicals. Individual time-course labelings were performed in separate glass tubes. Developing seeds were collected in ice-chilled glass tubes containing half-strength MS salts (Sigma-Aldrich) and 2% Suc. Seeds were preincubated under 300 μmol m−2 s−1 of light for 20 min and then transferred to 300-μL aliquots of fresh medium containing the following radiochemicals: 0.1 mM [14C]acetate (specific activity 55 nCi/nmol), 0.1 mM [1-14C]-18:1 (specific activity 54 nCi/nmol), 0.2 mM [14C]glycerol (specific activity 37.5 nCi/nmol), 20 μM [14C]choline (specific activity 55 nCi/nmol), with gentle shaking (80 rpm) for each time point. When labeled with [14C]-18:1, 0.1% tergitol (type Nonidet P-40; Sigma-Aldrich) was added to solubilize 18:1. The labeling reaction was quenched by adding 1 mL of 85°C isopropanol for 10 min, and lipid extraction was conducted as described above. When labeled with [14C]acetate, [14C]-18:1, and [14C]glycerol, ∼40 to 50 mg developing seeds were employed per time point of the analysis, and the extracted lipids were divided into two aliquots for neutral and polar lipid analysis. Neutral lipids were separated in the solvent system of hexane:diethyl ether:acetic acid (70:30:1, v/v/v). Polar lipids were separated by a two-dimension system, which included the first dimension as chloroform:methanol:50% NH4OH (65:25:2, v/v/v) and the second dimension as chloroform:methanol:acetic acid:water (85:15:10:3, v/v/v/v). Thirty milligrams of developing seeds were used for [14C]choline labeling, and only polar lipids were analyzed with a solvent system of chloroform:methanol:acetic acid:water (85:15:10:3, v/v/v/v). After the TLC plate was scanned with a radio-TLC imaging scanner (Bioscan AR-2000), individual spots were scraped off and their radioactivities were determined by scintillation counter (Beckman Coulter LS6500).
Dual Labeling with [3H]Glycerol and [14C]Acetate
Dual labeling with [3H]glycerol and [14C]acetate was conducted according to the methods described by Slack et al. (1977) with modifications. [2-3H]glycerol (specific activity 25 Ci/mmol) was supplied from American Radiolabeled Chemicals. About 40 to 50 mg of developing seeds was incubated in 300 μL of half-strength MS medium containing 0.1 mM [14C]acetate (specific activity 55 nCi/nmol) and 0.2 mM [3H]glycerol (specific activity 50 nCi/nmol) under 300 μmol m−2 s−1 of light. After the individual lipids were separated on TLC plates, DAG, PC, and TAG were scraped off and the lipids were eluted from TLC silica with 2.5 mL of choloroform/methanol (4:1, v/v). Then, 0.5 mL of methanol and 1 mL of 1 M KCl were added to give chloroform/methanol/water ratios of 2:1:1 (v/v/v). The organic phase (bottom) was removed and the aqueous phase (upper) was extracted twice with chloroform. The combined chloroform extracts were dried under nitrogen stream and heated in 2 mL 3 n methanolic HCl (Supelco Canada) at 80°C for 2 h. After the addition of 2 mL of 0.9% NaCl solution, the FAMEs were extracted three times with hexane. This procedure allowed the 14C and 3H radioactivity to be counted in FAME extracts and aqueous phase, respectively. The FAME extracts were transferred to scintillation vial and dried, and then scintillation fluid was added for radioactivity determination by scintillation counter. An aliquot of 500 μL aqueous phase was transferred to a scintillation vial for counting, and the total radioactivity of 3H was calculated based on the total volume of aqueous phase.
Pulse-Chase Labeling
To test PC turnover, a [14C]choline pulse-chase experiment was adapted according to previously described procedures (Chen et al., 2007). Eighty milligrams of developing seeds was incubated in 400 μL of half-strength MS medium containing 20 μM [14C]choline (specific activity 55 nCi/nmol) for 1 h under 100 μmol m−2 s−1 of white light. After washing three times with fresh MS medium to get rid of the extra [14C]choline, the seeds were further incubated in 2 mL nonradiolabeled medium containing 10 mM choline chloride at room temperature. A 500-μL aliquot of seed and medium mixture was removed at 0, 1, 4, and 8 h. After a gentle centrifugation, the supernatant medium was saved as the extracellular fraction. The seeds were weighed and used for lipid extraction. The extracted lower organic phase was dried and dissolved in 100 μL chloroform, which was the lipid fraction, for loading on TLC plates. The upper phase was saved separately as the water-soluble fraction. An aliquot of 500-μL water-soluble fraction was used for scintillation counting, and the total radioactivity was calculated based on the volume. Approximately 450 μL extracellular fraction was directly used for scintillation counting. The seed weight removed per aliquot was found to range from 18 to ∼20 mg, and the radiolabel measurement was normalized to 20 mg of seeds per time point. The [14C]choline-derived products in extracellular and water-soluble fractions were identified by separation on TLC plates using a solvent system containing methanol:0.5% NaCl:NH3·water (50:50:1, v/v/v). With this solvent system, the relative mobilities of phosphoryl-choline, CDP-choline, and GPC were higher than that of free choline. The TLC plates were fully scanned and then further scanned for the area excluding that of free choline to confirm no other radioactivity was recovered.
The [1-14C]-18:1 pulse-chase procedure was performed essentially as described above. Approximately 80 mg of developing seeds was pulsed in medium containing 0.1 mM [14C]-18:1 (specific activity 54 nCi/nmol) and 0.1% tergitol under 300 μmol m−2 s−1 of white light for 45 min, followed by washing three times. Two milliliters of 1 mM nonradiolabeled 18:1 was added for a 4-h chase. A 500-μL aliquot of seed and medium mixture was removed per time point as described above. The extracted lipids were separated by two-dimensional TLC, and PC was scraped off the TLC plates for radioactivity determination.
PC Acyl Group Stereochemistry
Stereochemistry analysis of PC was performed according to Bates et al. (2007). After elution from TLC silica, PC was dissolved in 1 mL of diethyl ether and 0.5 unit of PLA2 (Crotalus atrox; Sigma-Aldrich) in 0.1 mL 50 mM Tris-HCl, pH 9.0, and 5 mM CaCl2. The reaction was conducted at 42°C for 5 min and then the ether was evaporated under N2. The lipids were extracted with 3.8 mL of choloroform/methanol (2:1, v/v) and 1 mL of 0.15 M acetic acid. The organic phase was collected and separated on TLC plates developed with choloroform/methanol/acetic acid/water (85:15:10:3, v/v/v/v). The products LPC and free FAs representing sn-1 and sn-2 positions, respectively, were scraped off for scintillation counting.
Acyl-CoA Analysis of Developing Seeds
Acyl-CoAs of developing seeds were analyzed according to Larson and Graham (2001). Briefly, ∼30 mg of developing seeds (9 to 10 d after flowering) were collected and homogenized on a bead beater (Biospec Products) with one 3-mm glass bead (Fisher Scientific) for 1 min. After centrifugation, 20 μL 5 μM C17:0-CoA (internal standard), 200 μL freshly prepared extraction buffer (2 mL isopropanol, 2 mL 50 mM KH2PO4, pH 7.2, 50 μL glacial acetic acid, and 80 μL 50 mg/mL essentially FA-free BSA), and 400 μL petroleum ether saturated with isopropanol:water (1:1, v/v) were added to each sample. The samples were vortexed and centrifuged at 100g for 1 min, and then the upper phase was discarded. The lower phase was repeatedly washed with 400 μL petroleum ether four to seven times to get rid of pigments and lipid fractions, followed by the addition of 600 μL methanol:chloroform (2:1, v/v) and 5 μL saturated ammonium sulfate. Samples were vortexed briefly, incubated at room temperature for 20 min, and centrifuged at 12,000g for 2 min. The supernatant was transferred to 2-mL HPLC vials and dried under vacuum at room temperature. For derivatization, 100 μL of derivatizing agent (0.5 M chloroacetaldehyde in 0.15 M trisodium citrate/citric acid, pH 4.0, and 0.5% SDS) was added. The samples were incubated for 20 min at 85°C and filtered through a 0.45-μm nylon filter for HPLC assay. Samples were analyzed on an Agilent 1200 HPLC (Agilent Technologies) with LUNA-18(2) (150 mm × 2 mm × 5 S) column using the method described by Larson and Graham (2001). The acyl-CoA components were identified by acyl-CoA standards and compared with data of Larson and Graham (2001).
Regio-Specific Analysis of TAGs
Total lipids were extracted from 200 mg of mature seeds with 6 mL of chloroform/isopropanol (2:1, v/v) by homogenizing using a polytron for 45 s. For purification of TAG, the extraction was developed on a silica G60 TLC plate in hexane/diethyl ether/acetic acid (70:30:1, v/v/v) solvent. The TAG was recovered from silica gel by extraction with diethyl ether, and the total TAG content was recorded. The stereo-specific analysis of TAG was based on the partial degradation with Grignard reagent according to Christie (2003). TAG (40 mg) was dissolved in 2 mL of diethyl ether, and 1 mL freshly prepared 0.5 M ethyl magnesium bromide in diethyl ether was added. The mixture was shaken for 1 min, and then glacial acetic acid (50 μL) and water (2 mL) were added to stop the reaction, and the products were extracted with 10 mL of diethyl ether three times. The combined ether extracts were first washed with 1 mL of 2% aqueous potassium bicarbonate and 1 mL water. One milliliter of dichloromethane/benzene/methanol (1:1:1, v/v/v) was added to the washed ether fraction, and the mixture was dried under nitrogen stream. The Grignard products were dissolved in 500 μL of chloroform and applied to a 0.5-mm 20 × 20-cm silica gel 60 plate (EMD) containing 5% boric acid, developed in hexane/diethyl ether (1:1, v/v). Bands were visualized under UV light after spraying with 0.05% solution of primulin dye. The bands containing the 1,2- (or 2,3-) DAG and 1,3-DAG were scraped into a clean tube and eluted with diethyl ether. The DAG (1,2-DAG and 2,3-DAG) mixture was converted to PC derivatives according to Myher and Kuksis (1979). For PC preparation, 0.65 mL of chilled solution of chloroform/pyridine/phosphorus chloride (47.5:47.5:5 v/v/v) was added to 1 to 10 mg of DAG. The contents were mixed and allowed to stand for 1 h at 0°C and then 1 h at 25°C. The solution was then transferred to a tube containing 200 mg of choline chloride, followed by vigorous stirring for 15 h at 30°C and then for another 30 min after addition of 20 μL of water. After drying down, the products were extracted twice with 12 mL of chloroform/methanol/water/acetic acid (50:39:10:1, v/v/v/v) and partitioned with 4 mL of 4 M ammonia. The products PC were combined and added to 2 mL of dichloromethane/benzene/methanol (1:1:1, v/v/v) and dried down. PC positional analysis was then conducted as described above. Reaction products were separated on silica TLC plates and developed with chloroform/methanol/acetic acid/water (85:15:10:3, v/v/v/v). The spots corresponding to free FAs (sn-2, originally present in sn-2 position of TAG), LPC (sn-1, originally present in sn-1 position of TAG), and 2,3-PC were subjected directly to transmethylation and GC analysis. Reincubation of the recovered 2,3-PC with PLA2 did not result in any lyso-compounds, indicating complete hydrolysis of 1,2-PC. The distribution of FAs in the sn-3 position of TAG was calculated using the following formula: sn-3 (mol %) = [3 × TAG (mol %)] – [sn-1 (mol %)] – [sn-2 (mol %)]. According to Christie (2003), sn-2 position analysis of TAG was also conducted with lipase from porcine pancreas (Sigma-Aldrich) to confirm the result. Two batches of mature seeds harvested at different times and three biological repeats for each were analyzed.
Choline Measurement
Free choline measurement was performed using the Choline/Acetylcholine quantification kit (BioVision) according to the manufacturer’s instructions. For each replicate, developing seeds from three siliques were ground to a fine powder with liquid nitrogen. Approximately 2 mg of the seed powder was removed to a microfuge tube and weighed, and 100 μL of choline assay buffer was added. The sample was mixed, homogenized for 15 min by sonication, and centrifuged at 12,000g for 2 min at room temperature. Five microliters of extracts was added to the reaction mixture. After 30 min of incubation at room temperature (dark), the fluorescence of the samples was measured at excitation/emission 535/590 nm in a CytoFluor II Microwell fluorescence reader. A standard curve was established to calculate the amount of choline in the seed extracts.
Accession Numbers
Sequence data from this article can be found in the Arabidopsis Genome Initiative database under the following accession numbers: LPCAT1 (LPLAT1), At1g12640; LPCAT2 (LPLAT2), At1g63050; PEAMT1, At3g18000; PEAMT2, At1g48600; PEAMT3, At1g73600; CCT1, At2g32260; CCT2, At4g15130; PAT-PLA-IIβ, At4g37050; PAT-PLA-IIIα, At2g39220; PAT-PLA-IIIδ, At3g63200; PLDα1, At3g15730; PLDζ2, At3g05630; and TUBULIN3, At5g62700.
Supplemental Data
The following materials are available in the online version of this article.
Supplemental Figure 1. Identification and Characterization of T-DNA Insertion Lines.
Supplemental Figure 2. Quantification of Oil Content in Mature Seeds.
Supplemental Figure 3. Diagram of the RNAi Construct Targeting Both LPCAT1 and LPCAT2.
Supplemental Figure 4. Influence of LPCAT Deficiency on FA Partitioning into Glycerolipids.
Supplemental Figure 5. Influence of LPCAT Deficiency on Backbone Arrangement into Glycerolipids.
Supplemental Figure 6. Polar Lipid Measurement in lpcat1 lpcat2-2.
Supplemental Figure 7. Identification of 14C-Derived Products from Extracellular and Water-Soluble Fractions by TLC Separation.
Supplemental Figure 8. Accelerated PC Turnover in lpcat1 lpcat2-2.
Supplemental Table 1. FA Composition of Leaf Lipids in lpcat Single and Double Mutants.
Supplemental Table 2. FA Composition of lpcat Single and Double Mutant Alleles in Mature Seeds.
Supplemental Table 3. Seed FA Compositional Changes of RNAi Suppression Lines Targeting LPCAT1 and LPCAT2.
Supplemental Table 4. Stereo-Specific Analysis of TAGs Fraction from Mature Seeds.
Supplemental Table 5. Distributions of Fatty Acyl and Backbone in PC and DAG Species.
Supplemental Table 6. Positional Analysis of [14C]-Acyl Chains in PC.
Supplemental Table 7. Accelerated PC Turnover in lpcat1 lpcat2-2 Developing Seeds.
Supplemental Table 8. A List of Primers for Real-Time qRT-PCR.
Supplemental Table 9. A List of Primers for Mutant Identification and Construct Generation.
Supplemental Data Set 1. Differentially Expressed Genes from the lpcat1 lpcat2-2 Developing Seeds Compared with Columbia Wild Type.
Supplemental Data Set 2. A List of Genes Associated with PC Synthesis and Degradation Revealed by the Transcriptome.
Acknowledgments
We thank J. Allan Feurtado and Mark Smith from National Research Council Canada for critical reading of the article. We thank Mary Roth and Ruth Welti of Kansas Lipidomics Research Center for the lipidomic analysis, John Qiang Li and Darwin Reed from National Research Council Canada for assistance with microarray analysis and some technical advice, respectively. A.S.C. and S.S. are grateful for the support from the Swedish Research Council. R.J.W. is grateful for support from Natural Science and Engineering Council of Canada and the Canada Research Chairs Program. This project was funded in part by the Saskatchewan Agriculture Development Fund. This article is National Research Council Canada number 54658.
AUTHOR CONTRIBUTIONS
J.Z. conceived the study. L.W. and J.Z. designed experiments. L.W., W.S., M.K., G.C., and Q.C. performed experiments. All authors participate in data analysis. L.W. and J.Z. wrote the article.
Glossary
- TAG
triacylglycerol
- G3P
glycerol-3-phosphate
- GPAT
sn-glycerol-3-phosphate acyltransferase
- LPAAT
lysophosphatidic acid acyltransferase
- PA
phosphatidic acid
- PAP
PA phosphatase
- DAG
diacylglycerol
- PC
phosphatidylcholine
- CDP
cytidine-5′-diphosphate
- PDAT
phospholipid:diacylglycerol acyltransferase
- FA
fatty acid
- PUFA
polyunsaturated fatty acid
- LPC
lysophosphatidylcholine
- PLA2
phospholipase A2
- LPCAT
lysophosphatidylcholine acyltransferase
- GUS
β-glucuronidase
- RNAi
RNA interference
- MS
Murashige and Skoog
- DPM
to be defined
- TLC
thin layer chromatography
- PEAMT
phosphoethanolamine N-methyltransferase
- qRT-PCR
quantitative real-time PCR
- ESI-MS/MS
electrospray ionization–tandem mass spectrometry
- PDCT
phosphatidylcholine:diacylglycerol cholinephosphotransferase
- AAPT
to be defined
- FAME
fatty acid methyl ester
- GC
gas chromatography
NOTE ADDED IN PROOF
While this article was under review, Bates et al. (2012) reported that PC acyl editing through LPCAT and phosphocholine headgroup exchange between PC and DAG control the majority of acyl fluxes through PC to provide PUFAs for TAG synthesis.
References
- Alonso J.M., et al. (2003). Genome-wide insertional mutagenesis of Arabidopsis thaliana. Science 301: 653–657 [DOI] [PubMed] [Google Scholar]
- Astudillo A.M., Pérez-Chacón G., Balgoma D., Gil-de-Gómez L., Ruipérez V., Guijas C., Balboa M.A., Balsinde J. (2011). Influence of cellular arachidonic acid levels on phospholipid remodeling and CoA-independent transacylase activity in human monocytes and U937 cells. Biochim. Biophys. Acta 1811: 97–103 [DOI] [PubMed] [Google Scholar]
- Bafor M., Smith M.A., Jonsson L., Stobart K., Stymne S. (1991). Ricinoleic acid biosynthesis and triacylglycerol assembly in microsomal preparations from developing castor-bean (Ricinus communis) endosperm. Biochem. J. 280: 507–514 [DOI] [PMC free article] [PubMed] [Google Scholar]
- Banaś A., Dahlqvist A., Ståhl U., Lenman M., Stymne S. (2000). The involvement of phospholipid:diacylglycerol acyltransferases in triacylglycerol production. Biochem. Soc. Trans. 28: 703–705 [PubMed] [Google Scholar]
- Bao X., Pollard M., Ohlrogge J. (1998). The biosynthesis of erucic acid in developing embryos of brassica rapa. Plant Physiol. 118: 183–190 [DOI] [PMC free article] [PubMed] [Google Scholar]
- Bates P.D., Browse J. (2011). The pathway of triacylglycerol synthesis through phosphatidylcholine in Arabidopsis produces a bottleneck for the accumulation of unusual fatty acids in transgenic seeds. Plant J. 68: 387–399 [DOI] [PubMed] [Google Scholar]
- Bates P.D., Browse J. (2012). The significance of different diacylgycerol synthesis pathways on plant oil composition and bioengineering. Front. Plant Sci. 3: 147. [DOI] [PMC free article] [PubMed] [Google Scholar]
- Bates P.D., Durrett T.P., Ohlrogge J.B., Pollard M. (2009). Analysis of acyl fluxes through multiple pathways of triacylglycerol synthesis in developing soybean embryos. Plant Physiol. 150: 55–72 [DOI] [PMC free article] [PubMed] [Google Scholar]
- Bates P.D., Ohlrogge J.B., Pollard M. (2007). Incorporation of newly synthesized fatty acids into cytosolic glycerolipids in pea leaves occurs via acyl editing. J. Biol. Chem. 282: 31206–31216 [DOI] [PubMed] [Google Scholar]
- Baud S., Boutin J.P., Miquel M., Lepiniec L., Rochat C. (2002). An integrated overview of seed development in Arabidopsis thaliana ecotype WS. Plant Physiol. Biochem. 40: 151–160 [Google Scholar]
- Benghezal M., Roubaty C., Veepuri V., Knudsen J., Conzelmann A. (2007). SLC1 and SLC4 encode partially redundant acyl-coenzyme A 1-acylglycerol-3-phosphate O-acyltransferases of budding yeast. J. Biol. Chem. 282: 30845–30855 [DOI] [PubMed] [Google Scholar]
- Bessoule J.J., Testet E., Cassagne C. (1995). Synthesis of phosphatidylcholine in the chloroplast envelope after import of lysophosphatidylcholine from endoplasmic reticulum membranes. Eur. J. Biochem. 228: 490–497 [PubMed] [Google Scholar]
- Bourgis F., Kader J.C., Barret P., Renard M., Robinson D., Robinson C., Delseny M., Roscoe T.J. (1999). A plastidial lysophosphatidic acid acyltransferase from oilseed rape. Plant Physiol. 120: 913–922 [DOI] [PMC free article] [PubMed] [Google Scholar]
- Chen G., Snyder C.L., Greer M.S., Weselake R.J. (2011). Biology and biochemistry of plant phospholipases. Crit. Rev. Plant Sci. 30: 239–258 [Google Scholar]
- Chen Q., Kazachkov M., Zheng Z., Zou J. (2007). The yeast acylglycerol acyltransferase LCA1 is a key component of Lands cycle for phosphatidylcholine turnover. FEBS Lett. 581: 5511–5516 [DOI] [PubMed] [Google Scholar]
- Christie W.W. (2003). Lipid Analysis: Isolation, Separation, Identification and Structural Analysis of Lipids, 3rd ed, (Bridgwater, UK: The Oily Press), pp. 377–378
- Clough S.J., Bent A.F. (1998). Floral dip: A simplified method for Agrobacterium-mediated transformation of Arabidopsis thaliana. Plant J. 16: 735–743 [DOI] [PubMed] [Google Scholar]
- Dahlqvist A., Stahl U., Lenman M., Banas A., Lee M., Sandager L., Ronne H., Stymne S. (2000). Phospholipid:diacylglycerol acyltransferase: An enzyme that catalyzes the acyl-CoA-independent formation of triacylglycerol in yeast and plants. Proc. Natl. Acad. Sci. USA 97: 6487–6492 [DOI] [PMC free article] [PubMed] [Google Scholar]
- Eastmond P.J., Quettier A.L., Kroon J.T., Craddock C., Adams N., Slabas A.R. (2010). Phosphatidic acid phosphohydrolase 1 and 2 regulate phospholipid synthesis at the endoplasmic reticulum in Arabidopsis. Plant Cell 22: 2796–2811 [DOI] [PMC free article] [PubMed] [Google Scholar]
- Gentleman R.C., et al. (2004). Bioconductor: open software development for computational biology and bioinformatics. Genome Biol. 5: R80. [DOI] [PMC free article] [PubMed] [Google Scholar]
- Griffiths G., Stobart A.K., Stymne S. (1985). The acylation of sn-glycerol 3-phosphate and the metabolism of phosphatidate in microsomal preparations from the developing cotyledons of safflower (Carthamus tinctorius L.) seed. Biochem. J. 230: 379–388 [DOI] [PMC free article] [PubMed] [Google Scholar]
- Hill E.E., Lands W.E.M. (1970). Phospholipid metabolism. In Lipid Metabolism, S.J. Wakil, ed (New York: Academic Press), pp. 185–277
- Hishikawa D., Shindou H., Kobayashi S., Nakanishi H., Taguchi R., Shimizu T. (2008). Discovery of a lysophospholipid acyltransferase family essential for membrane asymmetry and diversity. Proc. Natl. Acad. Sci. USA 105: 2830–2835 [DOI] [PMC free article] [PubMed] [Google Scholar]
- Huang Y., Chen L., Wang L., Vijayan K., Phan S., Liu Z., Wan L., Ross A., Xiang D., Datla R., Pan Y., Zou J. (2009). Probing the endosperm gene expression landscape in Brassica napus. BMC Genomics 10: 256. [DOI] [PMC free article] [PubMed] [Google Scholar]
- Ichihara K., Mae K., Sano Y., Tanaka K. (1995). 1-Acylglycerophosphocholine O-acyltransferase in maturing safflower seeds. Planta 196: 551–557 [Google Scholar]
- Jain S., Stanford N., Bhagwat N., Seiler B., Costanzo M., Boone C., Oelkers P. (2007). Identification of a novel lysophospholipid acyltransferase in Saccharomyces cerevisiae. J. Biol. Chem. 282: 30562–30569 [DOI] [PubMed] [Google Scholar]
- Jain S., Zhang X., Khandelwal P.J., Saunders A.J., Cummings B.S., Oelkers P. (2009). Characterization of human lysophospholipid acyltransferase 3. J. Lipid Res. 50: 1563–1570 [DOI] [PMC free article] [PubMed] [Google Scholar]
- Katavic V., Reed D.W., Taylor D.C., Giblin E.M., Barton D.L., Zou J., Mackenzie S.L., Covello P.S., Kunst L. (1995). Alteration of seed fatty acid composition by an ethyl methanesulfonate-induced mutation in Arabidopsis thaliana affecting diacylglycerol acyltransferase activity. Plant Physiol. 108: 399–409 [DOI] [PMC free article] [PubMed] [Google Scholar]
- Kazachkov M., Chen Q., Wang L., Zou J. (2008). Substrate preferences of a lysophosphatidylcholine acyltransferase highlight its role in phospholipid remodeling. Lipids 43: 895–902 [DOI] [PubMed] [Google Scholar]
- Kennedy E.P. (1961). Biosynthesis of complex lipids. Fed. Proc. 20: 934–940 [PubMed] [Google Scholar]
- Kennedy E.P., Weiss S.B. (1956). The function of cytidine coenzymes in the biosynthesis of phospholipides. J. Biol. Chem. 222: 193–214 [PubMed] [Google Scholar]
- Keogh M.R., Courtney P.D., Kinney A.J., Dewey R.E. (2009). Functional characterization of phospholipid N-methyltransferases from Arabidopsis and soybean. J. Biol. Chem. 284: 15439–15447 [DOI] [PMC free article] [PubMed] [Google Scholar]
- Kim H.U., Huang A.H.C. (2004). Plastid lysophosphatidyl acyltransferase is essential for embryo development in Arabidopsis. Plant Physiol. 134: 1206–1216 [DOI] [PMC free article] [PubMed] [Google Scholar]
- Kim H.U., Li Y., Huang A.H.C. (2005). Ubiquitous and endoplasmic reticulum-located lysophosphatidyl acyltransferase, LPAT2, is essential for female but not male gametophyte development in Arabidopsis. Plant Cell 17: 1073–1089 [DOI] [PMC free article] [PubMed] [Google Scholar]
- Koo A.J., Ohlrogge J.B., Pollard M. (2004). On the export of fatty acids from the chloroplast. J. Biol. Chem. 279: 16101–16110 [DOI] [PubMed] [Google Scholar]
- Lands W.E.M. (1958). Metabolism of glycerolipides; A comparison of lecithin and triglyceride synthesis. J. Biol. Chem. 231: 883–888 [PubMed] [Google Scholar]
- Lands W.E.M. (1960). Metabolism of glycerolipids. 2. The enzymatic acylation of lysolecithin. J. Biol. Chem. 235: 2233–2237 [PubMed] [Google Scholar]
- Lands W.E.M. (1965). Lipid metabolism. Annu. Rev. Biochem. 34: 313–346 [DOI] [PubMed] [Google Scholar]
- Larson T.R., Graham I.A. (2001). Technical Advance: A novel technique for the sensitive quantification of acyl CoA esters from plant tissues. Plant J. 25: 115–125 [DOI] [PubMed] [Google Scholar]
- Lee H.Y., Bahn S.C., Shin J.S., Hwang I., Back K., Doelling J.H., Ryu S.B. (2005). Multiple forms of secretory phospholipase A2 in plants. Prog. Lipid Res. 44: 52–67 [DOI] [PubMed] [Google Scholar]
- Li M., Bahn S.C., Guo L., Musgrave W., Berg H., Welti R., Wang X. (2011). Patatin-related phospholipase pPLAIIIβ-induced changes in lipid metabolism alter cellulose content and cell elongation in Arabidopsis. Plant Cell 23: 1107–1123 [DOI] [PMC free article] [PubMed] [Google Scholar]
- Li Y., Beisson F., Pollard M., Ohlrogge J. (2006). Oil content of Arabidopsis seeds: the influence of seed anatomy, light and plant-to-plant variation. Phytochemistry 67: 904–915 [DOI] [PubMed] [Google Scholar]
- Lu C., Xin Z., Ren Z., Miquel M., Browse J. (2009). An enzyme regulating triacylglycerol composition is encoded by the ROD1 gene of Arabidopsis. Proc. Natl. Acad. Sci. USA 106: 18837–18842 [DOI] [PMC free article] [PubMed] [Google Scholar]
- Myher J.J., Kuksis A. (1979). Stereospecific analysis of triacylglycerols via racemic phosphatidylcholines and phospholipase C. Can. J. Biochem. 57: 117–124 [DOI] [PubMed] [Google Scholar]
- Ohlrogge J., Browse J. (1995). Lipid biosynthesis. Plant Cell 7: 957–970 [DOI] [PMC free article] [PubMed] [Google Scholar]
- Oo K.C., Huang A.H. (1989). Lysophosphatidate acyltransferase activities in the microsomes from palm endosperm, maize scutellum, and rapeseed cotyledon of maturing seeds. Plant Physiol. 91: 1288–1295 [DOI] [PMC free article] [PubMed] [Google Scholar]
- Paysant-Diament M., Budon S., Polonovski J. (1961). Incorporation du 32P dans lesphospholipides plasmatiques et globulaires du sang de rat in vivo. In The Enzymes of Lipid Metabolism, P. Desnul'lle, ed (New York: Pergamon Press), pp. 250–263
- Pérez-Chacón G., Astudillo A.M., Balgoma D., Balboa M.A., Balsinde J. (2009). Control of free arachidonic acid levels by phospholipases A2 and lysophospholipid acyltransferases. Biochim. Biophys. Acta 1791: 1103–1113 [DOI] [PubMed] [Google Scholar]
- Pollard M., Ohlrogge J. (1999). Testing models of fatty acid transfer and lipid synthesis in spinach leaf using in vivo oxygen-18 labeling. Plant Physiol. 121: 1217–1226 [DOI] [PMC free article] [PubMed] [Google Scholar]
- Riekhof W.R., Wu J., Gijón M.A., Zarini S., Murphy R.C., Voelker D.R. (2007). Lysophosphatidylcholine metabolism in Saccharomyces cerevisiae: The role of P-type ATPases in transport and a broad specificity acyltransferase in acylation. J. Biol. Chem. 282: 36853–36861 [DOI] [PubMed] [Google Scholar]
- Rietz S., Dermendjiev G., Oppermann E., Tafesse F.G., Effendi Y., Holk A., Parker J.E., Teige M., Scherer G.F. (2010). Roles of Arabidopsis patatin-related phospholipases a in root development are related to auxin responses and phosphate deficiency. Mol. Plant 3: 524–538 [DOI] [PubMed] [Google Scholar]
- Routaboul J.M., Benning C., Bechtold N., Caboche M., Lepiniec L. (1999). The TAG1 locus of Arabidopsis encodes for a diacylglycerol acyltransferase. Plant Physiol. Biochem. 37: 831–840 [DOI] [PubMed] [Google Scholar]
- Ryu S.B. (2004). Phospholipid-derived signaling mediated by phospholipase A in plants. Trends Plant Sci. 9: 229–235 [DOI] [PubMed] [Google Scholar]
- Shen W., Li J.Q., Dauk M., Huang Y., Periappuram C., Wei Y., Zou J. (2010). Metabolic and transcriptional responses of glycerolipid pathways to a perturbation of glycerol 3-phosphate metabolism in Arabidopsis. J. Biol. Chem. 285: 22957–22965 [DOI] [PMC free article] [PubMed] [Google Scholar]
- Shindou H., Shimizu T. (2009). Acyl-CoA:lysophospholipid acyltransferases. J. Biol. Chem. 284: 1–5 [DOI] [PubMed] [Google Scholar]
- Slack C.R., Roughan P.G., Balasingham N. (1977). Labelling studies in vivo on the metabolism of the acyl and glycerol moieties of the glycerolipids in the developing maize leaf. Biochem. J. 162: 289–296 [DOI] [PMC free article] [PubMed] [Google Scholar]
- Soupene E., Fyrst H., Kuypers F.A. (2008). Mammalian acyl-CoA:lysophosphatidylcholine acyltransferase enzymes. Proc. Natl. Acad. Sci. USA 105: 88–93 [DOI] [PMC free article] [PubMed] [Google Scholar]
- Ståhl U., Stålberg K., Stymne S., Ronne H. (2008). A family of eukaryotic lysophospholipid acyltransferases with broad specificity. FEBS Lett. 582: 305–309 [DOI] [PubMed] [Google Scholar]
- Stobart A.K., Stymne S., Glad G. (1983). The synthesis of linoleate and phosphatidic acid and its relationship to oil production in the microsomes of developing seeds of safflower (Carthamus tinctorius, L. var. Gila). Biochim. Biophys. Acta 754: 292–297 [Google Scholar]
- Stymne S., Glad G. (1981). Acyl exchange between oleoyl-CoA and phosphatidylcholine in microsomes of developing soya bean cotyledons and its role in fatty acid desaturation. Lipids 16: 298–305 [Google Scholar]
- Stymne S., Stobart A.K. (1984). The biosynthesis of triacylglycerols in microsomal preparations of developing cotyledons of sunflower (Helianthus annuus L.). Biochem. J. 220: 481–488 [DOI] [PMC free article] [PubMed] [Google Scholar]
- Stymne S., Stobart A.K., Glad G. (1983). The role of the acyl-CoA pool in the synthesis of polyunsaturated 18-carbon fatty acids and triacylglycerol production in the microsomes of developing safflower seeds. Biochim. Biophys. Acta 752: 198–208 [DOI] [PubMed] [Google Scholar]
- Tamaki H., Shimada A., Ito Y., Ohya M., Takase J., Miyashita M., Miyagawa H., Nozaki H., Nakayama R., Kumagai H. (2007). LPT1 encodes a membrane-bound O-acyltransferase involved in the acylation of lysophospholipids in the yeast Saccharomyces cerevisiae. J. Biol. Chem. 282: 34288–34298 [DOI] [PubMed] [Google Scholar]
- Tasseva G., Richard L., Zachowski A. (2004). Regulation of phosphatidylcholine biosynthesis under salt stress involves choline kinases in Arabidopsis thaliana. FEBS Lett. 566: 115–120 [DOI] [PubMed] [Google Scholar]
- Tian Y., Pate C., Andreolotti A., Wang L., Tuomanen E., Boyd K., Claro E., Jackowski S. (2008). Cytokine secretion requires phosphatidylcholine synthesis. J. Cell Biol. 181: 945–957 [DOI] [PMC free article] [PubMed] [Google Scholar]
- Tjellström H., Yang Z., Allen D.K., Ohlrogge J.B. (2012). Rapid kinetic labeling of Arabidopsis cell suspension cultures: Implications for models of lipid export from plastids. Plant Physiol. 158: 601–611 [DOI] [PMC free article] [PubMed] [Google Scholar]
- Wang X. (2000). Multiple forms of phospholipase D in plants: The gene family, catalytic and regulatory properties, and cellular functions. Prog. Lipid Res. 39: 109–149 [DOI] [PubMed] [Google Scholar]
- Welti R., Li W., Li M., Sang Y., Biesiada H., Zhou H.E., Rajashekar C.B., Williams T.D., Wang X. (2002). Profiling membrane lipids in plant stress responses. Role of phospholipase D alpha in freezing-induced lipid changes in Arabidopsis. J. Biol. Chem. 277: 31994–32002 [DOI] [PubMed] [Google Scholar]
- Williams J.P., Imperial V., Khan M.U., Hodson J.N. (2000). The role of phosphatidylcholine in fatty acid exchange and desaturation in Brassica napus L. leaves. Biochem. J. 349: 127–133 [DOI] [PMC free article] [PubMed] [Google Scholar]
- Winter D., Vinegar B., Nahal H., Ammar R., Wilson G.V., Provart N.J. (2007). An “Electronic Fluorescent Pictograph” browser for exploring and analyzing large-scale biological data sets. PLoS ONE 2: e718. [DOI] [PMC free article] [PubMed] [Google Scholar]
- Xu J., Carlsson A.S., Francis T., Zhang M., Hoffman T., Giblin M.E., Taylor D.C. (2012). Triacylglycerol synthesis by PDAT1 in the absence of DGAT1 activity is dependent on re-acylation of LPC by LPCAT2. BMC Plant Biol. 12: 4. [DOI] [PMC free article] [PubMed] [Google Scholar]
- Yurchenko O.P., Nykiforuk C.L., Moloney M.M., Ståhl U., Banaś A., Stymne S., Weselake R.J. (2009). A 10-kDa acyl-CoA-binding protein (ACBP) from Brassica napus enhances acyl exchange between acyl-CoA and phosphatidylcholine. Plant Biotechnol. J. 7: 602–610 [DOI] [PubMed] [Google Scholar]
- Zhang M., Fan J., Taylor D.C., Ohlrogge J.B. (2009). DGAT1 and PDAT1 acyltransferases have overlapping functions in Arabidopsis triacylglycerol biosynthesis and are essential for normal pollen and seed development. Plant Cell 21: 3885–3901 [DOI] [PMC free article] [PubMed] [Google Scholar]
- Zhao Y., Chen Y.Q., Bonacci T.M., Bredt D.S., Li S., Bensch W.R., Moller D.E., Kowala M., Konrad R.J., Cao G. (2008). Identification and characterization of a major liver lysophosphatidylcholine acyltransferase. J. Biol. Chem. 283: 8258–8265 [DOI] [PubMed] [Google Scholar]
- Zheng Q., Li J.Q., Kazachkov M., Liu K., Zou J. (2012). Identification of Brassica napus lysophosphatidylcholine acyltransferase genes through yeast functional screening. Phytochemistry 75: 21–31 [DOI] [PubMed] [Google Scholar]
- Zou J., Wei Y., Jako C., Kumar A., Selvaraj G., Taylor D.C. (1999). The Arabidopsis thaliana TAG1 mutant has a mutation in a diacylglycerol acyltransferase gene. Plant J. 19: 645–653 [DOI] [PubMed] [Google Scholar]
References
- Bates P.D., Fatihi A., Snapp A.R., Carlsson A.S., Browse J.A., Lu C. (August 29, 2012). Acyl editing and headgroup exchange are the major mechanisms that direct polyunsaturated fatty acid flux into triacylglycerols. Plant Physiol. 160: 1530–1539 (online), doi/ 10.1104/pp.112.204438 [DOI] [PMC free article] [PubMed] [Google Scholar]