

Abstract
Acamprosate is clinically used to treat alcohol-dependent patients. While the molecular and pharmacological mechanisms of acamprosate remain unclear, it has been shown to regulate γ-aminobutyric acid (GABA) or glutamate levels in the cortex and striatum. To investigate the effect of acamprosate on brain metabolites in the medial prefrontal cortex (mPFC) and nucleus accumbens (NAc), we employed in vivo 16.4T proton magnetic resonance spectroscopy. We utilized type 1 equilibrative nucleoside transporter (ENT1) null mice since acamprosate attenuates ethanol drinking in these mice. Our findings demonstrated that ethanol withdrawal reduced GABA levels and increased phosphorylated choline compounds in the mPFC of both wild-type and ENT1 null mice. Notably, acamprosate normalized these withdrawal-induced changes only in ENT1 null mice. In the NAc, ethanol withdrawal increased glutamate and glutamine (Glx) levels only in wild-type mice. Interestingly, acamprosate reduced Glx levels in the NAc compared to the withdrawal state in both genotypes. These results provide a molecular basis for the pharmacological effect of acamprosate in the cortical-striatal circuit.
Keywords: acamprosate, ENT1, ethanol withdrawal, [1H] MRS, GABA, glutamate
1. Introduction
Alcohol dependence is often characterized by the onset of alcohol withdrawal symptoms or alcohol withdrawal syndrome (AWS) (Hall and Zador, 1997), which exacerbates the inability to abstain from alcohol consumption despite negative consequences on health or social relationships (Stacey et al., 2009). Owing to the complexity of the withdrawal symptoms of this neurological disorder, millions of people worldwide struggle with alcohol dependence making alcohol-use disorders the second leading global health burden of mental, neurological and substance-use disorders as measured by disability-adjusted life year (Collins et al., 2011). A series of recent studies indicate that acamprosate is effective in reducing withdrawal symptoms associated with a hyper-glutamatergic status, which is thought to lead to alcohol craving or relapse (De Witte et al., 2005; Mann et al., 2008; Putzke et al., 1996; Spanagel, 2009; Spanagel and Kiefer, 2008). Multiple clinical trials have suggested that acamprosate is effective in maintaining abstinence in identified populations of alcohol-dependent individuals (Anton and Swift, 2003; Swift, 1999). A recent meta-analysis of 17 studies demonstrate that overall continuous abstinence rates were significantly higher in acamprosate-treated patients compared to placebo controls (Mann et al., 2004). However, the efficacy of acamprosate was not universal as some patients treated with acamprosate were still unable to achieve continuous abstinence (Mann, 2004; Morley et al., 2006). In addition, the COMBINE study failed to find an overall significant effect of acamprosate on drinking versus a placebo when measuring days abstinent from alcohol and time to first heavy drinking day as a main outcome (Anton et al., 2006). Given this variable efficacy of acamprosate, it is necessary to understand the effect acamprosate in the brain metabolites.
In this study, we investigated brain metabolites using 16.4T (700 MHz) proton magnetic resonance spectroscopy ([1H] MRS) during ethanol withdrawal and the effect of acamprosate in wild-type and type 1 equilibrative nucleoside transporter (ENT1) null mice. ENT1 is an ethanol sensitive adenosine transporter (Nagy et al., 1990). ENT1 null mice consume more ethanol than wild-type mice (Choi et al., 2004) and are more susceptible to ethanol withdrawal seizure-like behavior (Kim et al., 2011). In addition, chronic ethanol administration has been shown to reduce ENT1 gene expression in the rat basal forebrain (Anton et al., 2006). Consistently, mice over-expressing human ENT1 are more sensitive to the intoxicating effects of ethanol (Parkinson et al., 2009). Thus, ENT1 null mice are a useful model to study some aspects of ethanol withdrawal and drinking (Chen et al., 2010; Choi et al., 2004; Holmes, 2011; Melendez and Kalivas, 2004; Nam et al., 2010; Nam et al., 2011). Moreover, human genetic association studies indicate that allelic variants of SLC29A1 (human ENT1) are associated with alcoholic dependent patients with a history of withdrawal seizures (Kim et al., 2011) as well as an alcohol abuse phenotype in women (Gass et al., 2010). ENT1 null mice have been shown to exhibit elevated basal glutamate levels in the nucleus accumbens (Lee et al., 2011; Nam et al., 2011) and acamprosate treatment significantly reduces ethanol drinking in these mice (Lee et al., 2011). Therefore, we employed the non-invasive [1H] MRS technique to examine the pharmacological effect of acamprosate on ethanol withdrawal in the medial prefrontal cortex (mPFC) and NAc because the interaction of these two brain regions regulates addiction-related behaviors including alcohol withdrawal and relapse (Hermann et al., 2011; Kalivas and Volkow, 2011). Here, we found that acamprosate treatment during ethanol withdrawal increases levels of medial prefrontal cortical GABA and decreases levels of accumbal glutamate in ENT1 null mice.
2. Materials and methods
2.1. Animals
ENT1 null mice were generated as previously described (Choi et al., 2004). Briefly, F1 generation mice were generated by crossing 129X1/SvJ background heterozygous ENT1 mice with C57BL/6J wild-type mice. The C57BL/6J and 129X1/SvJ mice were purchased from the Jackson laboratory (Bar Harbor, ME). The heterozygous F1 mice were then crossed to generate F2 generation mice. Only 8–16 week old male F2 generation homozygote wild-type and null mice were used in all experiments of this study. Mice were housed in standard Plexiglas cages with food and water ad libitum. The colony room was maintained on a 12 h light/dark cycle with lights on at 6:00 a.m. Experimental and animal care procedures were approved by the Mayo Clinic Institutional Animal Care and Use Committees in accordance with NIH guidelines.
2.2. Chronic ethanol administration
Chronic ethanol was administered to wild-type and ENT1 null mice using an ethanol vapor inhalation chamber as previously described (Metten et al., 2010). Briefly, wild-type and ENT1 null mice were exposed to chronic ethanol vapor or air using a vapor administration chamber (La Jolla Alcohol Research, Inc., La Jolla, CA) for 16 hours per day for three consecutive days, with an 8 hour ethanol withdrawal period between sequential vapor administrations. Prior to vapor exposure each day, animals were administered 1.5 g/kg ethanol (20% v/v in saline) and 68.1 mg/kg pyrazole (Sigma-Aldrich, St. Louis, MO) in a single intraperitoneal (i.p.) injection to initiate and help maintain an ethanol intoxication status, respectively (Becker et al., 1997). Mice were then immediately individually housed inside the vapor chamber with food and water available ad libitum and ethanol was continuously pumped into the chamber to sustain a concentration of 3.0–5.0 mg ethanol/liter of air. This vapor concentration, in combination with the ethanol and pyrazole i.p. injection, maintained mice blood ethanol concentrations (BEC) around 150 mg/dl. Chronically this BEC has been shown to induce withdrawal symptoms including handling induced seizures (Metten et al., 2010). A similar paradigm has also been shown to induce handling induced convulsions in ENT1 null mice (Kim et al., 2011).
2.3. Blood ethanol concentration assessment
Immediately following 3 consecutive days of 16 hours of ethanol vapor with intermittent periods of 8 h of withdrawal each day, approximately 30 μl of blood was collected from each mouse via tail bleeding and plasma ethanol levels were determined using Analox AM1 (Analox Instrument USA, Lunenburg, MA).
2.4. In vivo 16.4T proton magnetic resonance spectroscopy
In vivo 16.4T proton magnetic resonance spectroscopy ([1H] MRS) was performed as previously described (Lee et al., 2011). Briefly, in vivo [1H] MRS was performed on a 16.4 T (700 MHz) Bruker Avance III 700WB vertical 89 mm bore spectrometer (Bruker BioSpin, Billerica, MA). For basal metabolic analysis, mice were injected with saline at an equivalent volume to that of the acamprosate dose. For the metabolite level analysis following chronic ethanol withdrawal, the mouse was removed from the vapor chamber and returned to its home cage. Following an 8 h withdrawal period, the first [1H] MRS scan was performed. Then, for the next 5 consecutive days, mice remained in the withdrawal status and were given 400 mg/kg/day acamprosate (Estechpharma, Ansan-Si, Korea) (i.p.) in two injections 12 h apart. Immediately following the final injection mice were anesthetized as previously described and scanned again. Mice typically spent about 95 minutes inside the magnet (5 minutes preparation time and 90 minutes scan time). Pilot fast low-angle shot (FLASH) images were recorded for correct placement of an 8 μl volume of interest (VOI; 2 × 2 × 2 mm3) around either the NAc or the mPFC, which includes the prelimbic, infralimbic and cingulate cortices. Then, method specific local magnet field homogenization was performed. A point-resolved spectroscopy (PRESS) sequence was used with a repetition time (TR) of 1768 ms, an echo-time (TE) of 10 ms, and a number of averages (NA) of 3072. Brain metabolites were quantified using LCModel Version 6.2–4 software (Provencher, 1993, 2001). Consistent fitting of spectra by LCModel was ensured by considering Cramér-Rao lower bounds. Animals were only included in analyzes when LCModel quantified glutamate + glutamine (Glx) with a Cramér-Rao lower bounds of less than 10% and N-acetylaspartic acid (NAA), glutamate, glutamine, glycerophosphocholine + phosphocholine (GPC + PCh), guanosine, taurine, γ-aminobutyric acid (GABA) and myo-inositol with a Cramér-Rao lower bounds of less than 20%. Acamprosate was simulated using chemical shifts of 3.28, 2.92, 1.98, and 1.93 ppm (Lee et al., 2011). Metabolites were quantified as percent ratio to creatine levels as an internal control (Jensen et al., 2009; Lee et al., 2011; Moore and Galloway, 2002) to standardize for animal and equipment variations as well as the total number of cells analyzed within the VOI.
2.5. Statistical analyses
All data are presented as mean ± SEM (standard error of the mean). Data were analyzed by two-way repeated measures analysis of variance (ANOVA) followed by Tukey post hoc test for individual comparisons. Separate analyses were carried out for comparing ethanol withdrawal and basal conditions as well as ethanol withdrawal and acamprosate treatment. Results were considered significantly different when p < 0.05.
3. Results
3.1. Chronic ethanol exposure and withdrawal in mice
Chronic ethanol was administered using an ethanol vapor inhalation paradigm (Fig. 1A). The ethanol vapor chamber is a widely accepted method for administering chronic ethanol and has many advantages over other chronic administration paradigms in developing withdrawal symptoms (D'Souza El-Guindy et al., 2010). Ethanol vapor was administered for 16 h/day for 3 consecutive days to maintain blood ethanol levels around 150 mg/dl. Blood ethanol levels were determined immediately following the third day of vapor administration. As shown in Fig. 1B, blood ethanol levels were maintained around 150 mg/dl and there was no difference between blood ethanol levels in wild-type (158 ± 24 mg/dl) and ENT1 null (170 ± 24 mg/dl) mice (n = 12 per genotype), suggesting that differential BEC levels between wild-type and ENT1 null mice were not a likely factor contributing to altered metabolite levels between genotypes as there was no significant correlation between blood ethanol and metabolite levels.
Fig. 1.

Ethanol exposure in a vapor chamber and ethanol withdrawal experiment. (A) Schematic representation of the experimental paradigm. Mice were scanned by 16.4T magnetic resonance spectroscopy ([1H] MRS) to measure basal metabolite levels (MRS #1). Then mice were exposed to ethanol vapor for 16 hours per day for three consecutive days in an ethanol vapor inhalation chamber. Mice were then withdrawn from ethanol for 8 hours and scanned by [1H] MRS (MRS #2). Acamprosate was then injected twice per day for the next five days at a dose of 200 mg/kg/injection. Finally, following the acamprosate treatment, mice were scanned again by [1H] MRS to investigate the effect of acamprosate (MRS #3). (B) There was no difference between the blood ethanol concentration of ENT1 null and wild-type mice. In addition, the target concentration of 150 mg/dl was achieved in both ENT1 null and wild-type mice. Data are presented as mean ± standard error of the mean (SEM).
3.2. Magnetic resonance spectroscopy
Since it has been shown that one of the consequences of ethanol withdrawal is the alteration of brain metabolites including increased glutamatergic neurotransmission (Adinoff et al., 1995; Rossetti and Carboni, 1995; Tsai et al., 1995; Tsai et al., 1998), we investigated the effect of ethanol withdrawal on the mPFC and accumbal metabolic profiles of wild-type and ENT1 null mice. Fig. 2A is the location of an 8 μl voxel for the mPFC from a representative coronal rapid acquisition relaxation enhanced (RARE; RARE factor = 4, TE = 9.6 ms, TR = 4000 ms, NA = 4) image. Fig. 2B is the placement of the voxel on a cartoon image from the mouse brain atlas illustrating the anatomical location of the mPFC. [1H] MRS acquired spectra (Fig. 2C) were fit using LCModel (Fig. 2D) and quantified based on Cramér-Rao lower bounds. Fig. 2E shows the residual between the LCModel best fit and the actual spectrum. In addition, the accumbal metabolite profile was also acquired. Fig. 2F is the location of an 8 μl volume of interest (VOI), which encompasses the NAc on a coronal RARE image. Fig. 2G is the location of the voxel on a cartoon coronal brain slice showing the anatomical location of the NAc. Fig. 2H is a representative accumbal metabolite profile acquired from the 8 μl VOI utilizing in vivo 16.4 T [1H] MRS. Metabolites were quantified using LCModel best fit (Fig. 2I) based on Cramér-Rao lower bounds. Finally, Fig. 2J is the residual between the LCModel best fit and the actual spectrum acquired.
Fig. 2.

Measuring metabolites using 16.4T [1H]. (A) Representative placement of an 8 μl volume of interest (VOI) on a RARE image of a 1.0 mm thick coronal brain section centered around the medial prefrontal cortex (mPFC). Scale bar = 2mm. (B) Location of the voxel on a cartoon coronal brain slice from the mouse brain atlas illustrating the anatomical location of the medial prefrontal cortex. (C) Representative brain metabolite spectrum acquired using in vivo 16.4T. (D) LCModel best fit of the medial prefrontal cortical metabolite spectrum in Fig. 2D and (E) the residual difference. [1H] MRS data acquisition for the nucleus accumbens (NAc). (F) Placement of an 8 μl volume of interest (VOI) encompassing the nucleus accumbens (NAc) on a RARE image of a 1.0 mm thick coronal brain section. Scale bar = 2 mm. (G) Location of the voxel on a cartoon coronal brain section from the mouse brain atlas illustrating the location of the NAc. (H) Representative brain metabolite spectrum acquired using in vivo 16.4T. (I) LCModel best fit of the brain metabolite spectrum in Fig. 2D and (J) the residual difference. Ala: alanine, Cr: creatine, GABA: γ-aminobutyric acid, Gln: glutamine, Glu: glutamate, Gua: guanosine, GPC: glycerophosphocholine, Ins: myo-inositol, Lac: lactate, NAA: N-acetylaspartatic acid, NAAG: N-acetylaspartylglutamic acid, PCh, phosphocholine, PCr, phosphocreatine, Tau: taurine. Schematic anatomic representation of coronal brain sections was adapted from Paxinos and Franklin's stereotaxic atlas published in The Mouse Brain in Stereotaxic Coordinates, 3rd edition, Copyright Elsevier (2008) (Paxinos and Franklin, 2008) and reprinted with permission.
3.3. Reduced GABA levels in the medial prefrontal cortex during ethanol withdrawal
Since glutamatergic neurons from the mPFC project to the NAc where they release glutamate, we investigated the effect of ethanol withdrawal on the metabolic profile of wild-type and ENT1 null mice in the mPFC (n = 5–8 per metabolite for each genotype) compared to basal conditions. We found that ethanol withdrawal reduced GABA and increased GPC + PCh (glycerophosphocholine + phosphocholine) in both wild-type and ENT1 null mice compared to basal metabolite levels (Table 1). For GABA, two-way repeated measures ANOVA indicated a significant effect of treatment [F(1,20) = 6.911, p = 0.039] but not a significant effect of genotype [F(1,20) = 1.159, p = 0.300] or the interaction between genotype and treatment [F(1,20) = 0.558, p = 0.483]. For GPC + PCh, two-way repeated measures ANOVA illustrated a significant effect of treatment [F(1,29) = 63.243, p < 0.001] but not a significant effect of genotype [F(1,29) = 0.145, p = 0.709] or the interaction between genotype and treatment [F(1,29) = 0.362, p = 0.558]. As the cortical-striatal circuit is important in addictive disorders, we next examined the effect of ethanol withdrawal in the nucleus accumbens.
Table 1.
Effect of ethanol withdrawal and acamprosate treatment in the mPFC
| ENT1+/+ | ENT1−/− | |||||
|---|---|---|---|---|---|---|
| Metabolites | Basal | Withdrawal | Acamprosate | Basal | Withdrawal | Acamprosate |
| N-acetylaspartatic acid (NAA) | 100 ± 7 (8) | 91 ± 6 (8) | 94 ± 6 (7) | 93 ± 6 (7) | 90 ± 9 (7) | 97 ± 17 (6) |
| γ-aminobutyric acid (GABA) | 100 ± 16 (6) | 67 ± 11 (5) | 72 ± 6 (7) | 115 ± 10 (5) | 75 ± 9 (5) | 158 ± 27 (5)*,# |
| Glutamate (Glu) | 100 ± 12 (8) | 106 ± 6 (8) | 106 ± 6 (8) | 102 ± 4 (7) | 115 ± 7 (7) | 114 ± 10 (6) |
| Glutamine (Gln) | 100 ± 14 (5) | 98 ± 10 (7) | 89 ± 12 (8) | 64 ± 4 (6) | 95 ± 7 (6) | 101 ± 10 (5)# |
| Glutamate+Glutamine (Glx) | 100 ± 8 (8) | 104 ± 7 (8) | 102 ± 8 (7) | 93 ± 3 (7) | 114 ± 7 (7) | 108 ± 10 (5) |
| Glycerophosphocholine+Phosphocholine (GPC+PCh) | 100 ± 13 (8) | 144 ± 17 (8) | 134 ± 20 (6) | 92 ± 4 (7) | 144 ± 8 (7) | 115 ± 11 (7) |
| Guanosine (Gua) | 100 ± 7 (8) | 91 ± 7 (8) | 84 ± 6 (6) | 119 ± 4 (7) | 100 ± 11 (7) | 117 ± 10 (6) |
| Taurine (Tau) | 100 ± 6 (8) | 91 ± 6 (7) | 89 ± 7 (6) | 101 ± 5 (7) | 97 ± 3 (7) | 98 ± 4 (6) |
| myo-Inositol (Ins) | 100 ± 3 (8) | 96 ± 5 (7) | 99 ± 5 (8) | 108 ± 6 (7) | 107 ± 6 (7) | 114 ± 5 (6) |
p < 0.05 compared to wild-type mice within each treatment group by two-way repeated measures analysis of varience (ANOVA) followed by Tukey post hoc test for individual comparisons,
p < 0.05 compared to withdrawal condition within each genotype by two-way repeated measures ANOVA followed by Tukey post hoc test for individual comparisons. Metabolites are measured relative to total creatine. All data are expressed as percent baseline ± SEM relative to wild-type basal level. Number within parentheses is the number of animals included for each metabolite at each condition based on Cramer-Rao lower bounds.
3.4. Elevated glutamate levels in the nucleus accumbens during ethanol withdrawal
Previously we have published that ENT1 null mice have elevated glutamate levels in the NAc compared to wild-type mice by in vivo microdialysis and [1H] MRS (Lee et al., 2011; Nam et al., 2011). In this study, we examined the effect of ethanol withdrawal on the accumbal metabolite profile of ENT1 null and wild-type mice (n = 5–12 per metabolite for each genotype). We found that ethanol withdrawal significantly increases Glx, glutamate and glutamine in the NAc of wild-type mice and decreases NAA in the NAc of wild-type and ENT1 null mice (Table 2). For Glx, two-way repeated measures indicated a significant effect of treatment [F(1,31) = 17.879, p = 0.003] and the interaction between treatment and genotype [F(1,31) = 10.335, p = 0.012] without a significant effect to genotype [F(1,31) = 0.162, p = 0.691]. Tukey post hoc test indicated that ethanol withdrawal significantly increased Glx levels compared to basal levels within wild-type mice only (Fig. 3B). Further post hoc analysis also indicated that the basal level of Glx is significantly increased in ENT1 null mice compared to wild-type mice (Fig. 3B). For glutamate, two-way repeated measures indicated a significant effect of treatment [F(1,33) = 17.584, p = 0.002] and the interaction between treatment and genotype [F(1,33) = 8.571, p = 0.015] without a significant effect to genotype [F(1,33) = 0.145, p = 0.706]. Tukey post hoc test indicated that ethanol withdrawal significantly increased glutamate levels compared to basal levels within wild-type mice only. Further post hoc analysis also indicated that the basal level of glutamate is significantly increased in ENT1 null mice compared to wild-type mice. For glutamine, two-way repeated measures indicated a significant effect of treatment [F(1,32) = 22.702, p = 0.001] and the interaction between treatment and genotype [F(1,32) = 6.923, p = 0.030] without a significant effect to genotype [F(1,32) = 0.407, p = 0.529]. Tukey post hoc indicated that ethanol withdrawal significantly increased glutamine levels compared to basal levels within wild-type mice only. Further post hoc analysis also indicated that the basal level of glutamine is significantly increased in ENT1 null mice compared to wild-type mice. Moreover, glutamine levels in the NAc of ENT1 null mice during ethanol withdrawal are reduced compared to those of wild-type mice. For NAA, two-way repeated measures ANOVA indicated a significant effect of treatment [F(1,35) = 5.151, p = 0.047] but not a significant effect of genotype [F(1,35) = 2.310, p = 0.138] or the interaction between genotype and treatment [F(1,35) = 1.219, p = 0.295]. Since ethanol withdrawal appears to dysregulate both the GABAergic and glutamatergic system we were interested to see if acamprosate treatment could reverse any of these withdrawal-induced metabolite changes.
Table 2.
Effect of ethanol withdrawal and acamprosate treatment in the NAc
| ENT1+/+ | ENT1−/− | |||||
|---|---|---|---|---|---|---|
| Metabolites | Basal | Withdrawal | Acamprosate | Basal | Withdrawal | Acamprosate |
| N-acetylaspartatic acid (NAA) | 100 ± 4 (12) | 98 ± 9 (5) | 95 ± 4 (5) | 115 ± 3 (12) | 96 ± 6 (7) | 101 ± 5 (7) |
| γ-aminobutyric acid (GABA) | 100 ± 7 (12) | 105 ± 6 (5) | 85 ± 4 (5) | 110 ± 5 (12) | 82 ± 11 (7) | 98 ± 8 (7) |
| Glutamate (Glu) | 100 ± 4 (12) | 127 ± 10 (5) † | 113 ± 6 (5) | 115 ± 4 (10)* | 122 ± 5 (7) | 114 ± 6 (7) |
| Glutamine (Gln) | 100 ± 5 (11) | 168 ± 19 (5) † | 119 ± 11 (5) | 117 ± 4 (11)* | 141 ± 7 (6)* | 114 ± 3 (6) |
| Glutamate+Glutamine (Glx) | 100 ± 3 (10) | 132 ± 10 (6) † | 112 ± 6 (5) | 113 ± 3 (10)* | 126 ± 5 (6) | 109 ± 5 (6) |
| Glycerophosphocholine+Phosphocholine (GPC+PCh) | 100 ± 4 (12) | 112 ± 6 (5) | 96 ± 4 (5) | 105 ± 4 (12) | 108 ± 6 (6) | 96 ± 5 (7) |
| Guanosine (Gua) | 100 ± 6 (11) | 89 ± 9 (5) | 95 ± 11 (5) | 90 ± 5 (12) | 84 ± 6 (6) | 90 ± 4 (7) |
| Taurine (Tau) | 100 ± 3 (10) | 103 ± 9 (7) | 101 ± 5 (5) | 99 ± 2 (12) | 109 ± 5 (7) | 101 ± 3 (7) |
| myo-Inositol (Ins) | 100 ± 5 (12) | 114 ± 4 (6) | 97 ± 5 (5) | 103 ± 4 (12) | 107 ± 5 (7) | 104 ± 4 (7) |
p < 0.05 compared to wild-type mice within each treatment group by two-way repeated measures analysis of varience (ANOVA) followed by Tukey post hoc test for individual comparisons.
p < 0.05 compared to basal level within each genotype by two-way repeated measures ANOVA followed by Tukey post hoc test for individual comparisons. Metabolites are measured relative to total creatine. All data are expressed as percent baseline ± SEM relative to wild-type basal level. Number within parentheses is the number of animals included for each metabolite at each condition based on Cramer-Rao lower bounds.
Fig. 3.

Altered γ-aminobutyric acid (GABA) and glutamate levels during ethanol withdrawal and acamprosate treatment effect in ENT1 null and wild-type mice. (A) GABA is significantly reduced in the medial prefrontal cortex (mPFC) of wild-type and ENT1 null mice during ethanol withdrawal. Acamprosate treatment (200 mg/kg/injection twice a day) reversed this effect in ENT1 null mice. (B) Glutamate + glutamine (Glx) levels were significantly increased during ethanol withdrawal in the nucleus accumbens (NAc) of wild-type mice while basal Glx levels in ENT1 null mice were significantly increased compared to wild-type mice. Acamprosate treatment reduced Glx in both wild-type and ENT1 null mice compared to withdrawal conditions. All data are presented as mean percent of wild-type basal level ± standard error of the mean (SEM). * p < 0.05 by two-way repeated measures ANOVA followed by Tukey post-hoc test for individual comparisons.
3.5. Acamprosate treatment increases ethanol withdrawal-reduced GABA in the prefrontal cortex of ENT1 null mice
Since acamprosate is known to mimic GABA and activate GABAA or GABAB receptor (Dahchour and De Witte, 1999; Daoust et al., 1992), we asked if acamprosate reverses the reduced mPFC GABA levels observed during ethanol withdrawal (n = 5–8 per metabolite for each genotype). We found that acamprosate treatment during ethanol withdrawal increases GABA and GPC + PCh levels in the mPFC of only ENT1 null mice while no changes were observed in wild-type mice (Fig 3A and Table 1). For GABA, two-way repeated measures ANOVA indicated a significant effect of genotype [F(1,21) = 10.840, p = 0.005], treatment [F(1,21) = 7.144, p = 0.037] and the interaction between genotype and treatment [F(1,21) = 7.296, p = 0.036]. Further Tukey post hoc analysis indicated that acamprosate treatment only increased GABA in ENT1 null mice compared to withdrawal conditions (Fig. 3A). Moreover, when comparing levels of GABA between wild-type and ENT1 null mice, Tukey post hoc analysis indicates that GABA during acamprosate treatment is significantly increased compared to wild-type levels (Fig. 3A). For GPC + PCh, two-way repeated measures ANOVA indicates a significant effect of treatment [F(1,27) = 6.487, p = 0.027] and the interaction between treatment and genotype [F(1,27) = 5.906, p = 0.033] without a significant effect of genotype [F(1,27) = 1.185, p = 0.296]. Further Tukey post hoc analysis indicates that acamprosate only decreases GPC + PCh in ENT1 null mice when comparing ethanol withdrawal and acamprosate treatment.
3.6. Acamprosate treatment reduces Glx levels compared to the withdrawal state in the nucleus accumbens of mice
Since the glutamatergic system was increased in the NAc during ethanol withdrawal, and acamprosate has been shown to successfully reduce accumbal glutamate in ENT1 null mice (Lee et al., 2011), we were interested in seeing if acamprosate was capable of reducing the levels of these metabolite levels (n = 5–7 per metabolite for each genotype). We found that acamprosate treatment during ethanol withdrawal reduced levels of Glx, glutamate, glutamine and GPC + PCh compared to withdrawal conditions in both wild-type and ENT1 null mice (Table 2). For Glx, two-way repeated measures ANOVA indicated a significant effect of treatment [F(1,22) = 12.828, p = 0.009] but not a significant effect of genotype [F(1,22) < 0.001, p = 0.988] or the interaction between genotype and treatment [F(1,22) = 0.900, p = 0.374]. For glutamate, two-way repeated measures ANOVA indicated a significant effect of treatment [F(1,23) = 14.251, p = 0.004] but not a significant effect of genotype [F(1,23) = 0.576, p = 0.463] or the interaction between genotype and treatment [F(1,23) = 3.575, p = 0.091]. For glutamine, two-way repeated measures ANOVA indicated a significant effect of treatment [F(1,21) = 15.322, p = 0.008] but not a significant effect of genotype [F(1,21) = 0.590, p = 0.457] or the interaction between genotype and treatment [F(1,21) = 2.633, p = 0.156]. For GPC + PCh, two-way repeated measures ANOVA indicated a significant effect of treatment [F(1,21) = 13.244, p = 0.011] but not a significant effect of genotype [F(1,21) = 0.014, p = 0.909] or the interaction between genotype and treatment [F(1,21) = 1.736, p = 0.236]. Overall, it appears that acamprosate administration during ethanol withdrawal dampens glutamatergic signaling in the NAc of ENT1 null mice and wild-type mice.
4. Discussion
The present study aimed at the investigation of the effect of acamprosate on brain metabolites of mice during withdrawal from chronic ethanol exposure. Ethanol withdrawal reduced GABA levels (Fig. 4A) and increased phosphorylated choline compounds (GPC + PCh) in the mPFC of wild-type and ENT1 null mice compared to basal levels. Furthermore ethanol withdrawal increased glutamate + glutamine (Glx), glutamate and glutamine levels in the NAc of wild-type mice while a trend for an increased was also observed for ENT1 null mice (Fig. 4A). Our results also demonstrate that acamprosate increased GABA (Fig. 4B) and decreased GPC + PCh compared to withdrawal conditions in the mPFC of ENT1 null mice while no changes were observed in wild-type mice. Finally, in the NAc, acamprosate dampened glutamatergic signaling, reducing Glx, glutamate and glutamine, compared to withdrawal conditions in wild-type and ENT1 null mice (Fig. 4B)
Fig. 4.
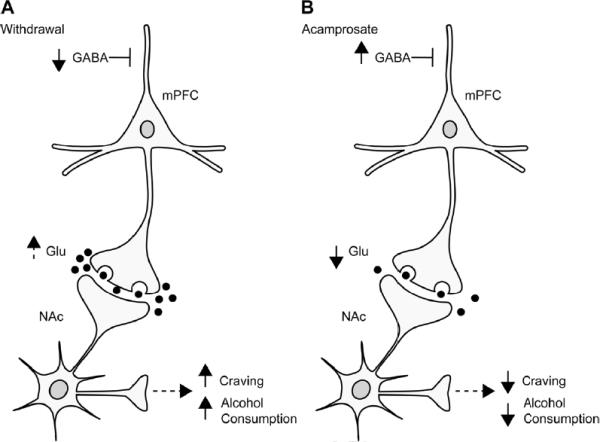
Simplified illustration of the cortical-striatal circuit in ENT1 null mice. (A) During ethanol withdrawal, medial prefrontal cortical γ-aminobutyric acid (GABA) levels are reduced potentially leading to increased (dotted arrow) accumbal glutamate levels, which may result in increased ethanol craving and drinking behaviors. (B) Interestingly, acamprosate normalizes these changes in the mPFC and NAc possibly leading to a reduction of ethanol craving or drinking behavior.
To our knowledge, this is the first in vivo [1H] MRS study to investigate the effects of ethanol withdrawal in the NAc of mice. There have been in vivo microdialysis studies that also show that ethanol withdrawal increases glutamate neurotransmission in the striatum (Rossetti and Carboni, 1995) and more specifically, in the NAc (Dahchour and De Witte, 2000). These data are consistent with the data of the present study as we have found that ethanol withdrawal increases Glx, glutamate and glutamine compared to basal conditions in wild-type mice. Slight increases, although not significant, in Glx, glutamate and glutamine were also observed in ENT1 null mice. It is possible that significance was not achieved since ENT1 null mice already have increased basal Glx, glutamate and glutamine compared to wild-type mice. It is also notable that the majority of metabolites during ethanol withdrawal were similar between genotypes with the exception of glutamine, which was lower during ethanol withdrawal in ENT1 null mice compared to wild-type mice.
Clinical [1H] MRS studies of ethanol dependent patients and ethanol withdrawal have mainly focused on the anterior cingulate, which is part of the prefrontal cortex. Studies analyzing the frontal cingulate cortex of patients with alcohol use disorders have shown increased glutamine and decreased glutamate compared to healthy controls (Thoma et al., 2011). In addition, a recent preclinical and clinical study found that glutamate was increased during acute ethanol withdrawal in rats (12 hours after chronic intermittent ethanol exposure in a vapor chamber) and humans (1 day following admittance to inpatient detoxification) while glutamine was decreased, at least in rats, and suggest the glutamate/glutamine ratio as a potential marker for acute ethanol withdrawal (Hermann et al., 2011). In the present study we did not detect any differences in glutamate or glutamine during ethanol withdrawal compared to basal levels in either wild-type or ENT1 null mice. Since the time of withdrawal is different between these studies, it is possible that we missed the time point when glutamate was increased. We also computed the glutamate/glutamine ratio (data not shown) in the mPFC and again did not find any changes between withdrawal and basal conditions. Interestingly we did find that the basal glutamate/glutamine ratio in ENT1 null mice was significantly increased compared to wild-type mice by two-way repeated measures ANOVA (data not shown). This may provide additional evidence for the use of ENT1 null mice for the study of alcohol use disorders.
We did however observed significantly reduced GABA in the mPFC during ethanol withdrawal compared to basal conditions in both ENT1 null and wild-type mice. GABA levels have been shown to be significantly reduced following 1 month of sobriety from ethanol in the occipital cortex of non-smoker ethanol dependent patients measured by [1H] MRS (Mason et al., 2006) as well as in cerebral spinal fluid (Tsai and Coyle, 1998) and blood samples (Adinoff et al., 1995) from alcohol dependent patients compared to controls. A few studies have examined brain GABA levels in animals withdrawn from ethanol. Ethanol withdrawal has also been shown to significantly reduce GABA inhibitory function in the inferior collicular cortex which my result in increased seizure susceptibility (Faingold et al., 2000; McCown and Breese, 1993). Moreover, GABA is significantly reduced in the NAc of alcoholized rats not in a period of ethanol withdrawal (Dahchour and De Witte, 1999). However, no significant changes were observed in levels of GABA in the hippocampus during repeated cycles of ethanol withdrawal (Dahchour and De Witte, 2003). In addition, both acute and chronic ethanol administration have been shown to increase GABA levels in the central amygdala of rats (Roberto et al., 2004). Taken together with our findings, further study of the changes in GABA or glutamate concentrations in the cortical-striatal circuit is warranted for clinical [1H] MRS studies in alcohol-dependent subjects.
Animal microdialysis studies have shown that acamprosate blocks the glutamate increase caused by ethanol withdrawal in the striatum (Dahchour and De Witte, 1999; Dahchour et al., 1998) and hippocampus (De Witte, 2004). Our recent [1H] MRS study also suggest that acute acamprosate reduces glutamate levels compared to saline treatment in the nucleus accumbens of ENT1 null mice (Lee et al., 2011). In the present study, acamprosate reduced Glx, glutamate and glutamine compared to withdrawal conditions in the NAc of wild-type and ENT1 null mice. Moreover, in clinical studies, acamprosate treatment has been shown to reduce glutamate levels in the anterior cingulate of detoxified alcohol-dependent patients as well as in the cortex of healthy individuals, both measured by [1H] MRS (Bolo et al., 1998; Umhau et al., 2010). Here we did not detect changes in glutamate as a result of acamprosate treatment in the mPFC, which includes the anterior cingulate, prelimbic cortex, and infralimbic cortex. It is possible that there is differential regulation of glutamate in these different areas of the mPFC that could possibly be responsible for the lack of an observed glutamate change in the mPFC of mice in our study. We did however detect an increase in GABA as a result of acamprosate treatment compared to ethanol withdrawal in ENT1 null mice, but not in wild-type mice. Interestingly, activation of adenosine receptors in the cortex inhibits the release of GABA (O'Regan et al., 1992). Since ENT1 null mice exhibit reduced adenosine levels in the striatum (Kim et al., 2011), although we have not measured adenosine levels in the mPFC or increased basal GABA levels in ENT1 null mice compared to wild-type mice in the mPFC, it is possible that hypo-adenosine increases GABA release in response to acamprosate. Others have also detected that GABA is increased during acamprosate treatment compared to ethanol dependent rats however this was a microdialysis study in the nucleus accumbens (Dahchour and De Witte, 2000). Since it is difficult to reliably measure GABA levels using 3T [1H] MRS for clinical application, our preclinical [1H] MRS findings provide a novel perspective of the pharmacological effects of acamprosate in the mPFC. Development and further use of clinical MR spectrometers with a magnetic field strength above 3T will be useful for the analysis of GABA resonances in the human brain (Deelchand et al., 2010).
It is also noteworthy that ethanol is capable of modulating GABAB receptor expression in the cortex of rat brain (Li et al., 2005). Interestingly, GABAB receptor agonists such as baclofen actually prevent the acquisition of ethanol drinking behaviors (Colombo et al., 2002; Quintanilla et al., 2008) and attenuates cue induced reinstatement of ethanol seeking behavior (Maccioni et al., 2008) in alcohol preferring rats. In addition, in clinical studies, baclofen has also been shown to be effective in reducing alcohol craving and consumption in alcohol patients (Addolorato et al., 2002). Moreover, GABAA receptor agonists such as topiramate, which is also a Glu5-containing AMPA receptor antagonist, has also been shown to be a potential new treatment for alcohol use disorders (Kenna et al., 2009) and reduce ethanol consumption in rats (Breslin et al., 2010). Therefore, our data also suggest the importance of the potential agonism of the GABAergic system in the mPFC during a state of ethanol withdrawal. This is consistent with previous studies, investigating potential genetic determinants of alcohol consumption in both rats and humans, which found that lower inherent GABAergic tone predisposes to higher alcohol consumption (Tabakoff et al., 2009).
In this study we also observed decreased NAA in the NAc during ethanol withdrawal in both wild-type and ENT1 null mice. Several previous [1H] MRS studies have also shown that NAA is reduced in several brain regions in abstinent alcoholics including the frontal lobes, thalamus and the cerebellum (Jagannathan et al., 1996; Meyerhoff and Durazzo, 2008; Licata and Renshaw, 2010). One possible explanation for the reduction of NAA may be that there is general neuronal loss or damage caused by the neurotoxic effects of alcohol or just overall dysregulation of neuronal function (Choi et al., 2007; Licata and Renshaw, 2010). It is interesting to note that acamprosate treatment did not recover the reduced NAA observed in the NAc during ethanol withdrawal. This would be consistent with neuronal loss or that acamprosate is not affecting mechanisms associated with NAA recovery.
Phosphorylated choline compound levels have been reported to be reduced in alcohol dependent patients compared to control subjects as measured by [1H] MRS following 1 month of abstinence (Jagannathan et al., 1996; Licata and Renshaw, 2010). Reduced choline containing compounds may change the membrane lipid content of patients with alcohol use disorders (Ende et al., 2005; Jagannathan et al., 1996). On the other hand, Meyerhoff et al. reported increased choline-containing compounds in the parietal gray matter of chronic heavy drinkers compared to light drinkers following 12 hours of abstinence, which was more evident in binge drinkers compared to non-binge drinkers of the heavy drinker group (Meyerhoff et al., 2004). A more recent report by this group also found that choline-containing compounds were increased in treatment-naïve heavy drinkers or non-smoking light drinkers compared to treated alcoholic patients following 1 week of abstinence in several regions of the brain including both white and gray matter (Gazdzinski et al., 2008). It appears that the observed change in phosphorylated choline compounds depends on when the subject was scanned. This is especially evident as short-term forced alcohol consumption (one-bottle choice for 16 weeks) increases levels of phosphorylated choline compounds while long-term alcohol treatment in a similar behavioral setup (44–60 weeks) decreases these levels compared to a control group drinking water in the thalamus of the rat using [1H] MRS (Lee et al., 2003). In the present study we have measured increased phosphorylated choline compounds during ethanol withdrawal compared to basal conditions in the mPFC of both wild-type and ENT1 null mice. It may be possible that this increased GPC + PCh signal represents a condition of rapid membrane turnover (Choi et al., 2007). This may also be consistent with the presentation of gliosis (Gazdzinski et al., 2008; Meyerhoff et al., 2004). It is interesting to note that acamprosate treatment reduced GPC + PCh in the NAc of both wild-type and ENT1 null mice compared to withdrawal conditions. Moreover, acamprosate also reduced phosphorylated choline compounds in the mPFC of ENT1 null mice compared to a condition of ethanol withdrawal while no such change was observed in wild-type mice under the some conditions. This differential effect of acamprosate suggests that ENT1 deficiency may increase responsiveness to acamprosate in the mPFC, which may partially explain why acamprosate was only effective in reducing alcohol in ENT1 null mice and not in wild-type mice (Lee et al., 2011). However, further investigation is required to identify how ethanol or acamprosate could alter phosphorylated choline compounds because a recent clinical study did not observe a significant change in phosphorylated choline compounds in the anterior cingulate of detoxified alcohol-dependent patients following acamprosate treatment (Umhau et al., 2010).
One potential limitation of this study is that the brain regions analyzed are not perfectly cubic such that it is inevitable that partial volumes of other surrounding brain regions (< 10%) may be included within the selected volume of interest. Nonetheless, the voxels used are of standard size for measuring the metabolite profile of tissue containing the mPFC (Hermann et al., 2011) or NAc (Lee et al., 2011; Tkac et al., 2004) in mice. In addition, [1H] MRS measures total metabolite levels including both intracellular and extracellular concentrations, not just functional (extracellular) levels as with microdialysis so one should use caution when interpreting the results although, in our experience, some of the data between microdialysis and [1H] MRS experiments overlaps including the observation of increased glutamate levels between ENT null and wild-type mice in the NAc by both microdialysis (Lee et al., 2011; Nam et al., 2011) and [1H] MRS (Lee et al., 2011; Tkac et al., 2004). With [1H] MRS we were unable to measure all metabolites with the same level of confidence and did not report metabolites such as alanine or lactate in the present manuscript owing to high Cramér-Rao lower bounds values.
In summary, our data suggests that GABA levels in the mPFC are reduced while glutamate in the NAc is increased during withdrawal from chronic ethanol exposure. Furthermore, our results indicate that acamprosate treatment may be capable of reversing some of these changes that occur during ethanol withdrawal. Specifically, acamprosate dampened the glutamatergic system and phosphorylated choline compounds compared to withdrawal conditions in the NAc of wild-type and ENT1 null mice. In addition, acamprosate increased GABA and decreased GPC + PCh in the mPFC only in ENT1 null mice. This difference in the effect of acamprosate on the metabolite profile of ENT1 null mice compared to wild-type mice may provide insight into the reason for why acamprosate was only effective in ENT1 null mice in reducing ethanol consumption (Lee et al., 2011). In addition, this study provides important new insights for our understanding of ethanol withdrawal and the effect of acamprosate treatment in the cortical-striatal circuit.
Highlights
-
▶
Ethanol withdrawal reduces prefrontal cortical GABA in mice.
-
▶
Ethanol withdrawal increases accumbal glutamate levels in wild-type mice.
-
▶
Acamprosate normalizes these withdrawal-induced changes in mice.
Acknowledgements
We thank S. Choi for mouse husbandry. We thank S. Provencher for providing the LCModel basis sets and J. Port for his assistance in using LCModel. This project was funded by the Samuel Johnson Foundation for Genomics of Addiction Program at Mayo Clinic and by grants from the National Institutes of Health (NIH) to D. -S. C. (P20 AA017830-Project 1) and to S. I. M. (P20 AA017830-Project 3).
Footnotes
Publisher's Disclaimer: This is a PDF file of an unedited manuscript that has been accepted for publication. As a service to our customers we are providing this early version of the manuscript. The manuscript will undergo copyediting, typesetting, and review of the resulting proof before it is published in its final citable form. Please note that during the production process errors may be discovered which could affect the content, and all legal disclaimers that apply to the journal pertain.
References
- Addolorato G, Caputo F, Capristo E, Domenicali M, Bernardi M, Janiri L, Agabio R, Colombo G, Gessa GL, Gasbarrini G. Baclofen efficacy in reducing alcohol craving and intake: a preliminary double-blind randomized controlled study. Alcohol Alcohol. 2002;37:504–508. doi: 10.1093/alcalc/37.5.504. [DOI] [PubMed] [Google Scholar]
- Adinoff B, Kramer GL, Petty F. Levels of gamma-aminobutyric acid in cerebrospinal fluid and plasma during alcohol withdrawal. Psychiatry Res. 1995;59:137–144. doi: 10.1016/0165-1781(95)02739-4. [DOI] [PubMed] [Google Scholar]
- Anton RF, O'Malley SS, Ciraulo DA, Cisler RA, Couper D, Donovan DM, Gastfriend DR, Hosking JD, Johnson BA, LoCastro JS, Longabaugh R, Mason BJ, Mattson ME, Miller WR, Pettinati HM, Randall CL, Swift R, Weiss RD, Williams LD, Zweben A. Combined pharmacotherapies and behavioral interventions for alcohol dependence: the COMBINE study: a randomized controlled trial. J. Am. Med.l Assoc. 2006;295:2003–2017. doi: 10.1001/jama.295.17.2003. [DOI] [PubMed] [Google Scholar]
- Anton RF, Swift RM. Current pharmacotherapies of alcoholism: a U.S. perspective. Am. J. Addict. 2003;12(Suppl 1):S53–68. doi: 10.1111/j.1521-0391.2003.tb00496.x. [DOI] [PubMed] [Google Scholar]
- Becker HC, Diaz-Granados JL, Weathersby RT. Repeated ethanol withdrawal experience increases the severity and duration of subsequent withdrawal seizures in mice. Alcohol. 1997;14:319–326. doi: 10.1016/s0741-8329(97)87949-9. [DOI] [PubMed] [Google Scholar]
- Bolo N, Nedelec JF, Muzet M, De Witte P, Dahchour A, Durbin P, Macher JP. Central effects of acamprosate: part 2. Acamprosate modifies the brain in-vivo proton magnetic resonance spectrum in healthy young male volunteers. Psychiatry Res. 1998;82:115–127. doi: 10.1016/s0925-4927(98)00017-1. [DOI] [PubMed] [Google Scholar]
- Breslin FJ, Johnson BA, Lynch WJ. Effect of topiramate treatment on ethanol consumption in rats. Psychopharmacology. 2010;207:529–534. doi: 10.1007/s00213-009-1683-4. [DOI] [PMC free article] [PubMed] [Google Scholar]
- Chen J, Nam HW, Lee MR, Hinton DJ, Choi S, Kim T, Kawamura T, Janak PH, Choi D-S. Altered glutamatergic neurotransmission in the striatum regulates ethanol sensitivity and intake in mice lacking ENT1. Behav. Brain. Res. 2010;208:636–642. doi: 10.1016/j.bbr.2010.01.011. [DOI] [PMC free article] [PubMed] [Google Scholar]
- Choi DS, Cascini MG, Mailliard W, Young H, Paredes P, McMahon T, Diamond I, Bonci A, Messing RO. The type 1 equilibrative nucleoside transporter regulates ethanol intoxication and preference. Nat. Neurosci. 2004;7:855–861. doi: 10.1038/nn1288. [DOI] [PubMed] [Google Scholar]
- Choi JK, Dedeoglu A, Jenkins BG. Application of MRS to mouse models of neurodegenerative illness. NMR Biomed. 2007;20:216–237. doi: 10.1002/nbm.1145. [DOI] [PubMed] [Google Scholar]
- Collins PY, Patel V, Joestl SS, March D, Insel TR, Daar AS, Anderson W, Dhansay MA, Phillips A, Shurin S, Walport M, Ewart W, Savill SJ, Bordin IA, Costello EJ, Durkin M, Fairburn C, Glass RI, Hall W, Huang Y, Hyman SE, Jamison K, Kaaya S, Kapur S, Kleinman A, Ogunniyi A, Otero-Ojeda A, Poo MM, Ravindranath V, Sahakian BJ, Saxena S, Singer PA, Stein DJ. Grand challenges in global mental health. Nature. 2011;475:27–30. doi: 10.1038/475027a. [DOI] [PMC free article] [PubMed] [Google Scholar]
- Colombo G, Serra S, Brunetti G, Atzori G, Pani M, Vacca G, Addolorato G, Froestl W, Carai MA, Gessa GL. The GABA(B) receptor agonists baclofen and CGP 44532 prevent acquisition of alcohol drinking behaviour in alcohol-preferring rats. Alcohol Alcohol. 2002;37:499–503. doi: 10.1093/alcalc/37.5.499. [DOI] [PubMed] [Google Scholar]
- D'Souza El-Guindy NB, Kovacs EJ, De Witte P, Spies C, Littleton JM, de Villiers WJ, Lott AJ, Plackett TP, Lanzke N, Meadows GG. Laboratory models available to study alcohol-induced organ damage and immune variations: choosing the appropriate model. Alcohol. Clin. Exp. Res. 2010;34:1489–1511. doi: 10.1111/j.1530-0277.2010.01234.x. [DOI] [PMC free article] [PubMed] [Google Scholar]
- Dahchour A, De Witte P. Acamprosate decreases the hypermotility during repeated ethanol withdrawal. Alcohol. 1999;18:77–81. doi: 10.1016/s0741-8329(98)00071-8. [DOI] [PubMed] [Google Scholar]
- Dahchour A, De Witte P. Ethanol and amino acids in the central nervous system: assessment of the pharmacological actions of acamprosate. Prog. Neurobiol. 2000;60:343–362. doi: 10.1016/s0301-0082(99)00031-3. [DOI] [PubMed] [Google Scholar]
- Dahchour A, De Witte P. Excitatory and inhibitory amino acid changes during repeated episodes of ethanol withdrawal: an in vivo microdialysis study. Eur. J. Pharmacol. 2003;459:171–178. doi: 10.1016/s0014-2999(02)02851-0. [DOI] [PubMed] [Google Scholar]
- Dahchour A, De Witte P, Bolo N, Nedelec JF, Muzet M, Durbin P, Macher JP. Central effects of acamprosate: part 1. Acamprosate blocks the glutamate increase in the nucleus accumbens microdialysate in ethanol withdrawn rats. Psychiatry Res. 1998;82:107–114. doi: 10.1016/s0925-4927(98)00016-x. [DOI] [PubMed] [Google Scholar]
- Daoust M, Legrand E, Gewiss M, Heidbreder C, DeWitte P, Tran G, Durbin P. Acamprosate modulates synaptosomal GABA transmission in chronically alcoholised rats. Pharmacol. Biochem. Behav. 1992;41:669–674. doi: 10.1016/0091-3057(92)90210-7. [DOI] [PubMed] [Google Scholar]
- De Witte P. Imbalance between neuroexcitatory and neuroinhibitory amino acids causes craving for ethanol. Addict. Behav. 2004;29:1325–1339. doi: 10.1016/j.addbeh.2004.06.020. [DOI] [PubMed] [Google Scholar]
- De Witte P, Littleton J, Parot P, Koob G. Neuroprotective and abstinence promoting effects of acamprosate: elucidating the mechanism of action. CNS Drugs. 2005;19:517–537. doi: 10.2165/00023210-200519060-00004. [DOI] [PubMed] [Google Scholar]
- Deelchand DK, Van de Moortele PF, Adriany G, Iltis I, Andersen P, Strupp JP, Vaughan JT, Ugurbil K, Henry PG. In vivo 1H NMR spectroscopy of the human brain at 9.4 T: initial results. J. Mag. Res. 2010;206:74–80. doi: 10.1016/j.jmr.2010.06.006. [DOI] [PMC free article] [PubMed] [Google Scholar]
- Ende G, Welzel H, Walter S, Weber-Fahr W, Diehl A, Hermann D, Heinz A, Mann K. Monitoring the effects of chronic alcohol consumption and abstinence on brain metabolism: a longitudinal proton magnetic resonance spectroscopy study. Biol. Psychiatry. 2005;58:974–980. doi: 10.1016/j.biopsych.2005.05.038. [DOI] [PubMed] [Google Scholar]
- Faingold C, Li Y, Evans MS. Decreased GABA and increased glutamate receptor-mediated activity on inferior colliculus neurons in vitro are associated with susceptibility to ethanol withdrawal seizures. Brain Res. 2000;868:287–295. doi: 10.1016/s0006-8993(00)02342-8. [DOI] [PubMed] [Google Scholar]
- Gass N, Ollila HM, Utge S, Partonen T, Kronholm E, Pirkola S, Suhonen J, Silander K, Porkka-Heiskanen T, Paunio T. Contribution of adenosine related genes to the risk of depression with disturbed sleep. J. Affect. Disord. 2010;126:134–139. doi: 10.1016/j.jad.2010.03.009. [DOI] [PubMed] [Google Scholar]
- Gazdzinski S, Durazzo TC, Weiner MW, Meyerhoff DJ. Are treated alcoholics representative of the entire population with alcohol use disorders? A magnetic resonance study of brain injury. Alcohol. 2008;42:67–76. doi: 10.1016/j.alcohol.2008.01.002. [DOI] [PMC free article] [PubMed] [Google Scholar]
- Hall W, Zador D. The alcohol withdrawal syndrome. Lancet. 1997;349:1897–1900. doi: 10.1016/S0140-6736(97)04572-8. [DOI] [PubMed] [Google Scholar]
- Hermann D, Weber-Fahr W, Sartorius A, Hoerst M, Frischknecht U, Tunc-Skarka N, Perreau-Lenz S, Hansson AC, Krumm B, Kiefer F, Spanagel R, Mann K, Ende G, Sommer WH. Translational Magnetic Resonance Spectroscopy Reveals Excessive Central Glutamate Levels During Alcohol Withdrawal in Humans and Rats. Biol. Psychiatry. 2011 doi: 10.1016/j.biopsych.2011.07.034. In Press. [DOI] [PubMed] [Google Scholar]
- Holmes A. Merger fever: can two separate mechanisms work together to explain why we drink? Biol. Psychiatry. 2011;69:1015–1016. doi: 10.1016/j.biopsych.2011.04.010. [DOI] [PMC free article] [PubMed] [Google Scholar]
- Jagannathan NR, Desai NG, Raghunathan P. Brain metabolite changes in alcoholism: an in vivo proton magnetic resonance spectroscopy (MRS) study. Magn. Reson. Imaging. 1996;14:553–557. doi: 10.1016/0730-725x(96)00048-3. [DOI] [PubMed] [Google Scholar]
- Jensen JE, Licata SC, Ongur D, Friedman SD, Prescot AP, Henry ME, Renshaw PF. Quantification of J-resolved proton spectra in two-dimensions with LCModel using GAMMA-simulated basis sets at 4 Tesla. NMR Biomed. 2009;22:762–769. doi: 10.1002/nbm.1390. [DOI] [PubMed] [Google Scholar]
- Kalivas PW, Volkow ND. New medications for drug addiction hiding in glutamatergic neuroplasticity. Mol. Psychiatry. 2011;16:974–986. doi: 10.1038/mp.2011.46. [DOI] [PMC free article] [PubMed] [Google Scholar]
- Kenna GA, Lomastro TL, Schiesl A, Leggio L, Swift RM. Review of topiramate: an antiepileptic for the treatment of alcohol dependence. Curr. Drug. Abuse Rev. 2009;2:135–142. doi: 10.2174/1874473710902020135. [DOI] [PubMed] [Google Scholar]
- Kim JH, Karpyak VM, Biernacka JM, Nam HW, Lee MR, Preuss UW, Zill P, Yoon G, Colby C, Mrazek DA, Choi DS. Functional role of the polymorphic 647 T/C variant of ENT1 (SLC29A1) and its association with alcohol withdrawal seizures. PLoS One. 2011;6:e16331. doi: 10.1371/journal.pone.0016331. [DOI] [PMC free article] [PubMed] [Google Scholar]
- Lee H, Holburn GH, Price RR. Proton MR spectroscopic studies of chronic alcohol exposure on the rat brain. J. Mag. Res. Imaging. 2003;18:147–151. doi: 10.1002/jmri.10335. [DOI] [PubMed] [Google Scholar]
- Lee MR, Hinton DJ, Wu J, Mishra PK, Port JD, Macura SI, Choi DS. Acamprosate reduces ethanol drinking behaviors and alters the metabolite profile in mice lacking ENT1. Neurosci. Lett. 2011;490:90–95. doi: 10.1016/j.neulet.2010.12.033. [DOI] [PMC free article] [PubMed] [Google Scholar]
- Li SP, Park MS, Jin GZ, Kim JH, Lee HL, Lee YL, Bahk JY, Park TJ, Koh PO, Chung BC, Kim MO. Ethanol modulates GABA(B) receptor expression in cortex and hippocampus of the adult rat brain. Brain Res. 2005;1061:27–35. doi: 10.1016/j.brainres.2005.08.052. [DOI] [PubMed] [Google Scholar]
- Licata SC, Renshaw PF. Neurochemistry of drug action: insights from proton magnetic resonance spectroscopic imaging and their relevance to addiction. Annu. N. Y. Acad. Sci. 2010;1187:148–171. doi: 10.1111/j.1749-6632.2009.05143.x. [DOI] [PMC free article] [PubMed] [Google Scholar]
- Maccioni P, Bienkowski P, Carai MA, Gessa GL, Colombo G. Baclofen attenuates cue-induced reinstatement of alcohol-seeking behavior in Sardinian alcohol-preferring (sP) rats. Drug Alcohol Depend. 2008;95:284–287. doi: 10.1016/j.drugalcdep.2008.02.006. [DOI] [PubMed] [Google Scholar]
- Mann K. Pharmacotherapy of alcohol dependence: a review of the clinical data. CNS Drugs. 2004;18:485–504. doi: 10.2165/00023210-200418080-00002. [DOI] [PubMed] [Google Scholar]
- Mann K, Kiefer F, Spanagel R, Littleton J. Acamprosate: recent findings and future research directions. Alcohol. Clin. Exp. Res. 2008;32:1105–1110. doi: 10.1111/j.1530-0277.2008.00690.x. [DOI] [PubMed] [Google Scholar]
- Mann K, Lehert P, Morgan MY. The efficacy of acamprosate in the maintenance of abstinence in alcohol-dependent individuals: results of a meta-analysis. Alcohol. Clin. Exp. Res. 2004;28:51–63. doi: 10.1097/01.ALC.0000108656.81563.05. [DOI] [PubMed] [Google Scholar]
- Mason GF, Petrakis IL, de Graaf RA, Gueorguieva R, Guidone E, Coric V, Epperson CN, Rothman DL, Krystal JH. Cortical gamma-aminobutyric acid levels and the recovery from ethanol dependence: preliminary evidence of modification by1 cigarette smoking. Biol. Psychiatry. 2006;59:85–93. doi: 10.1016/j.biopsych.2005.06.009. [DOI] [PubMed] [Google Scholar]
- McCown TJ, Breese GR. A potential contribution to ethanol withdrawal kindling: reduced GABA function in the inferior collicular cortex. Alcohol. Clin. Exp. Res. 1993;17:1290–1294. doi: 10.1111/j.1530-0277.1993.tb05243.x. [DOI] [PubMed] [Google Scholar]
- Melendez RI, Kalivas PW. Last call for adenosine transporters. Nat. Neurosci. 2004;7:795–796. doi: 10.1038/nn0804-795. [DOI] [PubMed] [Google Scholar]
- Metten P, Sorensen ML, Cameron AJ, Yu CH, Crabbe JC. Withdrawal Severity After Chronic Intermittent Ethanol in Inbred Mouse Strains. Alcohol. Clin. Exp. Res. 2010;34:1552–1564. doi: 10.1111/j.1530-0277.2010.01240.x. [DOI] [PMC free article] [PubMed] [Google Scholar]
- Meyerhoff DJ, Blumenfeld R, Truran D, Lindgren J, Flenniken D, Cardenas V, Chao LL, Rothlind J, Studholme C, Weiner MW. Effects of heavy drinking, binge drinking, and family history of alcoholism on regional brain metabolites. Alcohol. Clin. Exp. Res. 2004;28:650–661. doi: 10.1097/01.ALC.0000121805.12350.CA. [DOI] [PMC free article] [PubMed] [Google Scholar]
- Meyerhoff DJ, Durazzo TC. Proton magnetic resonance spectroscopy in alcohol use disorders: a potential new endophenotype? Alcohol. Clin. Exp. Res. 2008;32:1146–1158. doi: 10.1111/j.1530-0277.2008.00695.x. [DOI] [PMC free article] [PubMed] [Google Scholar]
- Moore GJ, Galloway MP. Magnetic resonance spectroscopy: neurochemistry and treatment effects in affective disorders. Psychopharmacol. Bull. 2002;36:5–23. [PubMed] [Google Scholar]
- Morley KC, Teesson M, Reid SC, Sannibale C, Thomson C, Phung N, Weltman M, Bell JR, Richardson K, Haber PS. Naltrexone versus acamprosate in the treatment of alcohol dependence: A multi-centre, randomized, double-blind, placebo-controlled trial. Addiction. 2006;101:1451–1462. doi: 10.1111/j.1360-0443.2006.01555.x. [DOI] [PubMed] [Google Scholar]
- Nagy LE, Diamond I, Casso DJ, Franklin C, Gordon AS. Ethanol increases extracellular adenosine by inhibiting adenosine uptake via the nucleoside transporter. J. Biol. Chem. 1990;265:1946–1951. [PubMed] [Google Scholar]
- Nam HW, Lee MR, Hinton DJ, Choi D-S. Reduced effect of NMDA glutamate receptor antagonist on ethanol-induced ataxia and striatal glutamate levels in mice lacking ENT1. Neurosci. Lett. 2010;479:277–81. doi: 10.1016/j.neulet.2010.05.079. [DOI] [PMC free article] [PubMed] [Google Scholar]
- Nam HW, Lee MR, Zhu Y, Wu J, Hinton DJ, Choi S, Kim T, Hammack N, Yin JC, Choi DS. Type 1 equilibrative nucleoside transporter regulates ethanol drinking through accumbal N-methyl-d-aspartate receptor signaling. Biol. Psychiatry. 2011;69:1043–1051. doi: 10.1016/j.biopsych.2011.02.013. [DOI] [PMC free article] [PubMed] [Google Scholar]
- O'Regan MH, Simpson RE, Perkins LM, Phillis JW. Adenosine receptor agonists inhibit the release of gamma-aminobutyric acid (GABA) from the ischemic rat cerebral cortex. Brain Res. 1992;582:22–26. doi: 10.1016/0006-8993(92)90312-w. [DOI] [PubMed] [Google Scholar]
- Parkinson FE, Xiong W, Zamzow CR, Chestley T, Mizuno T, Duckworth ML. Transgenic expression of human equilibrative nucleoside transporter 1 in mouse neurons. J. Neurochem. 2009;109:562–572. doi: 10.1111/j.1471-4159.2009.05991.x. [DOI] [PubMed] [Google Scholar]
- Paxinos D, Franklin KBJ. The Mouse Brain Stereotaxic Coordinates. 3rd ed. Elsevier Academic Press; San Diego, CA: 2008. [Google Scholar]
- Provencher SW. Estimation of metabolite concentrations from localized in vivo proton NMR spectra. Magn. Reson. Med. 1993;30:672–679. doi: 10.1002/mrm.1910300604. [DOI] [PubMed] [Google Scholar]
- Provencher SW. Automatic quantitation of localized in vivo 1H spectra with LCModel. NMR Biomed. 2001;14:260–264. doi: 10.1002/nbm.698. [DOI] [PubMed] [Google Scholar]
- Putzke J, Spanagel R, Tolle TR, Zieglgansberger W. The anti-craving drug acamprosate reduces c-fos expression in rats undergoing ethanol withdrawal. Eur. J. Pharmacol. 1996;317:39–48. doi: 10.1016/s0014-2999(96)00696-6. [DOI] [PubMed] [Google Scholar]
- Quintanilla ME, Perez E, Tampier L. Baclofen reduces ethanol intake in high-alcohol-drinking University of Chile bibulous rats. Addict. Biol. 2008;13:326–336. doi: 10.1111/j.1369-1600.2008.00102.x. [DOI] [PubMed] [Google Scholar]
- Roberto M, Madamba SG, Stouffer DG, Parsons LH, Siggins GR. Increased GABA release in the central amygdala of ethanol-dependent rats. The J. Neurosci. 2004;24:10159–10166. doi: 10.1523/JNEUROSCI.3004-04.2004. [DOI] [PMC free article] [PubMed] [Google Scholar]
- Rossetti ZL, Carboni S. Ethanol withdrawal is associated with increased extracellular glutamate in the rat striatum. Eur J Pharmacol. 1995;283:177–183. doi: 10.1016/0014-2999(95)00344-k. [DOI] [PubMed] [Google Scholar]
- Spanagel R. Alcoholism: a systems approach from molecular physiology to addictive behavior. Physiol. Rev. 2009;89:649–705. doi: 10.1152/physrev.00013.2008. [DOI] [PubMed] [Google Scholar]
- Spanagel R, Kiefer F. Drugs for relapse prevention of alcoholism: ten years of progress. Trends Pharmacol Sci. 2008;29:109–115. doi: 10.1016/j.tips.2007.12.005. [DOI] [PubMed] [Google Scholar]
- Stacey D, Clarke TK, Schumann G. The genetics of alcoholism. Curr. Psychiatry Rep. 2009;11:364–369. doi: 10.1007/s11920-009-0055-4. [DOI] [PubMed] [Google Scholar]
- Swift RM. Medications and alcohol craving. Alcohol Res. Health. 1999;23:207–213. [PMC free article] [PubMed] [Google Scholar]
- Tabakoff B, Saba L, Printz M, Flodman P, Hodgkinson C, Goldman D, Koob G, Richardson HN, Kechris K, Bell RL, Hubner N, Heinig M, Pravenec M, Mangion J, Legault L, Dongier M, Conigrave KM, Whitfield JB, Saunders J, Grant B, Hoffman PL. Genetical genomic determinants of alcohol consumption in rats and humans. BMC Biology. 2009;7:70. doi: 10.1186/1741-7007-7-70. [DOI] [PMC free article] [PubMed] [Google Scholar]
- Thoma R, Mullins P, Ruhl D, Monnig M, Yeo RA, Caprihan A, Bogenschutz M, Lysne P, Tonigan S, Kalyanam R, Gasparovic C. Perturbation of the glutamate-glutamine system in alcohol dependence and remission. Neuropsychopharmacology. 2011;36:1359–1365. doi: 10.1038/npp.2011.20. [DOI] [PMC free article] [PubMed] [Google Scholar]
- Tkac I, Henry PG, Andersen P, Keene CD, Low WC, Gruetter R. Highly resolved in vivo 1H NMR spectroscopy of the mouse brain at 9.4 T. Magn. Reson. Med. 2004;52:478–484. doi: 10.1002/mrm.20184. [DOI] [PubMed] [Google Scholar]
- Tsai G, Coyle JT. The role of glutamatergic neurotransmission in the pathophysiology of alcoholism. Annu. Rev. Med. 1998;49:173–184. doi: 10.1146/annurev.med.49.1.173. [DOI] [PubMed] [Google Scholar]
- Tsai G, Gastfriend DR, Coyle JT. The glutamatergic basis of human alcoholism. Am. J. Psychiatry. 1995;152:332–340. doi: 10.1176/ajp.152.3.332. [DOI] [PubMed] [Google Scholar]
- Tsai GE, Ragan P, Chang R, Chen S, Linnoila VM, Coyle JT. Increased glutamatergic neurotransmission and oxidative stress after alcohol withdrawal. Am. J. Psychiatry. 1998;155:726–732. doi: 10.1176/ajp.155.6.726. [DOI] [PubMed] [Google Scholar]
- Umhau JC, Momenan R, Schwandt ML, Singley E, Lifshitz M, Doty L, Adams LJ, Vengeliene V, Spanagel R, Zhang Y, Shen J, George DT, Hommer D, Heilig M. Effect of acamprosate on magnetic resonance spectroscopy measures of central glutamate in detoxified alcohol-dependent individuals: a randomized controlled experimental medicine study. Arch. Gen. Psychiatry. 2010;67:1069–1077. doi: 10.1001/archgenpsychiatry.2010.125. [DOI] [PMC free article] [PubMed] [Google Scholar]