

Abstract
Underlying glomerulotubular balance (GTB) is the impact of axial flow to regulate Na+ and HCO3− transport by modulating Na+-H+ exchanger 3 (NHE3) and H-ATPase activity. It is not known whether the cascade of events following a change in flow relies on local angiotensin (ANG II) generation or receptor availability. Mouse tubules were microperfused in vitro at flows of 5 and 20 nl/min, and net fluid (Jv) and HCO3− (JHCO3) absorption and cell height were measured. Na+ (JNa) and Cl− (JCl) absorption and changes in microvillous torque were estimated. Raising flow increased Na+ and HCO3− reabsorption but did not change either Cl− transport or cell volume. Losartan reduced absolute Na+ and HCO3− absorption at both low and high flows but did not affect fractional flow-stimulated transport. Compared with controls, in AT1a knockout (KO) mouse tubules, 53% of flow-stimulated Na+ absorption was abolished, but flow-stimulated HCO3− absorption was retained at similar levels. The remaining flow-stimulated JHCO3 was eliminated by the H-ATPase inhibitor bafilomycin. Inhibition of the AT2 receptor by PD123319 increased both JNa and JHCO3 but did not affect flow-mediated fractional changes. NHE3 expression at the protein level was reduced in AT1a KO mice kidneys. We conclude that 1) although the AT1a receptor is necessary for flow to impact NHE3, the effect on H+-ATPase is independent of AT1a; 2) the small flow-mediated changes in cell volume suggest a coordinate flow effect on both luminal and basolateral transporters; and 3) there is no evidence of flow-dependent Cl− transport, and thus no evidence for convective paracellular Cl− transport in mouse tubules.
Keywords: angiotensin II; kidney proximal tubule; glomerulotubular balance; AT1a,; AT2 receptor; NHE3; H-ATPase
glomerulotubular balance (GTB) refers to the proportional variation of filtered load and fluid and electrolyte reabsorption by the proximal tubule; it derives in large part from flow-dependent modulation of epithelial cell transport. We have previously studied this phenomenon by examining mouse proximal tubules in vitro, measuring volume and HCO3− absorption under different perfusion rates and have demonstrated that both Na/H exchanger 3 (NHE3) and H-ATPase activities are modulated by axial flow (10, 12). This modulation requires an intact actin cytoskeleton (10), and, as initially proposed (18), the afferent signal is flow-dependent torque (bending moment at the apical membrane due to fluid flow) on brush border microvilli (10). These previous studies are summarized elsewhere (49). ANG II directly regulates electrolyte transport along the nephron and is a key antinatriuretic signal in the proximal tubule (24, 48). ANG II can be produced within the proximal tubule from the action of a local renin and angiotensin-converting enzyme on angiotensinogen, synthesized in the liver and filtered at the glomerulus (33). Knockout of the AT1a receptor in the proximal tubule reduced sodium absorption and blood pressure, thus demonstrating an important role of ANG II in systemic salt and water balance (19). Functional opposition of AT1 and AT2 receptors has been found in the regulation of blood pressure and sodium transport, with activation of the AT1 receptor increasing, but the AT2 receptor reducing, blood pressure and sodium absorption (6, 21). Whether alterations in local ANG II concentration or receptor availability are involved in flow-regulated proximal tubule transport is uncertain. Previous studies have reported that ANG II plays a role in the regulation of GTB (60), but others have indicated that the AT1 receptor is not critical for GTB (7).
Studies of mouse proximal tubule cells have reported flow-stimulated AT1 receptor trafficking to the apical membrane, raising the possibility that AT1 receptor trafficking may be important in the functional alteration of tubule transport by fluid shear stress (25). Such experiments provide only indirect evidence of a role of AT1 and ANG II in GTB, and what is missing is direct measurement of the effect of luminal flow on Na+ and HCO3− absorption in the presence of AT1 inhibitors. In the present work, we examine the impact of the AT1 receptor blocker losartan, knockout of AT1a, and AT2 receptor inhibition on flow-mediated Na+ and HCO3− absorption in the proximal tubule in vitro, where there is no endocrine (circulating) ANG II (61). Our goal was to address the question of whether these receptors are implicated in the cascade of events in transduction of axial flow to changes in solute transport. Our results show that AT1 receptor blockade diminishes both Na+ and HCO3− absorption but does not impair the flow-dependent change in these fluxes. Looking more closely, we conclude that the data suggest that the AT1 receptor is important for the flow sensitivity of NHE3 activity, but not for flow-stimulated transport by the H+-ATPase.
METHODS
Animals.
All work with animals was conducted according to an Institutional Animal Care and Use Committee-approved protocol at the Yale School of Medicine. Only female mice were used in this study to avoid the influences of the gender difference in ANG II activity and its receptor expressions (42). The breeding pairs of AT1a knockout (KO) mice (AT1a+/−) were purchased from Jackson Labs (Bar Harbor, ME), and both wild-type (WT) and AT1a−/− mice were reproduced and housed at the Yale University Animal Care facility in New Haven, CT. Animals were maintained on a normal diet and tap water until the day of the experiment. Both age (5–8 wk) and gender (female) were matched among control and all experimental groups. Animals were anesthetized with intraperitoneal pentobarbital sodium (70 mg/kg body wt).
Microperfusion of proximal tubules.
The animals were deeply anesthetized and perfused with Hanks' solution via the peritoneal aorta at the rate of 10 ml/min using Masterflex Pump (Cole-Parmer Instrument). After the blood was completely flushed out, the kidney was removed and sectioned into ∼1-mm-thick slices. The slices were transferred to a 4°C Hanks' solution at pH 7.4. Superficial proximal convoluted tubules (S2 segments) were isolated by microdissection in cooled (4°C) Hanks' solution, then transferred to the stage of an inverted microscope, and cannulated using a series of concentric glass capillaries. The tubules were perfused with an ultrafiltrate-like solution containing (in mM) 125 NaCl, 22 NaHCO3, 1 CaCl2, 1.2 MgSO4, 2 glutamine, 2 lactic acid, 10.5 glucose, 5 KCl, and 1.2 phosphoric acid. The bath medium consisted of (in mM) 101 NaCl, 22 NaHCO3, 1 CaCl2, 1.2 MgSO4, 2 glutamine, 2 lactic acid, 10.5 glucose, 5 KCl, 1.2 phosphoric acid, and 32.5 HEPES as well as 5 g/dl albumin (12). The perfusate and bath solutions were bubbled with 95% O2-5% CO2, the pH was adjusted to 7.4, and the osmolalities to 300 mosmol/kgH2O in both solutions. Bath fluid was continuously changed at a rate of 0.5 ml/min to maintain the constancy of pH and bath osmolality. All tubules were perfused at 37°C in a 1.2-ml temperature-controlled bath. The first period began after an equilibration time of 30–60 min, and the perfusion fluid was collected following the method that has been previously described (11). Proximal tubules were perfused at either 5 or 20 nl/min, and the order of low or high flow was used randomly. The perfusion rate was calibrated and adjusted to either low (5 nl/min) or high (20 nl/min) before each experiment. Then, proximal tubules were perfused at either low (5 nl/min) or high (20 nl/min) perfusion rates and the tubular fluid was collected. Net volume absorption (JV; nl·min−1·mm−1) was measured as the difference between the perfusion (V0) and collection (VL) rates (nl/min) normalized per millimeter of tubule length (L). Extensively dialyzed [3H]methoxy-inulin was added to the perfusate at a concentration of 30 μCi/ml as a volume marker. For each experimental period, four timed collections of tubular fluid were made, 3H concentrations and total CO2 concentrations in the perfusate and collected sample fluid were measured, and the rate of fluid and HCO3− absorption was calculated by standard methods (47).
Losartan, PD123319, and bafilomycin were added to the luminal perfusate at concentrations of 10−5 M, 10−6 M, and 10−7 M, respectively (2, 12), and they were all purchased from Sigma (St. Louis, MO).
Real-time RT-PCR analysis of NHE mRNA expression.
The kidneys from AT1a knockout and WT mice were harvested, transversely sliced into four to five pieces, stored in RNAlater at 4°C for overnight, and then transferred to new tubes without reagent and stored at −80°C for later use. About 15 mg of whole kidney tissues were homogenized with a 20-gauge needle fitted to a syringe and lysed with RLT buffer (RNeasy kit, Qiagen, Hilden, Germany) with β-mercaptoethanol. Total RNA from tissues was extracted with the RNeasy kit (Qiagen) according to instructions. Residual genomic DNA was removed by DNase I digestion, using a DNA-free kit (Ambion, Austin, TX). cDNA synthesis from total RNA was carried out using high-capacity cDNA RT kits (Applied Biosystems, Foster City, CA), and mRNA expression was quantified by real-time RT-PCR using Power SYBR Green PCR Master Mix (Applied Biosystems, Foster City, CA).The final mRNA abundance of each gene was normalized to the abundance of an endogeneous gene, cyclophilin A, using the ΔΔCT method (2−ΔΔCT) (9). The primers for real-time PCR are the following: NHE3 (gene ID: XM_127434) forward primer 5′-GCTCCCCAAGTACGGACAATAT-3′ and reverse primer: 5′-ACAGCACTGACATTTTCCCTCAA-3′; and cyclophilin A (gene ID: NM_008907) forward primer 5′-TTGCAGACAAAGTTCCAAAGACA-3′ and reverse primer 5′-AAGTCACCACCCTGGCACAT-3′. Fold-change in gene expression was expressed compared with a calibrator, which is a mixed kidney sample from three male C57BL mice.
Western blot analysis of NHE3 protein level.
Kidney samples (100–500 mg) frozen in liquid nitrogen were homogenized and suspended in lysis buffer (in mM): 100 NaCl, 30 Tris base, and 20 MES as well as 1% Triton X-100 with protease inhibitor cocktail. Equal amounts of total protein (50 μg) were separated on 10% polyacrylamide gels using SDS-PAGE and immunoblotted with antibodies against NHE3 (3H3) (gift from Dr. Daniel Biemesderfer, Yale University). Subsequently, the membrane was probed with secondary antibodies, followed by incubation with ECL Western blot reagent. β-Actin was used as a loading control. Bands were quantified by densitometry, and transporter protein expression was normalized by β-actin level. All comparisons were made relative to control condition (13).
Sample measurement and analysis.
The rates of fluid (Jv) and HCO3− (JHCO3) absorption were calculated by measuring the concentrations of [3H]inulin and total CO2, as described previously (12). A calibrated collection pipette was used to obtain precise aliquots of initial perfusates and collection of samples to be analyzed for [3H]methoxy-inulin by liquid scintillation spectroscopy. The total CO2 concentration of both initial and collected fluids was measured by a nanoflow spectrometer (WPI). The rates of net fluid and HCO3− absorption were calculated as described previously (12) and expressed per millimeter tubular length.
JNa was calculated according to the rate of fluid absorption ([Na]*Jv), since the ratio of fluid and Na+ absorption is 1 in the proximal tubule (53). The JCl was calculated as JCl = JNa − JHCO3 (see justification in discussion). The cell volume is identified with epithelial volume, and is calculated as [π·(OD/2)2 − π·(ID/2)2 ], where ID is the inner tubular diameter, and OD is the outer tubule diameter. In this estimate, it is assumed that lateral intercellular space volume is a negligible fraction of epithelial volume. In this regard, Tisher and Kokko (44) determined that in rabbit proximal tubule, the spacing between membranes of opposing cells is ∼0.03 μm at baseline and grows or shrinks 10% with changes in transport. Thus, even with the pleated lateral membrane of proximal tubule, whose area is expanded 20-fold over a simple cylinder (55), interspace volume is estimated to be <5% of epithelial volume.
The total torque (bending moment) T on the microvilli due to fluid flow was calculated by the equation which we have published previously (10).
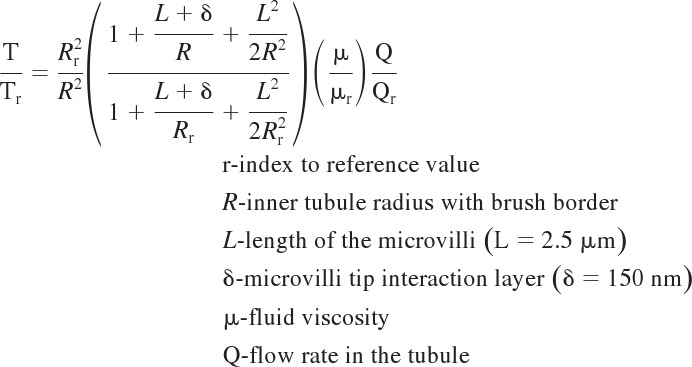 |
Applying this formula to the experiments under consideration, variations in microvillous length, L, of 50% or less should produce inaccuracies in the torque ratio of <10%. That height is not measured in these experiments and is assumed constant in the torque estimates.
Statistics.
Data are presented as means ± SE. Student's t-test was used to compare control and experimental groups. ANOVA was used for comparison of several experimental groups with a control group following by Dunnett's test. The difference between the mean values of an experimental group and a control group was considered significant if P < 0.05.
RESULTS
Effect of AT1 inhibitor on flow-activated proximal tubule transport.
To investigate the interplay of flow and ANG II receptor function, we examined the effect of the AT1 receptor blocker losartan on proximal tubule transport during low (5 nl/min) and high (20 nl/min) perfusion rates. Table 1 summarizes the tubule geometry from all groups of experiments, and Tables 2, 3, 4, and 5 summarize the changes in fluid and solute absorption produced by changes in perfusion rate. As shown in Tables 2 and 4, similar to our previous results, when the perfusion rate increased from 5 to 20 nl/min, the fluid (Jv) and HCO3− (JHCO3) absorption increased by 57 and 103%, respectively. The flow-induced change in JNa can be estimated from the change in Jv and the assumption of isotonic transport; the change in JCl can be estimated as the difference between JNa and JHCO3. With these assumptions, there was no significant difference in JCl between low and high flow: JCl was 63.69 ± 3.16 and 71.89 ± 6.8 pmol·min−1·mm−1 (P > 0.05), respectively, at low and high flow, indicating Cl− absorption is not impacted by axial flow (Table 5). Addition of the AT1 receptor blocker losartan (10−5 M) to the luminal perfusate reduced Jv by 30.6 and 31.3% and JHCO3 by 29.6 and 22.2%, respectively, at low and high flow compared with the control. Figure 1 shows that Jv (Fig. 1A), JNa (Fig. 1B), JHCO3 (Fig. 1C), and JCl (Fig. 1D) were reduced by losartan at both flows, confirming the role of ANG II and AT1 receptor function in the mouse proximal tubule. However, as shown in Tables 3 and 4, the fractional stimulation of JNa and JHCO3 by flow remained about the same as control.
Table 1.
Effects of angiotensin II inhibitors and bafilomycin on flow-induced changes in diameter and torque in proximal tubules of wild-type and AT1a knockout mouse kidney
| Group | N | Vo, nl/min | L, mm | Cell Volume, μm3 | ID, μm | OD, μm | T/Tr |
|---|---|---|---|---|---|---|---|
| Control | 12 | 4.8 ± 0.47 | 0.78 ± 0.01 | 936.75 ± 22.17 | 11.35 ± 0.56 | 36.35 ± 0.56 | 1.00 ± 0.09 |
| 16 | 20.4 ± 0.60 | 0.77 ± 0.01 | 1,084.83 ± 30.43** | 17.19 ± 0.43 | 40.94 ± 0.49 | 1.58 ± 0.06*** | |
| Losartan | 10 | 5.0 ± 0.38 | 0.82 ± 0.04 | 930.21 ± 61.66 NS | 12.25 ± 1.16 | 36.50 ± 1.26 | 1.00 ± 0.21 |
| 11 | 20.9 ± 0.64 | 0.85 ± 0.03 | 942.48 ± 46.39 ns† | 16.48 ± 0.37 | 38.30 ± 0.80 | 1.74 ± 0.09***NS | |
| AT1a KO | 7 | 5.2 ± 0.72 | 0.88 ± 0.05 | 1,206.15 ± 60.81††† | 14.11 ± 0.81 | 41.61 ± 1.12 | 1.00 ± 0.19 |
| 7 | 20.5 ± 1.43 | 0.88 ± 0.05 | 1,283.99 ± 105.41 nsNS | 19.29 ± 0.46 | 44.64 ± 1.58 | 1.82 ± 0.17**NS | |
| PD123319 | 6 | 4.9 ± 0.25 | 0.75 ± 0.04 | 1,014.47 ± 32.72 NS | 12.08 ± 0.42 | 37.92 ± 0.42 | 1.00 ± 0.15 |
| 12 | 20.3 ± 0.50 | 0.78 ± 0.03 | 965.39 ± 45.91 ns† | 15.50 ± 0.31 | 38.75 ± 0.78 | 1.88 ± 0.10***† | |
| AT1a KO+PD123319 | 5 | 5.3 ± 0.28 | 1.07 ± 0.07 | 962.11 ± 19.63 NS | 12.00 ± 0.50 | 37.00 ± 0.50 | 1.00 ± 0.10 |
| 14 | 21.3 ± 0.73 | 1.05 ± 0.03 | 891.99 ± 12.64*††† | 18.39 ± 0.40 | 38.39 ± 0.40 | 1.46 ± 0.07**NS | |
| AT1a KO+Bafilomycin | 5 | 4.9 ± 0.74 | 1.08 ± 0.04 | 891.43 ± 25.30 NS | 12.50 ± 1.19 | 36.00 ± 0.47 | 1.00 ± 0.14 |
| 8 | 22.9 ± 2.51 | 1.08 ± 0.03 | 913.03 ± 17.80 ns††† | 19.06 ± 0.57 | 39.06 ± 0.57 | 1.64 ± 0.13**NS |
Values are means ± SE; N, no. of perfused tubules; KO, knockout; Vo, initial perfusion rate; L, tubular length; cell volume, the formula is π*(OD/2)2*1-π*(ID/2)2*1, where 1 indicates the length or height is 1 μm; ID, inner tubular diameter; OD, outer tubule diameter; T, total torque; Tr, torque measured at the perfusion rate of 5 nl/min; ns, no significant difference from low flow in the same group; NS, no significant difference compared with control group at a similar flow. Losartan (10−5 M), AT2 inhibitor, PD123319 (10−6 M), and bafilomycin (10−7 M) were added to the luminal perfusates, respectively. Significant difference from low flow in the same group (*P < 0.05, **P < 0.01, ***P < 0.001). Significant difference compared with control group at a similar flow (†P < 0.05; ††P < 0.01; †††P < 0.001).
Table 2.
Flow-induced changes in fluid absorption in proximal tubules under control and different experimental conditions
| 5 nl/min |
20 nl/min |
|||||
|---|---|---|---|---|---|---|
| Group | N | JVa, nl•min−1•mm−1 | N | JVb, nl•min−1•mm−1 | ΔJV, JVb − JVa | ΔJV/JVa*100 |
| Control | 12 | 0.85 ± 0.03 | 16 | 1.34 ± 0.03*** | 0.49 ± 0.04 | 57.22 ± 3.84 |
| Losartan | 10 | 0.59 ± 0.03††† | 11 | 0.92 ± 0.03***††† | 0.33 ± 0.04 †† | 56.93 ± 4.51 NS |
| AT1a KO | 7 | 0.50 ± 0.06††† | 7 | 0.63 ± 0.09 ns††† | 0.13 ± 0.11††† | 26.72 ± 18.51† |
| PD123319 | 6 | 1.01 ± 0.08† | 12 | 1.60 ± 0.09***†† | 0.58 ± 0.12 NS | 57.72 ± 9.04 NS |
| AT1a KO+PD123319 | 5 | 0.63 ± 0.02††† | 14 | 0.75 ± 0.08 ns††† | 0.12 ± 0.10††† | 19.14 ± 11.86††† |
| AT1a KO+bafilomycin | 5 | 0.60 ± 0.05††† | 8 | 0.64 ± 0.07 ns††† | 0.04 ± 0.09††† | 6.96 ± 12.04††† |
Values are means ± SE; N, no. of perfused tubules; Jv, rate of fluid reabsorption; ΔJv, differences in Jv between low and high perfusion rate (5 and 20 nl/min); ΔJv/Jva*100, percent changes in fluid reabsorption from control; ns, no significant difference from low flow in the same group; significant difference from low flow in the same group (*P < 0.05, **P < 0.01, ***P < 0.001); NS, no significant difference compared with control group at a similar flow; significant difference compared with control group at a similar flow (†P < 0.05, ††P < 0.01, †††P < 0.001).
Table 3.
Flow-induced changes in sodium absorption in proximal tubules under control and different experimental conditions
| 5 nl/min |
20 nl/min |
|||||
|---|---|---|---|---|---|---|
| Group | N | JNaa, pmol•min−1•mm−1 | N | JNab, pmol•min−1•mm−1 | ΔJNa, JNab − JNaa | ΔJNa/JNaa *100 |
| Control | 12 | 125.16 ± 3.85 | 16 | 196.79 ± 4.81*** | 71.62 ± 6.23 | 57.22 ± 3.84 |
| Losartan | 10 | 85.96 ± 4.94††† | 11 | 134.89 ± 3.87***††† | 48.94 ± 6.24 † | 56.93 ± 4.51 NS |
| AT1a KO | 7 | 72.85 ± 9.34††† | 7 | 92.31 ± 13.49 ns††† | 19.46 ± 16.38††† | 26.72 ± 18.51† |
| PD123319 | 6 | 148.52 ± 11.09† | 12 | 234.25 ± 13.42***†† | 85.73 ± 17.95 NS | 57.72 ± 9.04 NS |
| AT1a KO+PD123319 | 5 | 92.89 ± 3.23††† | 14 | 110.67 ± 11.02 ns††† | 17.78 ± 13.58††† | 19.14 ± 11.86††† |
| AT1a KO+bafilomycin | 5 | 87.95 ± 8.04††† | 8 | 94.06 ± 10.59 ns††† | 6.12 ± 13.70††† | 6.96 ± 12.04††† |
Values are means ± SE; N, no. of perfused tubules; JNa, rate of sodium reabsorption; ΔJNa, differences in JNa between low and high perfusion rate (5 and 20 nl/min); ΔJNa/JNaa*100, percent changes in sodium reabsorption from control; ns, no significant difference from low flow in the same group; significant difference from low flow in the same group (*P < 0.05, **P < 0.01, ***P < 0.001); NS, no significant difference compared with control group at a similar flow; significant difference compared with control group at a similar flow (†P < 0.05, ††P < 0.01, †††P < 0.001).
Table 4.
Flow-induced changes on bicarbonate absorption in proximal tubules under control and different experimental conditions
| 5 nl/min |
20 nl/min |
|||||
|---|---|---|---|---|---|---|
| Group | N | JHCO3a, pmol•min−1•mm−1 | N | JHCO3b, pmol•min−1•mm−1 | ΔJHCO3,JHCO3b − JHCO3a | ΔJHCO3/JHCO3a *100 |
| Control | 12 | 61.48 ± 2.81 | 16 | 124.90 ± 4.14*** | 63.42 ± 5.13 | 103.16 ± 6.74 |
| Losartan | 10 | 43.30 ± 3.39††† | 11 | 97.09 ± 3.10***††† | 53.79 ± 4.58 NS | 124.23 ± 7.16 † |
| AT1a KO | 7 | 42.46 ± 2.17††† | 7 | 85.15 ± 6.05***††† | 42.69 ± 6.43† | 100.53 ± 14.24 NS |
| PD123319 | 6 | 73.92 ± 6.86 NS | 12 | 157.95 ± 8.04***††† | 84.04 ± 10.84 NS | 113.70 ± 10.87 NS |
| AT1a KO+PD123319 | 5 | 45.70 ± 4.34†† | 14 | 79.82 ± 6.49*††† | 34.12 ± 8.48†† | 74.65 ± 14.21 NS |
| AT1a KO+bafilomycin | 5 | 31.07 ± 4.55††† | 8 | 40.49 ± 7.41 ns††† | 9.41 ± 9.14††† | 30.29 ± 23.84††† |
Values are means ± SE; N, no. of perfused tubules; JHCO3, rate of bicarbonate reabsorption; ΔJHCO3, differences in JHCO3 between low and high perfusion rate (5 and 20 nl/min); ΔJHCO3/JHCO3a*100, percent changes in bicarbonate reabsorption between high and low flow; ns, no significant difference from low flow in the same group; significant difference from low flow in the same group (*P < 0.05, **P < 0.01, ***P < 0.001); NS, no significant difference compared with control group at a similar rate; significant difference compared with control group at a similar rate (†P < 0.05, ††P < 0.01, †††P < 0.001).
Table 5.
Flow-induced changes in chloride absorption in proximal tubules under control and different experimental conditions
| 5 nl/min |
20 nl/min |
|||||
|---|---|---|---|---|---|---|
| Group | N | JCla, pmol•min−1•mm−1 | N | JClb, pmol•min−1•mm−1 | ΔJCl, JClb−JCla | ΔJCl/JCla*100 |
| Control | 12 | 63.69 ± 3.16 | 16 | 71.89 ± 6.79 ns | 8.20 ± 7.83 | 12.88 ± 10.66 |
| Losartan | 10 | 42.66 ± 5.25†† | 11 | 37.81 ± 6.09 ns†† | −4.85 ± 8.07 NS | −11.37 ± 14.28 NS |
| AT1a KO | 7 | 30.39 ± 9.21††† | 7 | 7.16 ± 15.44 ns††† | −23.22 ± 17.98 NS | −76.43 ± 50.82† |
| PD123319 | 6 | 74.61 ± 10.20 NS | 12 | 76.30 ± 10.07 nsNS | 1.69 ± 14.30 NS | 2.26 ± 13.50 NS |
| AT1a KO+PD123319 | 5 | 47.19 ± 5.57† | 14 | 30.85 ± 9.02 ns††† | −16.34 ± 11.67 NS | −34.63 ± 19.11† |
| AT1a KO+bafilomycin | 5 | 56.87 ± 7.44 NS | 8 | 53.58 ± 13.41 nsNS | −3.30 ± 16.25 NS | −5.79 ± 23.57 NS |
Values are means ± SE; N, no. of perfused tubules; JCl, rate of sodium reabsorption; ΔJCl, differences in JCl between low and high perfusion rate (5 and 20 nl/min); ΔJCl/JCla*100, percent changes in chloride reabsorption from control; ns, no significant difference from low flow in the same group; significant difference from low flow in the same group (*P < 0.05, **P < 0.01, ***P < 0.001); NS, no significant difference compared with control group at a similar flow; significant difference compared with control group at a similar flow (†P < 0.05, ††P < 0.01, †††P < 0.001).
Fig. 1.
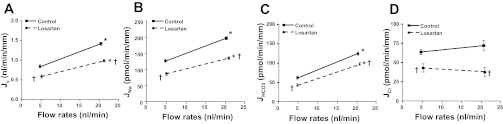
Effects of ANG II on flow-induced changes in fluid (A), sodium (B), bicarbonate (C), and chloride (D) absorption (Jv, JNa, JHCO3, and JCl) in mouse proximal tubules. Jv, JNa, JHCO3, and JCl were measured at low and high perfusion rates in the absence and presence of 10−5 M losartan (AT1 inhibitor). *P < 0.05, compared with low flow in the same group. †P < 0.05, compared with the control at a similar flow.
Flow-dependent proximal tubule transport in AT1a KO mice.
We have examined Na+ and HCO3− absorption in proximal tubules by in vitro microperfusion under conditions of low and high flow in WT and AT1a KO mice. Jv and JHCO3 were significantly reduced by 41 and 31% at low and by 53 and 32% at high flow compared with WT control. The estimated JCl was also reduced significantly at both flows (52 and 89%). Compared with percent changes in NaCl and HCO3− absorption between low and high flow, we note that the reduction of JNa and JCl is larger at high flow than at low flow, but the reduction of JHCO3 is the same, 31 vs. 32%, at both flows. Figure 2 shows no significant difference in Jv between low and high flow in AT1a KO mice; i.e., the KO mice have lost flow-dependent Na+ reabsorption. However, between KO and WT mice, there is no difference in flow stimulation of HCO3− absorption (see Fig. 5B). Since at least two major mechanisms of HCO3− absorption in the apical membrane are involved (NHE and H-ATPase), we examined the effect of the H-ATPase inhibitor bafilomycin. As shown in Fig. 2C, bafilomycin completely abolished the remaining flow stimulation of JHCO3 in AT1a KO mice, indicating ANG II did not alter flow-regulated H-ATPase activity.
Fig. 2.
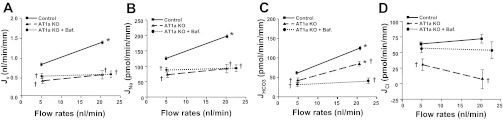
Effects of ANG II on flow-induced changes in fluid (A), sodium (B), bicarbonate (C), and chloride (D) absorption (Jv, JNa, JHCO3, and JCl) in proximal tubules in wild-type and AT1a knockout (KO) mice. Jv, JNa, JHCO3, and JCl absorption were measured at low and high perfusion rates in the absence and presence of 10−7 M bafilomycin (H-ATPase inhibitor). *P < 0.05, compared with low flow in the same group. †P < 0.05, compared with the control at a similar flow.
Fig. 5.
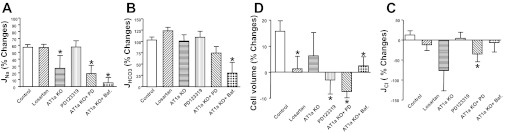
Flow-induced changes in sodium (A), bicarbonate (B), and chloride (C) reabsorption (JNa, JHCO3, JCl) and cell volume (D) under low and high perfusion rates in proximal tubules of WT and AT1a KO mice. % Change is the percent difference from low flow of Na+, HCO3−, and Cl− absorption shown in Tables 2 (JNa), 3 (JHCO3) and 4 (JCl). *P < 0.05, compared with the change in control group.
NHE3 expression in AT1a KO mice.
Our data show that Na+ absorption was reduced by 30.6 and 31.2% at low and high flow by losartan, but was reduced by 41 and 53% in AT1a KO mice compared with WT control. Substantially greater reduction of Na+ absorption in proximal tubules from AT1a KO mice suggests additional mechanisms contributed to lowering Na+ absorption in the proximal tubules of AT1a KO mice. Since NHE3 is the major transporter responsible for proximal Na+ and HCO3− absorption, we examined NHE3 expression in AT1a KO mouse kidneys to investigate whether its level was altered in these mice. We examined NHE3 expression at the mRNA level by Q-PCR and at the protein level by Western blotting. As shown in Fig. 3A, mRNA expression was 16% lower in AT1a KO mouse kidneys compared with WT control (0.74 ± 0.07 vs. 0.86 ± 0.06, n = 3, P > 0.05), but such reduction was not statistically significant. Consistent with the trend of change at the mRNA level, the Western blotting results (Fig. 3, B and C) shows a 25% lower NHE3 abundance in AT1a KO mouse kidneys than in WT control. The NHE3/β-actin ratio was 1.04 ± 0.06 in WT and 0.77 ± 0.03 in AT1a KO mouse kidneys (n = 3, P = 0.014).
Fig. 3.
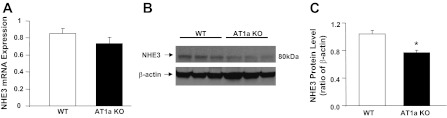
Na/H exchanger 3 (NHE3) mRNA and protein levels in kidneys of AT1a wild-type (WT) and KO mice examined by Q-PCR and Western blotting. A: NHE3 mRNA levels in WT and AT1a KO mouse kidney. NHE3 expression tended to decrease in AT1a KO mice, but the difference was not significant. B: NHE3 protein abundance in WT and AT1a KO mice. C: NHE3 protein expression levels normalized to β-actin. Values are means ± SE from 3 KO and 3 WT mice kidneys.
Role of AT2 receptor in regulation of Na+ and HCO3− transport.
We have examined the effect of the AT2 receptor blocker PD123319 on Na+ and HCO3− absorption in the proximal tubule at both low and high flows. The effect of PD123319 in AT1a KO mice was also examined to investigate whether AT2 receptor function is altered when AT1a is knocked out. As shown in Fig. 4 and Tables 3 and 4, PD123319 significantly increased both JNa and JHCO3. JNa increased by 18.7 and 19.0%, and JHCO3 increased by 20.2 and 26.5% at low and high flow, respectively, compared with the control. Activation of the AT1 receptor stimulates, but the AT2 receptor inhibits, Na+ and HCO3− absorption in the proximal tubule, indicating that AT2 receptor function is opposite that of the AT1 receptor. We observed that blocking the AT2 receptor did not affect flow-stimulated Na+ and HCO3− absorption. As shown in Tables 3 and 4, the percent increment of JNa was 57% and that of JHCO3 was 114%; the increase by PD123319 is similar to that in the control (57 and 103%, respectively). We have also examined the effect of PD123319 in AT1a KO proximal tubules. As shown in Tables 3 and 4, PD123319 produced similar increments in JNa and JHCO3 in AT1a KO mice, and PD123319 did not influence flow-stimulated proximal tubule transport (Fig. 5).
Fig. 4.
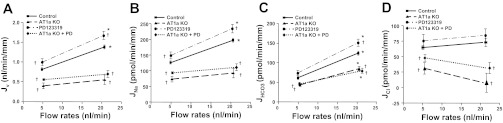
Effects of ANG II on flow-induced changes in fluid (A), sodium (B), bicarbonate (C), and chloride (D) absorption (Jv, JNa, JHCO3, and JCl) in proximal tubules in WT and AT1a KO mice. Jv, JNa, JHCO3, and JCl were measured at low and high perfusion rates in the absence and presence of 10−6 M PD123319 (AT2 receptor inhibitor). *P < 0.05, compared with low flow in the same group. †P < 0.05, compared with the control at a similar flow.
Regulation of cell volume.
Cell volume per micrometer tubule length was calculated in all experimental groups at low and high flows according to the area of the annulus between the inner and outer diameter. As shown in Table 1, the inner diameter increased by 51% at high flow similar to our previous reports (10), but cell volume was increased only by 16% in the control group at high flow compared with low flow (Fig. 5D). Cell volumes either had no significant or slight changes (either increased or reduced) in other experimental groups (Fig. 5D), and such changes were much less significant than the changes in proximal tubule transport. Compared with the flow-mediated changes in transport activity, the smaller changes in cell volume suggest concomitant stimulation of luminal and basolateral transporters by axial flow.
Flow-induced changes in ion transport and torque.
In the present work, we have compared the flow-induced changes in torque and in ion transport activity in all experimental groups. As shown in Table 1, increased flow from 5 to 20 nl/min enhanced torque in control and all other experiment groups, and the increments of torque by flow were not reduced by ANG II inhibitor or AT1a KO. We next examined the ratio of flow-induced torque and Na+, HCO3− and Cl− absorption as shown in Fig. 6. In the control group, the ratio of flow-induced change in Na+ transport to torque is close to 1 [(ΔJNa/JNar)/(ΔT/Tr), Fig. 5A]. It is important to acknowledge the difference between Figs. 5 and 6, namely, the fractional change in Na+ reabsorption, compared with this transport change relative to the change in estimated microvillous torque (i.e., torque sensitivity of transport). For example, with administration of losartan or the AT2 receptor inhibitor, fractional Na+ reabsorption and its torque sensitivity were little changed by the increase in volume flow; in AT1a KO mice, there was a demonstrable reduction in torque sensitivity (Fig. 6) that did not achieve statistical significance in Fig. 5. In short, although flow-dependent transport variation is still observed with AT1, or with AT2 inhibition, the data suggest a decrease in the sensitivity of NHE3 response to changes in microvillous torque with AT1a KO.
Fig. 6.
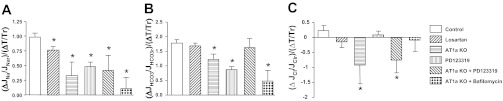
Flow-induced changes in torque and sodium (A), bicarbonate (B), and chloride (C) reabsorption in proximal tubules of WT and AT1a KO mice in the absence or presence of different inhibitors. Data are represented as the ratio of changes (Δ) in ion absorption and changes in torque (T) by flow. r, Reference volume obtained from low flow. *P < 0.05, compared with the change in control group.
DISCUSSION
GTB was recognized in the first micropuncture of the mammalian kidney (46) and was examined in detail by Schnermann et al. (38), who found (over a 4-fold variation in GFR) that the accessible proximal tubule reabsorbed 60% of the filtered fluid. The mechanisms underlying balanced tubular reabsorption include peritubular capillary oncotic force and luminal flow (14). The impact of luminal flow on tubular reabsorption has been termed “perfusion-absorption balance” (56), and in the rat, this effect has been found to influence the transport of bicarbonate (1, 8, 16, 32, 57). Guo et al. (18) proposed that the brush border microvilli serve as the sensor for axial flow along the proximal tubule. In that hypothesis, the drag force on each microvillus produced torque on an actin filament core, and this force was transmitted to the underlying actin cytoskeleton. In a subsequent analysis, a simplified equation for microvillous torque was derived (see equation in methods), which has been useful for assessment of experimental data (10). Du et al. (10) applied that equation to analyze the first experimental study of flow-dependent volume reabsorption, Jv, in isolated, perfused mouse proximal tubules. The key finding of that work was that fractional changes in microvillous torque and Jv were identical. Disruption of the cytoskeleton with cytochalasin D eliminated the perfusion-dependent increase in Jv. Subsequently, Du et al. (12) reexamined flow-dependent transport in mouse proximal tubules with the measurement of HCO3− reabsorption, JHCO3. In that work, JHCO3 scaled with microvillous torque, and inhibitor experiments suggested that both NHE3 and luminal membrane H+-ATPase were modulated by axial flow. When Weinstein et al. (54) incorporated flow-dependent transport into a mathematical model of the proximal tubule, it was found that both luminal and peritubular membrane transporter densities needed to scale with flow. These studies are summarized elsewhere (49).
In the current work, the first observation is that in control tubules flow-dependent reabsorption of fluid and HCO3− is reproduced. With the use of these data, the analysis has been extended, with the explicit recognition that volume reabsorption should provide an estimate of Na+ reabsorption, and the difference between Na+ and HCO3− reabsorption should provide an estimate of Cl− reabsorption. Based on these estimates, the data suggest that changes in luminal flow have no primary impact on Cl− transport. In particular, there is no evidence for a transcellular effect (e.g., on Cl−/formate exchange), nor for a paracellular effect (e.g., electrogenic Cl− flux in parallel with flow-dependent Na+-glucose cotransport, or convective NaCl reabsorption). With respect to overall proximal tubule function over its full length, more vigorous HCO3− reabsorption in S1 and early S2 would be expected to generate more favorable conditions for Cl− reabsorption in late S2 and S3. Thus, in the full tubule, enhanced NaCl reabsorption could still be driven by a flow-effect on NHE3 alone (50).
The accuracy of the assumption that Cl− flux can be estimated as the difference between Na+ and HCO3− fluxes can be examined in a proximal tubule model. In Table 6, the published model of rat proximal tubule (54) is used to simulate entering flows of 0.5 and 1.5 nl/s and to examine model performance under the three conditions of no torque dependence of transport, full torque scaling of all luminal and peritubular transporters (as was done in Ref. 54), and selective torque scaling of luminal NHE3 and H+-ATPase, in parallel with uniform peritubular scaling. What is shown in the first two sets of columns of Table 6 are reabsorptive fluxes at 1-mm and 1-cm tubule length. The first observation is that the estimated Cl− fluxes are within 2% of the actual flux at low flow and within 8% at high flow. The second observation is that at the lower flow, there is no appreciable difference between selective luminal scaling of NHE3 and H+-ATPase and uniform luminal scaling; at the higher flows, there is a third less Cl− reabsorption at 1 mm, but this difference becomes unimportant by 1 cm. In short, Na+ and HCO3− reabsorption drive Cl− reabsorption, once the luminal concentration profiles are developed. Indeed, with no torque-dependent transport, there is a decrease in JCl from low to high flow, due to the disappearance of passive forces for Cl− reabsorption, with higher flow. Finally, the third set of columns display the ratio of solute reabsorption rates at the two perfusion rates; perfect GTB would be a ratio of 3.0. By virtue of the choice of scaling coefficient (54), there is near perfect GTB for Na+, with lesser and greater values for Cl− and HCO3−. With selective scaling of luminal transporters, GTB for Cl− flux is diminished, but it is not 1.0, as found in the current experiments. This may derive in part from the fact that this is a rat tubule model, with convective paracellular Cl− flux, so that Na+ reabsorption can drive a component of Cl− transport. Furthermore, in this simulation there is scaling of peritubular Cl− transporters (e.g., K+-Cl− and Na+-2HCO3−/Cl−), which impact transcellular Cl− flux.
Table 6.
Na, CI, and HCO3− reabsorption at normal and high inlet flows, measured at 1 mm and 1 cm
| Fv0 = 0.5 nl/s |
Fv0 = 1.5 nl/s |
|||||||||||||||||||
|---|---|---|---|---|---|---|---|---|---|---|---|---|---|---|---|---|---|---|---|---|
| Entering | FK(Na) 70.00 | FK(Cl) 56.61 | FK(HCO3) 12.00 | FK(Cl) 56.61 | FK(Na) 210.00 | FK(Cl) 169.84 | FK(HCO3) 36.00 | FK(Cl) 169.84 | GTB: JK(1.5)/JK(0.5) |
|||||||||||
| JK(Na) | JK(CI) | JK(HCO3) | EstJK(CI) | JK(Na) | JK(CI) | JK(HCO3) | EstJK(CI) | Na | CI | HCO3 | Est. CI | |||||||||
| No torque dependence of transporters | ||||||||||||||||||||
| x = 1 mm | 5.09 | 2.87 | 1.99 | 3.10 | 5.00 | 2.65 | 2.08 | 2.92 | 0.98 | 0.92 | 1.05 | 0.94 | ||||||||
| JK/FK | 7.3% | 5.1% | 16.5% | 5.5% | 2.4% | 1.6% | 5.8% | 1.7% | ||||||||||||
| x = 1 cm | 56.00 | 43.79 | 11.09 | 44.91 | 53.13 | 34.06 | 17.56 | 35.58 | 0.95 | 0.78 | 1.58 | 0.79 | ||||||||
| JK/FK | 80.0% | 77.3% | 92.4% | 79.3% | 25.3% | 20.1% | 48.8% | 20.9% | ||||||||||||
| Torque scaling (1.6) for peritubular transporters and luminal NHE and H-ATPase | ||||||||||||||||||||
| x = 1 mm | 5.07 | 2.87 | 1.97 | 3.10 | 11.23 | 4.36 | 6.42 | 4.81 | 2.22 | 1.52 | 3.27 | 1.55 | ||||||||
| JK/FK | 7.2% | 5.1% | 16.4% | 5.5% | 5.3% | 2.6% | 17.8% | 2.8% | ||||||||||||
| x = 1 cm | 40.95 | 32.32 | 7.88 | 33.07 | 108.99 | 69.27 | 34.66 | 74.33 | 2.66 | 2.14 | 4.40 | 2.25 | ||||||||
| JK/FK | 58.5% | 57.1% | 65.7% | 58.4% | 51.9% | 40.8% | 96.3% | 43.8% | ||||||||||||
| Torque scaling (1.6) for all luminal and peritubular transporters | ||||||||||||||||||||
| x = 1 mm | 5.09 | 2.88 | 1.98 | 3.11 | 12.07 | 6.00 | 5.18 | 6.90 | 2.37 | 2.09 | 2.61 | 2.22 | ||||||||
| JK/FK | 7.3% | 5.1% | 16.5% | 5.5% | 5.7% | 3.5% | 14.4% | 4.1% | ||||||||||||
| x = 1 cm | 43.03 | 33.56 | 8.92 | 34.11 | 111.11 | 73.93 | 31.32 | 79.79 | 2.58 | 2.20 | 3.51 | 2.34 | ||||||||
| JK/FK | 61.5% | 59.3% | 74.3% | 60.2% | 52.9% | 43.5% | 87.0% | 47.0% | ||||||||||||
Fv, entering volume flow (nl/s); FK, entering solute flow (pmol/s); JK, reabsorptive solute flux (pmol/s) at 1 mm and 1 cm; Est JK(CI) = JK(Na) − JK(HCO3); JK/FK, fractional reabsorption; GTB, glomerulotubular balance.
In the intact animal, selective blockade of angiotensin II is diuretic, so that under normal conditions it appears that there is tonic stimulation by angiotensin (59). In intact rat tubules, the most prominent effect of angiotensin, in picomolar concentrations, is the stimulation of NaHCO3 reabsorption via Na+/H+ exchange (31), and this is mediated by binding to AT1 receptors (58). The increase in tubular reabsorption due to angiotensin is correlated with the inhibition of cAMP generation (30), and these findings are reproducible in cultured proximal tubule cells transfected with the AT1 receptor (43). While systemic angiotensin concentrations may be in the 0.01–0.1 nM range, luminal concentrations are 100-fold higher (41) due to tubular synthesis and secretion of angiotensin (5). Microperfusion studies, combining luminal perfusion of angiotensin with simultaneous inhibition of local synthesis, confirmed the stimulation of transport starting in the picomolar range (37). However, over a broad range of luminal concentrations (0.01–10.0 nM) these workers found the stimulatory effect of luminal angiotensin to be relatively flat. Inhibition may dominate at concentrations >100 nM (22) and may involve binding to an AT2 receptor (20). A notable aspect of luminal angiotensin signaling is that luminal angiotensin concentration is maintained well above that needed for maximal stimulation. (A corollary of this observation is that flow-dependent changes in local angiotensin concentration would not be expected to modulate changes in transport.) An explanation that has been advanced is that regulation of transport might then be determined by AT1 receptor density (25). In vivo, Quan and Baum (36) have demonstrated that the luminal angiotensin signal varies with systemic volume status. In micropuncture of volume-contracted animals, luminal angiotensin adds little, and luminal AT1 antagonism has a dramatic inhibitory effect on reabsorption; in volume-expanded animals, there is only a small impact of luminal AT1 inhibition, while luminal angiotensin sharply increases volume reabsorption.
In the current work, the impact of angiotensin on proximal tubule transport has been assessed via the impact of receptor blockade or in an AT1a receptor KO mouse. With respect to HCO3−, AT1 blockade (or in the receptor knockout), baseline reabsorption falls by about one-third. An increase in luminal flow, which doubles the calculated microvillous torque under each condition, also doubles HCO3− reabsorption under each condition. AT2 blockade increases HCO3− reabsorption by 20%, but the increase in flow again doubles this flux. With respect to Na+ transport, the fractional increase with increased axial flow is ∼57%, regardless of blockade of either ANG II receptor. However, in proximal tubules of AT1a KO mice the fractional increase with increased axial flow is only 26%. We have examined NHE3 expressions at both mRNA and protein levels and found that NHE3 expression was unchanged at the mRNA level, but was significantly reduced at the protein level. The reduction of Na+ absorption in AT1a KO mice may be due to the combined effect of reduced NHE3 activity and ANG II receptor function. The impact of flow on estimated Cl− reabsorption is negligible in control, or with any manipulation of angiotensin. These findings demonstrate the effect of ANG II on proximal tubules is to set baseline fluxes, but with no discernible modulation of the mechanism by which axial flow alters the important transporters. Specifically, in view of these data, it is difficult to imagine a process in which axial flow modulates either angiotensin secretion or luminal membrane angiotensin receptors as a mechanism underlying perfusion-absorption balance.
The mechanisms responsible for the different findings, from acute inhibition of the AT1a receptor and AT1a KO mice can only be speculated. One possibility is a structural role for the receptor in the cellular machinery underlying flow-dependent transport. For example, there is negative reciprocity between DA-1 and AT1 surface expression, and a physical interaction between these two receptors has been documented (23). Alternatively, it is recognized that ANG II can be internalized by proximal tubule cells via an AT1a receptor-mediated mechanism, and it has been shown that intracellular ANG II levels were 65% lower in the AT1a KO kidney (29). If there is any flow-stimulated ANG II release from the cell, such an effect would be reduced or absent in the AT1a KO mouse. ANG II not only regulates ion transport activity but also modulates transporter expression, and our finding of reduced NHE3 in the AT1a KO mouse is similar to the report that knocking down the AT1a receptor by small interfering RNA in proximal tubule cells reduced NHE3 expression (28). The altered physiology underlying this reduced NHE3 expression may also lead to a reduction in flow-increased Na+ and HCO3− absorption in proximal tubules of AT1a KO mice. In short, while experiments in the wild-type mouse indicate that an ANG II signal is not necessary for flow-dependent transport, experiments in the knockout imply that presence of the AT1a receptor is required for full torque sensitivity.
The attention given to cell volume in these experiments relates to concerns articulated by Schultz and coworkers (39, 40), who studied gastrointestinal epithelia, and who have emphasized the need for basolateral exit pathways to keep pace with luminal entry to preserve the integrity of cell composition and volume (39, 40). The critical experimental observations were made in the small intestine (15, 17), where it was found that with the addition of alanine to the luminal solution there was a prompt depolarization of the cell interior in association with a doubling of sodium reabsorption. Over a period of minutes, basolateral K+ conductance increased, repolarized the cell, and further enhanced sodium transport. This parallel response of basolateral K+ conductance with reabsorptive Na+ flux was subsequently documented in frog proximal tubule, following luminal phenylalanine (34, 35), and in the mammalian proximal tubule with luminal application of glucose and alanine (4, 26, 27). Patch clamp of the peritubular K+ channel has shown that the increase in K+ conductance with luminal application of organics is the result of an increase in open probability (3). The two principal candidates for the modulators of peritubular exit have been cell volume or coupling of Na-K-ATPase activity with K+ channel open probability (pump-leak parallelism) via cytosolic ATP concentration (45). In this work, cell volume has been estimated as the area per micrometer tubule length of the annulus between the lumen and outer tubule boundary. The results depicted in Fig. 5D indicate that wild-type tubules (under control conditions, or with angiotensin receptor blockade) show small changes in cell volume with increased luminal flow, despite increases in reabsorptive Na+ flux of 57% or HCO3− flux of 100%. These are the first observations of cell volume homeostasis during flow-dependent transport. It should be noted that the present studies are steady-state observations, made ∼30 min after the perfusion rate has been changed. We do not have information about the transient response of kidney tubule cell volume following the change in flow. In all of the steady-state models of the proximal tubule, achieving volume homeostasis in response to increased luminal entry has required activation of peritubular K+-Cl− and/or Na+-3HCO3− cotransporters, either by volume (51) or by other signals (54); increasing peritubular K+ conductance alone was not sufficient. To maintain cell volume homeostasis throughout transient changes in luminal flow, Weinstein and Sontag (52) suggested that a feed-forward signal from the luminal to the peritubular membrane would be required. It was envisioned that this signal would be transmitted by the actin cytoskeleton.
In summary, this work contributes to the overall picture of the impact of ANG II on proximal nephron function. During periods of volume depletion, the vascular action of angiotensin preserves glomerular filtration, albeit at a lower rate and with a higher filtration fraction. Both the increase in filtration fraction and the direct cellular action of angiotensin via its AT1 receptor tend to increase fractional Na+ reabsorption by the proximal tubule. The decrease in luminal flow, by virtue of perfusion-absorption balance, will tend to counteract the peritubular and tubular effects of angiotensin and decrease proximal Na+ reabsorption. Our data indicate that angiotensin does not modulate this flow-dependent decrease in proximal reabsorption. Of note, we have only been able to discern a flow-dependent impact on NaHCO3 reabsorption; an impact on NaCl reabsorption appears to depend on changes in luminal HCO3− depletion, and thus changes in the passive forces for Cl− transport. During periods of volume expansion, in which angiotensin is suppressed, the peritubular and cellular effects, which depress Na+ transport, will be blunted by flow-dependent increases in proximal reabsorption. Our data indicate that even in the absence of angiotensin, flow-dependent transport will be preserved, and thus will continue to protect against proximal solute wasting. Under pathological conditions, in which there is volume expansion coexistent with high angiotensin, the increase in luminal flow and the cellular action of angiotensin will be coherent, and act to increase Na+ reabsorption by the proximal tubule.
GRANTS
This investigation was supported by Public Health Service Grants RO1-DK62289 (T. Wang) and RO1-DK-29857 (A. M. Weinstein) from the National Institute of Diabetes and Digestive and Kidney Diseases.
DISCLOSURES
No conflicts of interest, financial or otherwise, are declared by the authors.
AUTHOR CONTRIBUTIONS
Author contributions: Z.D., L.W., and Q.Y. performed experiments; Z.D., L.W., Q.Y., A.M.W., and T.W. analyzed data; Z.D., A.M.W., and T.W. interpreted results of experiments; Z.D., L.W., Q.Y., and T.W. prepared figures; Z.D., L.W., S.W., A.M.W., and T.W. edited and revised manuscript; Z.D., L.W., S.W., A.M.W., and T.W. approved final version of manuscript; S.W., A.M.W., and T.W. provided conception and design of research; A.M.W. and T.W. drafted manuscript.
REFERENCES
- 1. Alpern RJ, Cogan MG, Rector FC., Jr Flow dependence of proximal tubular bicarbonate absorption. Am J Physiol Renal Fluid Electrolyte Physiol 245: F478–F484, 1983 [DOI] [PubMed] [Google Scholar]
- 2. Baum M, Quigley R, Quan A. Effect of luminal angiotensin II on rabbit proximal convoluted tubule bicarbonate absorption. Am J Physiol Renal Physiol 273: F595–F600, 1997 [DOI] [PubMed] [Google Scholar]
- 3. Beck JS, Hurst AM, Lapointe JY, Laprade R. Regulation of basolateral K channels in proximal tubule studied during continuous microperfusion. Am J Physiol Renal Fluid Electrolyte Physiol 264: F496–F501, 1993 [DOI] [PubMed] [Google Scholar]
- 4. Beck JS, Potts DJ. Cell swelling, co-transport activation and potassium conductance in isolated perfused rabbit kidney proximal tubules. J Physiol 425: 369–378, 1990 [DOI] [PMC free article] [PubMed] [Google Scholar]
- 5. Braam B, Mitchell KD, Fox J, Navar LG. Proximal tubular secretion of angiotensin II in rats. Am J Physiol Renal Fluid Electrolyte Physiol 264: F891–F898, 1993 [DOI] [PubMed] [Google Scholar]
- 6. Carey RM, Padia SH. Angiotensin AT2 receptors: control of renal sodium excretion and blood pressure. Trends Endocrinol Metab 19: 84–87, 2008 [DOI] [PubMed] [Google Scholar]
- 7. Cervenka L, Mitchell KD, Oliverio MI, Coffman TM, Navar LG. Renal function in the AT1A receptor knockout mouse during normal and volume-expanded conditions. Kidney Int 56: 1855–1862, 1999 [DOI] [PubMed] [Google Scholar]
- 8. Chan YL, Biagi B, Giebisch G. Control mechanisms of bicarbonate transport across the rat proximal convoluted tubule. Am J Physiol Renal Fluid Electrolyte Physiol 242: F532–F543, 1982 [DOI] [PubMed] [Google Scholar]
- 9. Cui X, Zhou J, Qiu J, Johnson MR, Mrug M. Validation of endogenous internal real-time PCR controls in renal tissues. Am J Nephrol 30: 413–417, 2009 [DOI] [PMC free article] [PubMed] [Google Scholar]
- 10. Du Z, Duan Y, Yan Q, Weinstein AM, Weinbaum S, Wang T. Mechanosensory function of microvilli of the kidney proximal tubule. Proc Natl Acad Sci USA 101: 13068–13073, 2004 [DOI] [PMC free article] [PubMed] [Google Scholar]
- 11. Du Z, Ferguson W, Wang T. Role of PKC and calcium in modulation of effects of angiotensin II on sodium transport in proximal tubule. Am J Physiol Renal Physiol 284: F688–F692, 2003 [DOI] [PubMed] [Google Scholar]
- 12. Du Z, Yan Q, Duan Y, Weinbaum S, Weinstein AM, Wang T. Axial flow modulates proximal tubule NHE3 and H-ATPase activities by changing microvillus bending moments. Am J Physiol Renal Physiol 290: F289–F296, 2006 [DOI] [PubMed] [Google Scholar]
- 13. Duan Y, Weinstein AM, Weinbaum S, Wang T. Shear stress-induced changes of membrane transporter localization and expression in mouse proximal tubule cells. Proc Natl Acad Sci USA 107: 21860–21865, 2010 [DOI] [PMC free article] [PubMed] [Google Scholar]
- 14. Gertz K, Boylan J. Glomerular-tubular balance. In: Handbook of Physiology. Renal Physiology. Bethesda, MD: Am. Physiol. Soc., 1973, sect. 8, chapt. 23, p. 763–790 [Google Scholar]
- 15. Grasset E, Gunter-Smith P, Schultz SG. Effects of Na-coupled alanine transport on intracellular K activities and the K conductance of the basolateral membranes of Necturus small intestine. J Membr Biol 71: 89–94, 1983 [DOI] [PubMed] [Google Scholar]
- 16. Green R, Moriarty RJ, Giebisch G. Ionic requirements of proximal tubular fluid reabsorption flow dependence of fluid transport. Kidney Int 20: 580–587, 1981 [DOI] [PubMed] [Google Scholar]
- 17. Gunter-Smith PJ, Grasset E, Schultz SG. Sodium-coupled amino acid and sugar transport by Necturus small intestine. An equivalent electrical circuit analysis of a rheogenic co-transport system. J Membr Biol 66: 25–39, 1982 [DOI] [PubMed] [Google Scholar]
- 18. Guo P, Weinstein AM, Weinbaum S. A hydrodynamic mechanosensory hypothesis for brush border microvilli. Am J Physiol Renal Physiol 279: F698–F712, 2000 [DOI] [PubMed] [Google Scholar]
- 19. Gurley SB, Riquier-Brison AD, Schnermann J, Sparks MA, Allen AM, Haase VH, Snouwaert JN, Le TH, McDonough AA, Koller BH, Coffman TM. AT1A angiotensin receptors in the renal proximal tubule regulate blood pressure. Cell Metab 13: 469–475, 2011 [DOI] [PMC free article] [PubMed] [Google Scholar]
- 20. Haithcock D, Jiao H, Cui XL, Hopfer U, Douglas JG. Renal proximal tubular AT2 receptor: signaling and transport. J Am Soc Nephrol 10, Suppl 11: S69–S74, 1999 [PubMed] [Google Scholar]
- 21. Hakam AC, Hussain T. Angiotensin II AT2 receptors inhibit proximal tubular Na+-K+-ATPase activity via a NO/cGMP-dependent pathway. Am J Physiol Renal Physiol 290: F1430–F1436, 2006 [DOI] [PubMed] [Google Scholar]
- 22. Harris PJ, Navar LG. Tubular transport responses to angiotensin. Am J Physiol Renal Fluid Electrolyte Physiol 248: F621–F630, 1985 [DOI] [PubMed] [Google Scholar]
- 23. Khan F, Spicarova Z, Zelenin S, Holtback U, Scott L, Aperia A. Negative reciprocity between angiotensin II type 1 and dopamine D1 receptors in rat renal proximal tubule cells. Am J Physiol Renal Physiol 295: F1110–F1116, 2008 [DOI] [PubMed] [Google Scholar]
- 24. Kobori H, Nangaku M, Navar LG, Nishiyama A. The intrarenal renin-angiotensin system: from physiology to the pathobiology of hypertension and kidney disease. Pharmacol Rev 59: 251–287, 2007 [DOI] [PubMed] [Google Scholar]
- 25. Kolb RJ, Woost PG, Hopfer U. Membrane trafficking of angiotensin receptor type-1 and mechanochemical signal transduction in proximal tubule cells. Hypertension 44: 352–359, 2004 [DOI] [PubMed] [Google Scholar]
- 26. Lapointe JY, Duplain M. Regulation of basolateral membrane potential after stimulation of Na+ transport in proximal tubules. J Membr Biol 120: 165–172, 1991 [DOI] [PubMed] [Google Scholar]
- 27. Lapointe JY, Garneau L, Bell PD, Cardinal J. Membrane crosstalk in the mammalian proximal tubule during alterations in transepithelial sodium transport. Am J Physiol Renal Fluid Electrolyte Physiol 258: F339–F345, 1990 [DOI] [PubMed] [Google Scholar]
- 28. Li XC, Hopfer U, Zhuo JL. AT1 receptor-mediated uptake of angiotensin II and NHE-3 expression in proximal tubule cells through a microtubule-dependent endocytic pathway. Am J Physiol Renal Physiol 297: F1342–F1352, 2009 [DOI] [PMC free article] [PubMed] [Google Scholar]
- 29. Li XC, Zhuo JL. In vivo regulation of AT1a receptor-mediated intracellular uptake of [125I]Val5-ANG II in the kidneys and adrenals of AT1a receptor-deficient mice. Am J Physiol Renal Physiol 294: F293–F302, 2008 [DOI] [PMC free article] [PubMed] [Google Scholar]
- 30. Liu FY, Cogan MG. Angiotensin II stimulates early proximal bicarbonate absorption in the rat by decreasing cyclic adenosine monophosphate. J Clin Invest 84: 83–91, 1989 [DOI] [PMC free article] [PubMed] [Google Scholar]
- 31. Liu FY, Cogan MG. Angiotensin II stimulation of hydrogen ion secretion in the rat early proximal tubule. Modes of action, mechanism, and kinetics. J Clin Invest 82: 601–607, 1988 [DOI] [PMC free article] [PubMed] [Google Scholar]
- 32. Liu FY, Cogan MG. Flow dependence of bicarbonate transport in the early (S1) proximal convoluted tubule. Am J Physiol Renal Fluid Electrolyte Physiol 254: F851–F855, 1988 [DOI] [PubMed] [Google Scholar]
- 33. Matsusaka T, Niimura F, Shimizu A, Pastan I, Saito A, Kobori H, Nishiyama A, Ichikawa I. Liver angiotensinogen is the primary source of renal angiotensin II. J Am Soc Nephrol 23: 1181–1189, 2012 [DOI] [PMC free article] [PubMed] [Google Scholar]
- 34. Messner G, Koller A, Lang F. The effect of phenylalanine on intracellular pH and sodium activity in proximal convoluted tubule cells of the frog kidney. Pflügers Arch 404: 145–149, 1985 [DOI] [PubMed] [Google Scholar]
- 35. Messner G, Oberleithner H, Lang F. The effect of phenylalanine on the electrical properties of proximal tubule cells in the frog kidney. Pflügers Arch 404: 138–144, 1985 [DOI] [PubMed] [Google Scholar]
- 36. Quan A, Baum M. Endogenous angiotensin II modulates rat proximal tubule transport with acute changes in extracellular volume. Am J Physiol Renal Physiol 275: F74–F78, 1998 [DOI] [PMC free article] [PubMed] [Google Scholar]
- 37. Quan A, Baum M. Endogenous production of angiotensin II modulates rat proximal tubule transport. J Clin Invest 97: 2878–2882, 1996 [DOI] [PMC free article] [PubMed] [Google Scholar]
- 38. Schnermann J, Wahl M, Liebau G, Fischbach H. Balance between tubular flow rate and net fluid reabsorption in the proximal convolution of the rat kidney. I. Dependency of reabsorptive net fluid flux upon proximal tubular surface area at spontaneous variations of filtration rate. Pflügers Arch 304: 90–103, 1968 [DOI] [PubMed] [Google Scholar]
- 39. Schultz SG. Homocellular regulatory mechanisms in sodium-transporting epithelia: avoidance of extinction by “flush-through”. Am J Physiol Renal Fluid Electrolyte Physiol 241: F579–F590, 1981 [DOI] [PubMed] [Google Scholar]
- 40. Schultz SG, Dubinsky WP, Lapointe JY. Volume regulation and ‘cross-talk’ in sodium-absorbing epithelial cells. Contrib Nephrol 123: 205–219, 1998 [DOI] [PubMed] [Google Scholar]
- 41. Seikaly MG, Arant BS, Jr, Seney FD., Jr Endogenous angiotensin concentrations in specific intrarenal fluid compartments of the rat. J Clin Invest 86: 1352–1357, 1990 [DOI] [PMC free article] [PubMed] [Google Scholar]
- 42. Sullivan JC. Sex and the renin-angiotensin system: inequality between the sexes in response to RAS stimulation and inhibition. Am J Physiol Regul Integr Comp Physiol 294: R1220–R1226, 2008 [DOI] [PubMed] [Google Scholar]
- 43. Thekkumkara TJ, Cookson R, Linas SL. Angiotensin (AT1A) receptor-mediated increases in transcellular sodium transport in proximal tubule cells. Am J Physiol Renal Physiol 274: F897–F905, 1998 [DOI] [PubMed] [Google Scholar]
- 44. Tisher CC, Kokko JP. Relationship between peritubular oncotic pressure gradients and morphology in isolated proximal tubules. Kidney Int 6: 146–156, 1974 [DOI] [PubMed] [Google Scholar]
- 45. Tsuchiya K, Wang W, Giebisch G, Welling PA. ATP is a coupling modulator of parallel Na,K-ATPase-K-channel activity in the renal proximal tubule. Proc Natl Acad Sci USA 89: 6418–6422, 1992 [DOI] [PMC free article] [PubMed] [Google Scholar]
- 46. Walker A, Bott P, Oliver J, MacDowell M. The collection and anylysis of fluid from single nephron of the mammalian kidney. Am J Physiol 134: 580–595, 1941 [Google Scholar]
- 47. Wang T, Chan YL. The role of phosphoinositide turnover in mediating the biphasic effect of angiotensin II on renal tubular transport. J Pharmacol Exp Ther 256: 309–317, 1991 [PubMed] [Google Scholar]
- 48. Wang T, Giebisch G. Effects of angiotensin II on electrolyte transport in the early and late distal tubule in rat kidney. Am J Physiol Renal Fluid Electrolyte Physiol 271: F143–F149, 1996 [DOI] [PubMed] [Google Scholar]
- 49. Weinbaum S, Duan Y, Satlin LM, Wang T, Weinstein AM. Mechanotransduction in the renal tubule. Am J Physiol Renal Physiol 299: F1220–F1236, 2010 [DOI] [PMC free article] [PubMed] [Google Scholar]
- 50. Weinstein AM. Chloride transport in a mathematical model of the rat proximal tubule. Am J Physiol Renal Fluid Electrolyte Physiol 263: F784–F798, 1992 [DOI] [PubMed] [Google Scholar]
- 51. Weinstein AM. Modeling epithelial cell homeostasis: steady-state analysis. Bull Math Biol 61: 1065–1091, 1999 [DOI] [PubMed] [Google Scholar]
- 52. Weinstein AM, Sontag ED. Modeling proximal tubule cell homeostasis: tracking changes in luminal flow. Bull Math Biol 71: 1285–1322, 2009 [DOI] [PMC free article] [PubMed] [Google Scholar]
- 53. Weinstein AM, Stephenson JL. Models of coupled salt and water transport across leaky epithelia. J Membr Biol 60: 1–20, 1981 [DOI] [PubMed] [Google Scholar]
- 54. Weinstein AM, Weinbaum S, Duan Y, Du Z, Yan Q, Wang T. Flow-dependent transport in a mathematical model of rat proximal tubule. Am J Physiol Renal Physiol 292: F1164–F1181, 2007 [DOI] [PubMed] [Google Scholar]
- 55. Welling LW, Welling DJ. Surface areas of brush border and lateral cell walls in the rabbit proximal nephron. Kidney Int 8: 343–348, 1975 [DOI] [PubMed] [Google Scholar]
- 56. Wilcox C, Baylis C. Glomerular-tubular balance and proximal regulation. In: The Kidney: Physiology and Pathophysiology, edited by Seldin DW, Giebisch G. Philadelphia, PA: Lippincott Williams & Wilkins, 1985, p. 985–1012 [Google Scholar]
- 57. Wong KR, Berry CA, Cogan MG. Flow dependence of chloride transport in rat S1 proximal tubules. Am J Physiol Renal Fluid Electrolyte Physiol 269: F870–F875, 1995 [DOI] [PubMed] [Google Scholar]
- 58. Wong PS, Johns EJ. The receptor subtype mediating the action of angiotensin II on intracellular sodium in rat proximal tubules. Br J Pharmacol 124: 41–46, 1998 [DOI] [PMC free article] [PubMed] [Google Scholar]
- 59. Xie MH, Liu FY, Wong PC, Timmermans PB, Cogan MG. Proximal nephron and renal effects of DuP 753, a nonpeptide angiotensin II receptor antagonist. Kidney Int 38: 473–479, 1990 [DOI] [PubMed] [Google Scholar]
- 60. Zhuo J, Harris PJ, Skinner SL. Modulation of proximal tubular reabsorption by angiotensin II. Clin Exp Pharmacol Physiol 13: 277–281, 1986 [DOI] [PubMed] [Google Scholar]
- 61. Zhuo JL, Li XC. New insights and perspectives on intrarenal renin-angiotensin system: focus on intracrine/intracellular angiotensin II. Peptides 32: 1551–1565, 2011 [DOI] [PMC free article] [PubMed] [Google Scholar]