Abstract
Although alcoholic liver disease is clinically well described, the molecular basis for alcohol-induced hepatotoxicity is not well understood. Previously, we found that alcohol exposure led to increased microtubule acetylation and stability in polarized, hepatic WIF-B cells and in livers from ethanol-fed rats. Because microtubules are known to regulate transcription factor nuclear translocation and dynamic microtubules are required for translocation of at least a subset of these factors, we examined whether alcohol-induced microtubule acetylation and stability impair nuclear translocation. We examined nuclear delivery of factors representing the two mechanisms by which microtubules regulate translocation. To represent factors that undergo directed delivery, we examined growth hormone-induced STAT5B translocation and IL-6-induced STAT3 translocation. To represent factors that are sequestered in the cytoplasm by microtubule attachment until ligand activation, we examined transforming growth factor-β-induced Smad2/3 translocation. We found that ethanol exposure selectively impaired translocation of the STATs, but not Smad2/3. STAT5B delivery was decreased to a similar extent by addition of taxol (a microtubule-stabilizing drug) or trichostatin A (a deacetylase inhibitor), agents that promote microtubule acetylation in the absence of alcohol. Thus the alcohol-induced impairment of STAT nuclear translocation can be explained by increased microtubule acetylation and stability. Only ethanol treatment impaired STAT5B activation, indicating that microtubules are not important for its activation by Jak2. Furthermore, nuclear exit was not changed in treated cells, indicating that this process is also independent of microtubule acetylation and stability. Together, these results raise the exciting possibility that deacetylase agonists may be effective therapeutics for the treatment of alcoholic liver disease.
Keywords: WIF-B cells, ethanol, hepatotoxicity
although alcoholic liver disease is clinically well described, the molecular basis for alcohol-induced hepatotoxicity is not well understood. Our studies to understand mechanisms of alcohol-induced hepatotoxicity have been performed in WIF-B cells, an emerging model system for studying liver injury. When cultured on plastic or glass, WIF-B cells enter a terminal differentiation program. After 7–10 days in culture, 70–95% of WIF-B cells become fully differentiated and exhibit phase-lucent structures that are functionally and compositionally analogous to the bile canaliculi (25). Domain-specific membrane proteins are localized in WIF-B cells, as they are in hepatocytes in situ, and liver-specific functions are maintained. Importantly, for these studies, WIF-B cells use endogenous alcohol dehydrogenase (ADH), acetaldehyde dehydrogenase, and cytochrome P-450 (CYP) 2E1 to metabolize alcohol (24). Recently, we determined that microtubules were more stable and hyperacetylated in ethanol-treated WIF-B cells (16). This phenotype requires alcohol metabolism and is likely mediated by acetaldehyde. We also determined that microtubules are acetylated to the same extent in livers from ethanol-fed rats, indicating that the effect has physiological relevance (16).
Although microtubules are known to support vesicle-mediated transport, it has become apparent that microtubules also regulate the nuclear translocation of a variety of transcription factors and hormone receptors. There are two models that describe microtubule involvement in translocation (4). 1) Microtubules sequester transcription factors/nuclear receptors in the cytoplasm, thereby preventing nuclear entry. Upon activation, the proteins are released from the polymer and diffuse to the nucleus. Examples of such sequestered factors include Smad2, Smad3, Smad4, c-myc, and MIZ-1 (myc-interacting zinc finger protein) (4). 2) The microtubules act as tracks upon which the activated transcription factors/nuclear receptors are rapidly and concertedly transported to the nucleus. Examples of these factors are STAT1, STAT5B, p53, glucocorticoid receptor, and retinoblastoma (4).
In all cases, the factors require an intact microtubule network for proper cellular distributions, but nocodazole addition has opposite effects. Upon microtubule depolymerization, the sequestered factors are released from the cytoskeleton and rapidly diffuse to the nucleus. In contrast, translocation of the factors in the second group is impaired by nocodazole. Several reports have shown that nuclear delivery of different STATs is impaired by increased microtubule stability and acetylation (10, 18, 20). Of particular interest are studies performed in WIF-B cells where growth hormone (GH)-induced STAT5B translocation was found to be microtubule-dependent and impaired by stable microtubules (20). Similarly, in adipocytes, interferon-γ- and leukemia inhibitory factor-induced nuclear translocation of STAT1 and STAT3 was impaired when microtubules were hyperstabilized by taxol (10). Thus we asked whether ethanol-induced microtubule acetylation and stability impair directed nuclear translocation.
To answer this question, we examined the directed nuclear translocation of STAT3 and STAT5B in ethanol-treated WIF-B cells. For comparison, we examined the translocation of Smad2/3, a sequestered factor. To determine whether the impairment is due to ethanol-induced microtubule acetylation and stability, we examined translocation in cells where global protein hyperacetylation was induced by treatment with the pan deacetylase inhibitor trichostatin A (TSA) or where microtubule acetylation was selectively increased by low taxol concentrations. Here, we show that ethanol-induced microtubule acetylation and stability selectively impair directed STAT3 and STAT5B nuclear translocation and that decreased STAT5B translocation results in decreased protein levels of its known target protein, EGF receptor (EGF-R).
MATERIALS AND METHODS
Reagents and antibodies.
Taxol, TSA, nocodazole, and 4-methylpyrazole (4-MP) were purchased from Sigma-Aldrich (St. Louis, MO), HEPES from HyClone (Logan, UT), Alexa-conjugated secondary antibodies from Invitrogen (Carlsbad, CA), antibodies against STAT5B (C-17), STAT3 (K-15), and Smad2/3 (FL-425) from Santa Cruz Biotechnology (Santa Cruz, CA), anti-phosphorylated STAT5B (C7E5) and Jak2 (D2e12) antibodies from Cell Signaling Technologies (Beverly, MA), anti-phosphorylated Jak2 (09-275) antibody from Upstate Biotech (Temecula, CA), and recombinant GH, IL-6, and transforming growth factor (TGF)-β from Shenandoah Biotechnology (Warwick, PA). Antibodies against EGF-R were kindly provided by Dr. A. Hubbard (Johns Hopkins University School of Medicine, Baltimore, MD).
Ethanol treatment of rats.
Male Wistar rats (Charles River Laboratories, Wilmington, MA) were pair-fed control and ethanol Lieber-DeCarli liquid diets (Dyets, Bethlehem, PA) for 5 wk, as described elsewhere (17). At the time the animals were euthanized, livers were excised and frozen at −70°C. The care, use, and procedures performed on these rats were approved by the Institutional Animal Care and Use Committee at the Omaha Veterans Affairs Medical Center and complied with National Institutes of Health guidelines.
Cell culture.
WIF-B cells were grown in a humidified 7% CO2 incubator at 37°C, as described elsewhere (25). Briefly, cells were grown in F-12 medium (pH 7.0) supplemented with 5% fetal bovine serum (Gemini, Woodland, CA), 10 mM hypoxanthine, 40 nM aminopterin, and 1.6 mM thymidine. Cells were seeded onto glass coverslips at 1.3 × 10⁴ cells/cm2 and grown for 8–12 days until they reached maximum polarity. Cells were treated on day 7 with 50 mM ethanol in the absence or presence of 1 mM 4-MP in medium buffered with 10 mM HEPES (pH 7.0) for 72 h, as described elsewhere (23). On day 2, cells were reincubated in fresh buffered medium containing 50 mM ethanol. VL-17A cells (provided by Dr. D. Clemens, University of Nebraska Medical Center, Omaha, NE) were grown in a 5% CO2 incubator at 37°C in DMEM containing 10% FBS and 400 μg/ml each of zeocin and G418, as described elsewhere (7). In general, cells were treated on day 4 with 50 mM ethanol for 24 h in medium buffered with 10 mM HEPES (pH 7.0).
Drug treatments.
To depolymerize microtubules, cells were treated with 33 μM nocodazole in complete medium for 1 h at 37°C. To hyperacetylate microtubules, cells were treated with 50 nM TSA for 30 min at 37°C or with 10 mM taxol in complete medium for 2 h at 37°C.
Indirect immunofluorescence microscopy.
WIF-B cells were fixed on ice with chilled PBS containing 4% paraformaldehyde for 1 min and permeabilized with ice-cold methanol for 10 min. Cells were processed for indirect immunofluorescence, as described previously (12). Alexa-conjugated secondary antibodies were used at 5 μg/ml. Cells were visualized by epifluorescence using a fluorescence microscope (Olympus BX60, OPELCO, Dulles, VA). Images were taken with a Coolsnap HQ2 digital camera (Photometrics, Tucson, AZ) and IP Labs software (Biovision, Exton, PA). Adobe Photoshop (Adobe Systems, Mountain View, CA) was used to compile figures. For quantitation of the relative distributions of the transcription factors, random fields were visualized by epifluorescence and digitized. From micrographs, the average pixel intensity of selected regions of interest (ROI) placed in the nucleus or cytoplasm of the same cell was measured using the Measure ROI tool of ImageJ (National Institutes of Health), as described elsewhere (19, 21). The ratio of nuclear to cytoplasmic fluorescence intensities was determined. Typically, values were determined from ≥3 independent experiments, where 5–10 random fields were acquired for each condition, which contained 15–30 polarized cells each.
Immunoblotting.
Proteins were separated using SDS-PAGE, transferred to nitrocellulose, and immunoblotted with antibodies specific to STAT5B (1:5,000–10,000 dilution) or STAT3, Smad2/3, or phosphorylated STAT5B (pSTAT5B) (all at 1:1,000 dilution). Antibodies were diluted in PBS containing 5% (wt/vol) milk and 0.1% (vol/vol) Tween 20 and incubated overnight at 4°C. Anti-Jak2 and anti-phosphorylated Jak2 (pJak2) antibodies (both at 1:1,000 dilution) were diluted in PBS containing 1% (wt/vol) BSA and 0.1% (vol/vol) Tween 20 and incubated overnight at 4°C. Immunoreactivity was detected using enhanced chemiluminescence (PerkinElmer, Crofton, MD). Relative expression levels were determined by densitometric analysis of immunoreactive bands.
Ligand addition and washout.
Cells were treated with 50 nM (1.11 ng/ml) GH, 500 pM (12.5 pg/ml) TGF-β, or 50 nM (1.05 ng/ml) IL-6 for up to 30 min at 37°C. Samples were processed for indirect immunofluorescence microscopy or lysed with SDS-PAGE sample buffer at the indicated times. For washout experiments, after 30 min of GH addition, prewarmed medium was added to dilute the ligand 40-fold, and cells were incubated up to an additional 30 min at 37°C and processed for indirect immunofluorescence.
Nuclear purification.
Nuclei were purified using the EZ lysis kit (Sigma-Aldrich) according to the manufacturer's instructions. Then 5× SDS-PAGE sample buffer was added to supernatants, and pellets were resuspended directly in 100 μl of 1× SDS-PAGE sample buffer and boiled for 5 min.
Liver fractionation.
Subcellular fractionation was performed as described elsewhere (26). Briefly, livers were Dounce-homogenized with 10 strokes of a loose-fitting pestle in 0.25 M sucrose containing 10 mM Tris and 2 μg/ml each of leupeptin, antipain, PMSF, and benzamidine. Homogenates (20% wt/vol) were centrifuged at 900 g at 4°C for 5 min. The resultant supernatant was centrifuged at 150,000 g at 4°C for 60 min to prepare the cytosolic (supernatant) and nonnuclear (pellet) membranes. The nuclear pellet was washed by resuspension to volume and centrifugation at 14,200 g at 4°C for 10 min. Samples were mixed with 2× sample buffer and boiled for 3 min.
Statistical analysis.
Values are means ± SE. Comparisons between control and treated cells were made using Student's t-test for paired data. P ≤ 0.05 is considered significant.
RESULTS
STAT and Smad steady-state distributions and nuclear translocation are differentially dependent on microtubules.
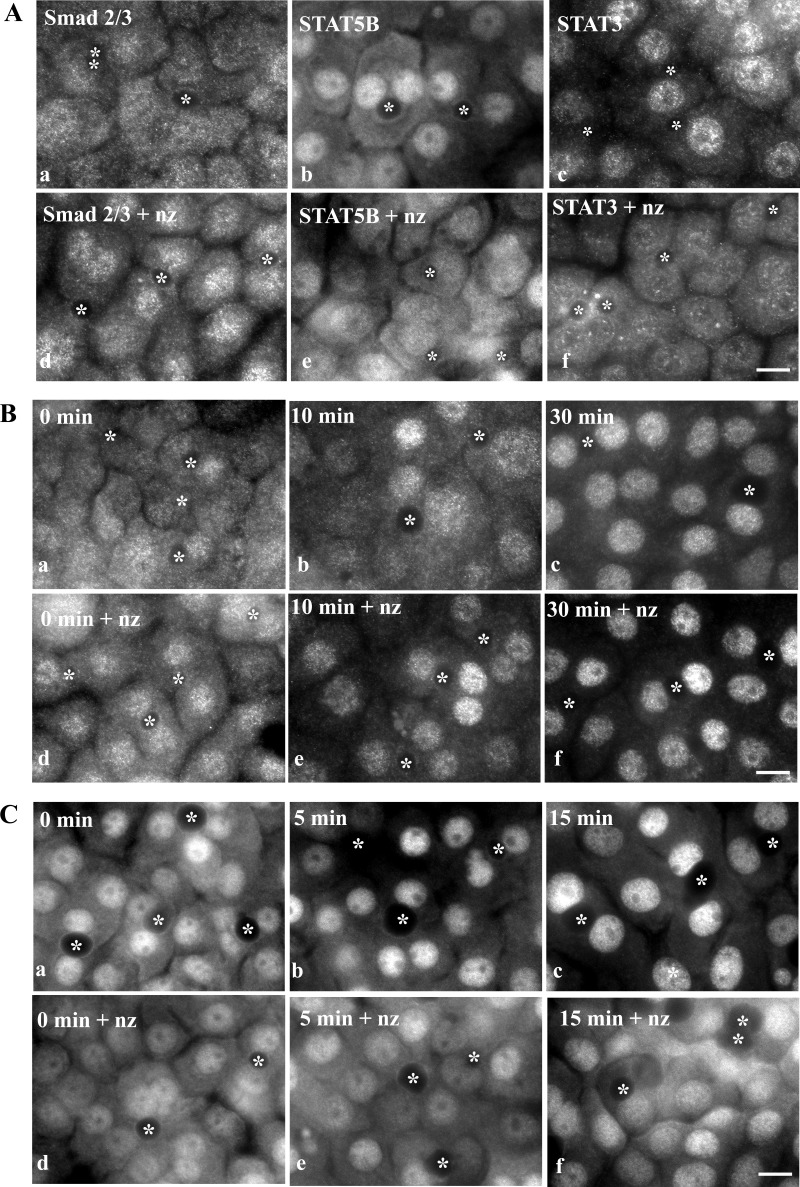
To confirm that microtubules play two distinct roles in nuclear translocation in WIF-B cells, we examined the steady-state distributions of Smad2/3 (a microtubule sequestered factor) and STAT3 and STAT5B (actively transported factors) in nocodazole-treated cells. In control cells, Smad2/3 distributed equally between the cytosol and nucleus (Fig. 1A, image a). Consistent with it being a sequestered factor, increased nuclear Smad2/3 was detected in nocodazole-treated cells (Fig. 1A, image d). STAT5B was also detected in the nucleus and cytosol in control cells, but, in contrast to Smad2/3, increased cytosolic staining was observed in nocodazole-treated cells (Fig. 1A, images b and e). Although much less cytosolic STAT3 than STAT5B was detected in control cells, increased cytosolic staining was also observed in nocodazole-treated cells (Fig. 1A, images c and f). This increased cytosolic staining for STAT5B and STAT3 is consistent with STAT5B and STAT3 being actively transported factors.
Fig. 1.
Microtubule depolymerization enhances Smad2/3 nuclear delivery but impairs STAT translocation. A: cells were treated in the absence (a–c) or presence of 33 μM nocodazole (nz) for 1 h (d–f). Cells were fixed and immunolabeled for Smad2/3 (a and d), STAT5B (b and e), or STAT3 (c and f). B: cells were pretreated in the absence (a–c) or presence of 33 μM nocodazole for 1 h (d–f). Transforming growth factor (TGF)-β (500 pM) was added (in the continued presence of nocodazole) for 0, 10, and 30 min, and cells were fixed and immunolabeled for Smad2/3. C: cells were pretreated in the absence (a–c) or presence of nocodazole (d–f) as in described in B. Growth hormone (GH, 50 nM) was added for 0, 5, and 15 min, and cells were fixed and immunolabeled for STAT5B. ∗, Selected bile canaliculi. Scale bars, 10 μm.
To directly assess the effects of microtubule depolymerization on nuclear translocation, we monitored the nuclear delivery of the transcription factors in cells activated by addition of their cognate ligands. Addition of TGF-β led to the dramatic redistribution of Smad2/3 to the nucleus. By 10 min, nuclear labeling was observed, and by 30 min, nuclear delivery was nearly complete (Fig. 1B). Consistent with Smad2/3 being a sequestered factor, addition of nocodazole led to even more rapid nuclear translocation. Within 10 min, robust nuclear labeling was observed (Fig. 1B). GH addition led to an even more rapid shift in STAT5B distributions. In control cells, increased nuclear labeling was observed by 5 min, with peak delivery after 15 min (Fig. 1C). Consistent with STAT5B requiring intact microtubules for nuclear delivery, its nuclear translocation was impaired after GH addition in nocodazole-treated cells. Little increased nuclear staining was observed even after 15 min of activation. Similar results were observed for STAT3 upon IL-6 addition (unpublished results).
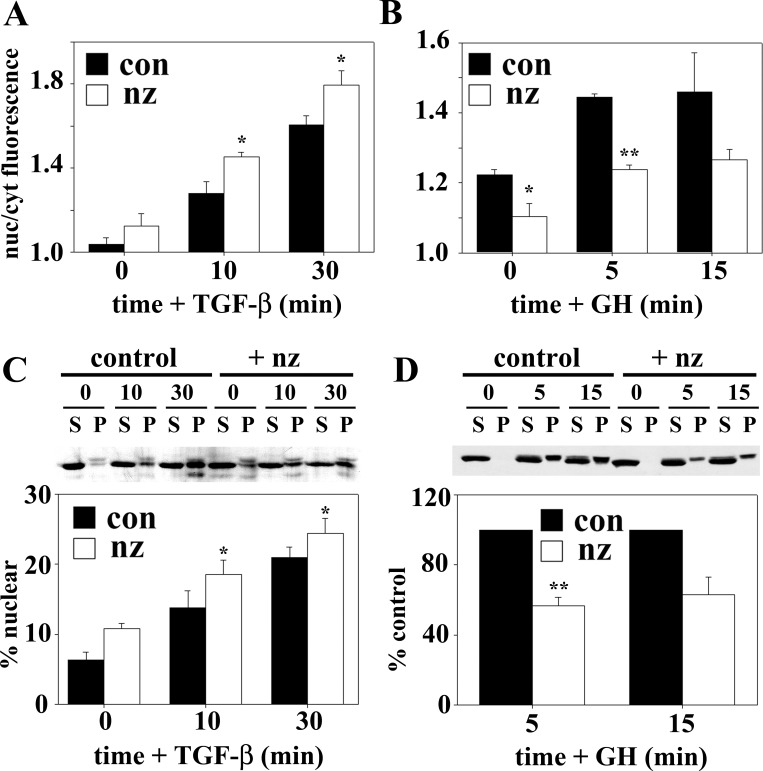
To quantitate these differences, we measured relative Smad2/3 or STAT5B fluorescence intensities in the nucleus vs. cytoplasm. In control cells, a rapid increase in the ratios was observed for both transcription factors after ligand addition, indicating increased nuclear translocation (Fig. 2, A and B). In nocodazole-treated cells, the nuclear-to-cytoplasmic ratios for Smad2/3 were higher at each time point, peaking at ∼1.8, indicating enhanced delivery. In contrast, the nuclear-to-cytoplasmic ratios for STAT5B were lower than control at each time point, remaining at ∼1.2. These data were confirmed biochemically in nuclei isolated from ligand-stimulated WIF-B cells. At steady state, <5% of Smad2/3 was nuclear, whereas >10% was nuclear in nocodazole-treated cells (Fig. 2C). After 10 min of TGF-β stimulation, the percent nuclear Smad2/3 increased to a greater extent in nocodazole-treated than control cells, indicating enhanced delivery. In contrast, nocodazole decreased STAT5B nuclear delivery after GH stimulation at all time points (Fig. 2D). Together, these results confirm that microtubules differentially regulate nuclear translocation in WIF-B cells.
Fig. 2.
Microtubule depolymerization enhances Smad2/3, but impairs STAT5B, nuclear translocation after ligand stimulation. A and B: ratio of nuclear (nuc) to cytoplasmic (cyt) fluorescence intensity was calculated for Smad2/3 (A) and STAT5B (B) and plotted. con, Control. C: cells were treated in the absence (con) or presence of 33 μM nocodazole for 1 h. TGF-β (500 pM) was added (in the continued presence of nocodazole) for 0, 10, and 30 min, and nuclei were purified. Supernatants (S) and pelleted nuclei (P) were immunoblotted for Smad2/3. D: cells were pretreated in the absence or presence of nocodazole as described in C. GH (50 nM) was added for 5 and 15 min, nuclei were purified, and supernatants and pelleted nuclei were immunoblotted for STAT5B. Smad2/3 and STAT5B nuclear distributions were calculated and plotted. Values are means ± SE from ≥3 independent experiments. *P ≤ 0.05, **P ≤ 0.01.
Ethanol impairs nuclear translocation of the STATs, but not Smad2/3.
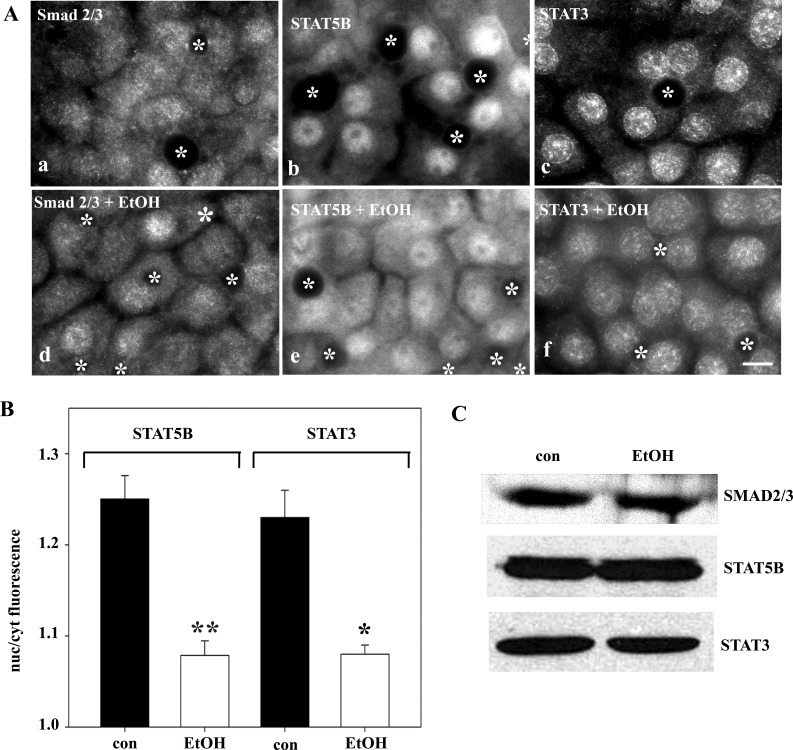
To determine whether ethanol exposure selectively impairs directed microtubule translocation, we first examined Smad2/3, STAT5B, and STAT3 steady-state distributions. Smad2/3 distributed equally between the cytosol and nucleus in control and ethanol-treated cells (Fig. 3A), suggesting no change in its translocation. In contrast, much greater STAT5B and STAT3 cytoplasmic staining was observed in ethanol-treated cells (Fig. 3A). Quantification confirmed these observations. In control cells, the nuclear-to-cytoplasmic ratio was 1.25 ± 0.01 for STAT5B and 1.23 ± 0.03 for STAT3 (Fig. 3B). In ethanol-treated cells, decreased ratios were calculated for STAT5B and STAT3 (1.08 ± 0.004 and 1.08 ± 0.01, respectively), indicating decreased nuclear localization. Although the reduction was modest (∼15%), it was statistically significant (P ≤ 0.01). The Smad2/3 ratios were nearly identical in control and ethanol-treated cells (1.10 ± 0.01 and 1.09 ± 0.05, respectively), also confirming the morphological results. To confirm that the apparent change in STAT distributions was not due to altered protein levels, we immunoblotted lysates from control and ethanol-treated cells. As shown in Fig. 3C, their expression levels did not change.
Fig. 3.
Ethanol exposure alters steady-state distributions of STAT5B and STAT3, but not Smad2/3. A: WIF-B cells were incubated in HEPES-buffered medium for 72 h in the absence or presence of 50 mM ethanol (EtOH). Cells were fixed and immunolabeled for Smad2/3, STAT5B, or STAT3. ∗, Selected bile canaliculi. Scale bar, 10 μm. B: ratio of nuclear to cytoplasmic fluorescence intensities was calculated for STAT5B and STAT3. Values are means ± SE from ≥3 independent experiments. *P ≤ 0.05, **P ≤ 0.01. C: control and ethanol-treated cells were immunoblotted for Smad2/3, STAT5B, and STAT3.
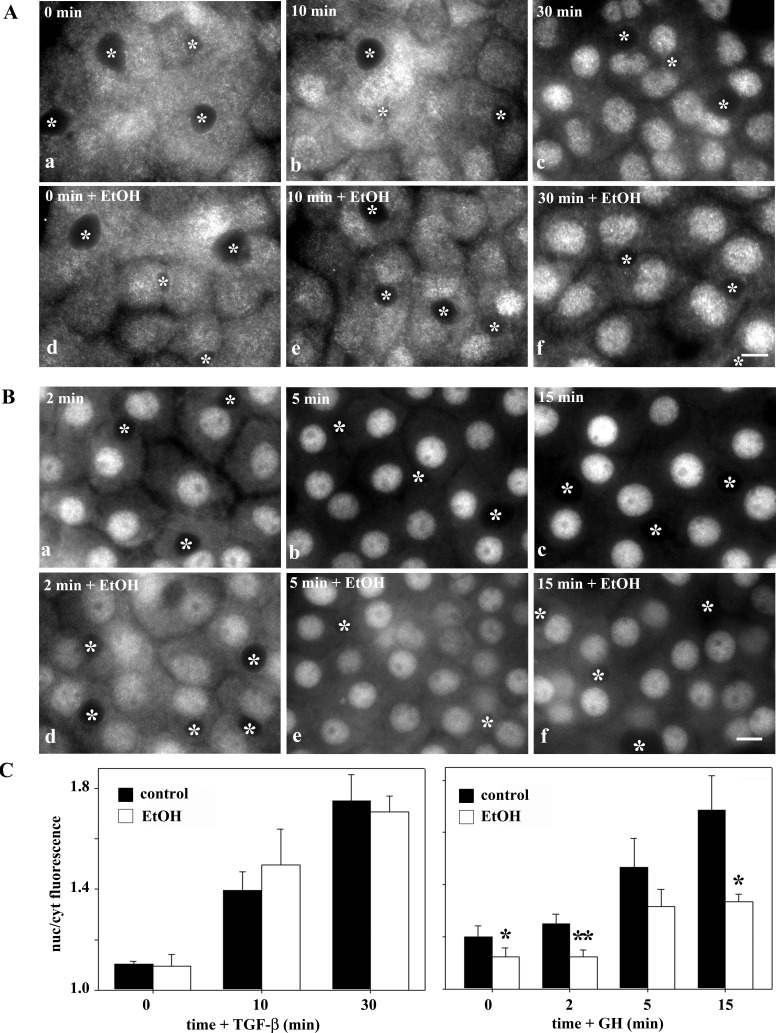
To directly determine whether ethanol exposure impairs translocation, we monitored nuclear delivery in ligand-activated cells. As described above, TGF-β addition led to Smad2/3 nuclear delivery, and in ethanol-treated cells, similar kinetics of translocation were observed (Fig. 4A). In contrast, STAT5B nuclear delivery was markedly impaired in ethanol-treated cells. Even after 15 min of GH addition, when nuclear delivery peaks in controls, substantial cytoplasmic staining was observed (Fig. 4B). Similar results were observed for IL-6-induced STAT3 translocation (unpublished results). Quantitation of the experiments confirms our observations. For each time point after TGF-β addition, nearly identical Smad2/3 nuclear-to-cytoplasmic ratios were measured (Fig. 4C, left). In contrast, decreased ratios were observed for STAT5B at each time point, indicating impaired delivery (Fig. 4C, right). From these results, we conclude that ethanol exposure selectively impairs directed microtubule-dependent nuclear translocation.
Fig. 4.
Ethanol exposure inhibits ligand-stimulated translocation of STAT5B, but not Smad2/3. A: control (a–c) and ethanol-treated (d–f) cells were incubated with 500 pM TGF-β for 0, 10, and 30 min. Cells were fixed and immunolabeled for Smad2/3. B: control (a–c) and ethanol-treated (d–f) cells were incubated with 50 nM GH for 2, 5, and 15 min. Cells were fixed and immunolabeled for STAT5B. ∗, Selected bile canaliculi. Scale bar, 10 μm. C: ratio of nuclear to cytoplasmic fluorescence intensities was calculated for Smad2/3 (left) and STAT5B (right). Values are means ± SE from ≥3 independent experiments. *P ≤ 0.05, **P ≤ 0.01.
Decreased nuclear STAT5B is observed in VL-17A cells and livers from ethanol-fed rats.
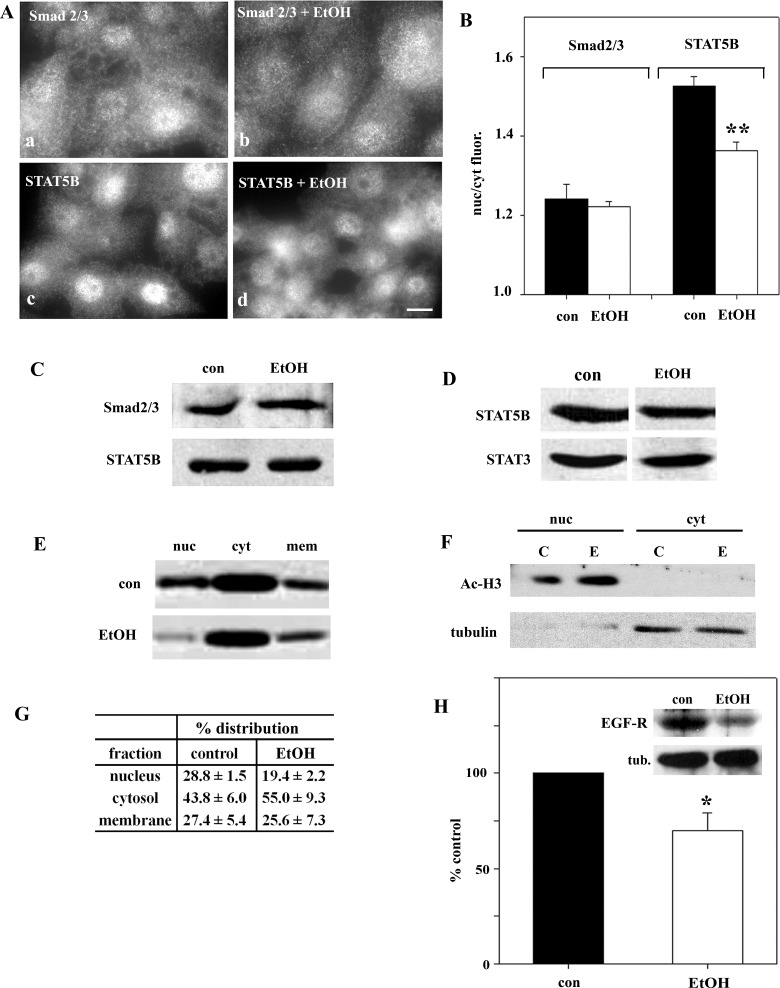
Because more STAT5B than STAT3 is cytosolic, nuclear translocation is more easily visualized and measured; thus we focused on STAT5B for the remaining studies. To confirm that our observations were not specific to the WIF-B cells, we examined STAT5B and Smad2/3 distributions in the hepatic VL-17A cells. Importantly, these cells have been engineered to stably express ADH and CYP2E1 and efficiently metabolize ethanol (7). As observed in WIF-B cells, more cytosolic STAT5B was observed in ethanol-treated VL-17A than control cells (Fig. 5A). Also, as seen in WIF-B cells, Smad2/3 distributions did not change. When quantitated, the nuclear-to-cytosolic fluorescence intensities were decreased only for STAT5B in ethanol-treated cells (Fig. 5B). Because protein expression levels did not change in treated cells (Fig. 5C), we conclude that STAT5B redistribution accounts for greater cytosolic staining, not enhanced expression.
Fig. 5.
Decreased nuclear STAT5B in VL-17A cells and livers from ethanol-fed rats. A: VL-17A cells were incubated in HEPES-buffered medium for 24 h in the absence or presence of 50 mM ethanol. Cells were fixed and immunolabeled for Smad2/3 or STAT5B. ∗, Selected bile canaliculi. Scale bar, 10 μm. B: ratio of nuclear to cytoplasmic fluorescence intensities was calculated for Smad 2/3 and STAT5B. Values are means ± SE from ≥3 independent experiments. **P ≤ 0.01. C: control and ethanol-treated VL-17A cells were immunoblotted for Smad2/3 or STAT5B. D: male Wistar rats were pair-fed control or ethanol Lieber-DeCarli liquid diets for 5 wk. Liver whole homogenates from control and ethanol-fed rats were immunoblotted for STAT5B or STAT3. Blot is representative of 3 independent experiments. E: liver whole homogenates from control and ethanol-fed rats were subfractionated to prepare nuclear (nuc), cytosolic (cyt), and nonnuclear membrane (mem) samples. Fractions were immunoblotted for STAT5B. A representative blot is shown. Immunoreactivity was measured using densitometry and plotted in G. Values are means ± SE from 3 independent pairs of rats. F: to assess fraction purity, cytosolic and nuclear fractions were immunoblotted for acetylated histone H3 (Ac-H3, nuclear marker) or α-tubulin (cytosolic marker). C, control; E, ethanol-fed. H: control and ethanol-treated cells were immunoblotted for EGF receptor (EGF-R) or α-tubulin (tub) as a loading control (inset). Immunoreactivity was measured using densitometry, and EGF-R levels were normalized to tubulin levels and calculated as percentage of control. Values are means ± SE from 4 independent experiments. *P ≤ 0.046.
To confirm that our WIF-B and VL-17A observations have physiological importance, we examined STAT5B in livers from ethanol-fed rats. As observed in WIF-B cells, STAT5B expression in rat livers was not changed by ethanol exposure (Fig. 5D); STAT5B expression in ethanol-treated livers was 95 ± 10.4% of control levels (n = 3). To determine if alcohol feeding leads to increased cytosolic STAT5B levels, we examined its distributions in fractions containing isolated nuclei, cytosol, or total nonnuclear membranes that were prepared according to our previously published methods (26). Importantly, marker analysis confirmed the relative purity and equal loading of the fractions (Fig. 5F) (see Ref. 26 for further characterization). In control animals, 28.8 ± 1.5% of STAT5B was present in the nuclear fraction. In contrast, only 19.4 ± 2.2% of STAT5B was present in nuclei from ethanol-treated animals, with a corresponding increase in the cytosol (from 43.8 ± 6.0 in control to 55.0 ± 9.3% in treated cells; Fig. 5, E and G). This STAT5B redistribution is remarkably similar to that observed in WIF-B cells, confirming the physiological importance of our findings.
Expression of EGF-R, a downstream target of STAT5B, is decreased in ethanol-treated cells.
To determine whether the ethanol-induced impairment in STAT5B nuclear translocation led to altered STAT5B-mediated signaling, we examined the protein expression levels of EGF-R in control and ethanol-treated WIF-B cells. Importantly, expression of this receptor is known to be reduced in livers from STAT5B knockout mice and in livers from rats or mice chronically fed ethanol (2, 5, 6). In control cells, EGF-R was robustly detected on immunoblots (Fig. 5H). However, in ethanol-treated cells, expression was significantly diminished. When quantitated, EGF-R protein expression was determined to be only 69.9 ± 9.2% (P ≤ 0.046) of that in control cells when normalized to total α-tubulin expression (Fig. 5H), indicating that decreased STAT5 translocation is functionally significant.
Increased microtubule acetylation and stability impair STAT5B nuclear translocation.
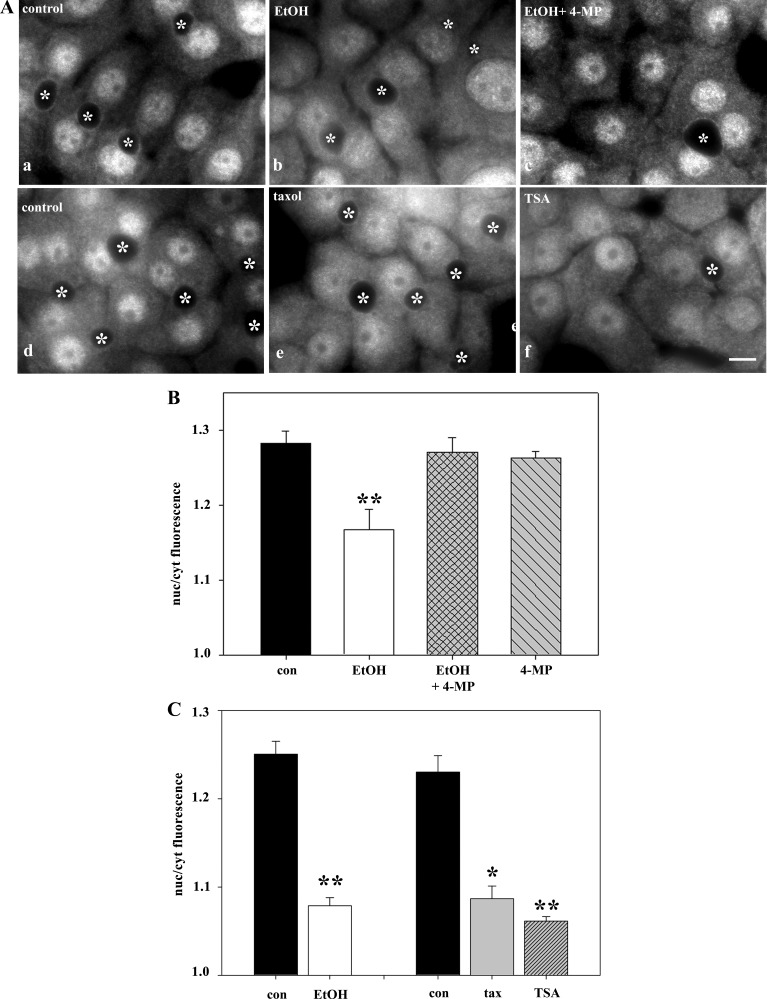
To determine whether the altered STAT5B distributions required ethanol metabolism, we treated ethanol-exposed cells with the ADH inhibitor 4-MP. Concomitant incubation with 4-MP prevented this redistribution, and more nuclear STAT5B was observed (Fig. 6A). Quantitation confirmed these observations. In control cells, the nuclear-to-cytoplasmic ratio was 1.28 ± 0.02, and in ethanol-treated cells, the ratio dropped to 1.17 ± 0.03 (Fig. 6B). In cells also treated with 4-MP, the ratio was nearly identical to that in controls (1.27 ± 0.02). Treatment with 4-MP alone had no effect on STAT5B distributions (ratio = 1.26 ± 0.01). Thus, impaired STAT5B nuclear translocation requires alcohol metabolism and is likely mediated by acetaldehyde.
Fig. 6.
Ethanol-induced microtubule acetylation leads to increased cytosolic STAT5B. A: cells were treated with 50 mM ethanol alone (b) or 1 mM 4-methylpryazole (4-MP, c). Cells were also treated with 20 μM taxol for 2 h (e) or 50 nM trichostatin A (TSA) for 30 min (f). Cells were fixed and immunolabeled for STAT5B. ∗, Selected bile canaliculi. Scale bar, 10 μm. B and C: ratio of STAT5B nuclear to cytoplasmic fluorescence intensity was calculated in cells treated with ethanol and/or 4-MP or ethanol, taxol, or TSA. Values are means ± SE from 3 independent experiments. *P ≤ 0.05, **P ≤ 0.01.
To determine whether the ethanol-impaired STAT5B translocation was due to increased microtubule stability and acetylation, two agents were used in the absence of ethanol. TSA was used as described elsewhere (15) to globally hyperacetylate cellular proteins (including tubulin) to the same extent as ethanol. Additionally, microtubules were specifically stabilized and acetylated using low taxol concentrations, also as described elsewhere (20). Both treatments led to enhanced STAT5B cytoplasmic distributions (Fig. 6A). When quantitated, remarkably similar decreases in nuclear-to-cytoplasmic labeling were observed in taxol-treated (1.09 ± 0.01, 12.1% decrease) and TSA-treated (1.06 ± 0.01, 14.8% decrease) cells, and those values correspond well to the value for ethanol-treated cells (1.08 ± 0.004, 14.6% decrease; Fig. 6C).
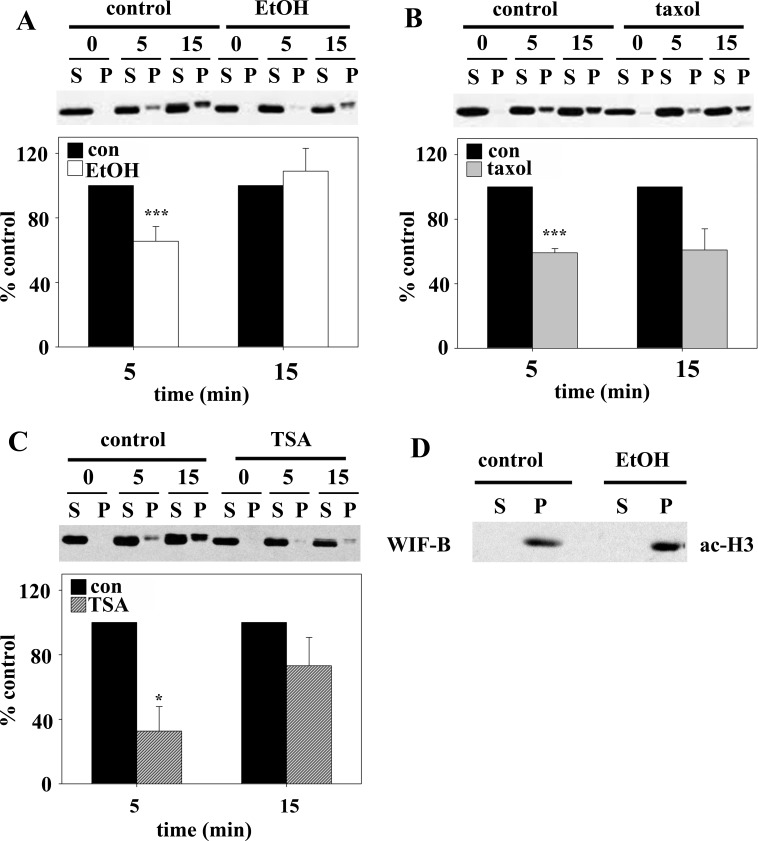
To confirm these observations, we monitored STAT5B distributions after GH addition by immunoblotting purified nuclei. Increased STAT5B was detected in nuclear pellets upon GH addition in control cells (Fig. 7A). However, this redistribution was attenuated and delayed in ethanol-treated cells. Similarly, in taxol-treated (Fig. 7B) or TSA-treated (Fig. 7C) cells, much less STAT5B was recovered in the nuclear pellets after 5 and 15 min of GH addition. Because the amounts recovered in the pellets were less than expected on the basis of our images, we immunoblotted the fractions for acetylated histone H3, an exclusively nuclear protein. All histone immunoreactivity was detected in the pelleted fractions in control and ethanol-treated cells, indicating full recovery (Fig. 7D). Even after darker exposures, histone H3 immunoreactivity was detected only in the pellet (unpublished results).
Fig. 7.
Ethanol-induced microtubule acetylation can explain impaired STAT5B nuclear translocation. A–C: cells were treated with ethanol, 20 μM taxol for 2 h, or 50 nM TSA for 30 min. In the continued presence of each agent, cells were incubated with 50 nM GH. Nuclei were purified, and pelleted nuclei (P) and resultant supernatants (S) were immunoblotted for STAT5B. Immunoreactivity was measured using densitometry, and relative STAT5B nuclear distribution was calculated. Values (means ± SE from ≥3 independent experiments) were normalized to percentage of control nuclear distribution. *P ≤ 0.05, ***P ≤ 0.005. D: nuclei were purified from control or ethanol-treated cells, and pelleted nuclei and resultant supernatants were immunoblotted for acetylated histone H3.
STAT5B activation by Jak2 and nuclear exit are independent of microtubule acetylation and stability.
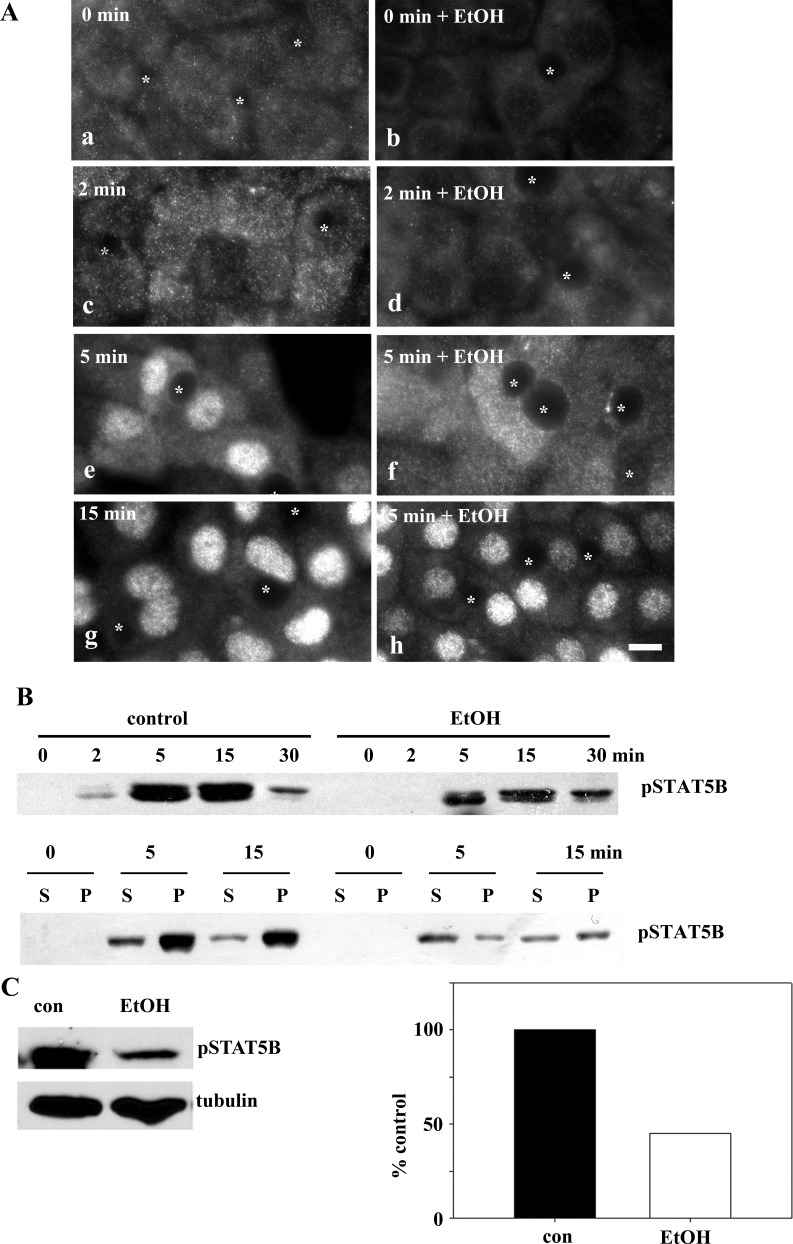
Because STAT5B nuclear translocation occurs after its ligand-stimulated phosphorylation, we examined whether impaired translocation was due to decreased activation. We monitored activation by immunolabeling cells for STAT5B phosphorylated on Tyr694 (pSTAT5B) after GH addition. In cells without added ligand, no pSTAT5B was observed in control or treated cells (Fig. 8A). After 2 min, diffuse cytoplasmic labeling was observed only in control cells. Not until 5 min, was cytosolic pSTAT5B detected in treated cells, while nuclear pSTAT5B was detected in controls. By 15 min, virtually all pSTAT5B was nuclear in control cells, whereas a substantial cytosolic pool persisted in ethanol-treated cells.
Fig. 8.
Ethanol impairs STAT5B phosphorylation after GH addition. A: control (a, c, e, and g) and ethanol-treated (b, d, f, and h) cells were incubated with 50 nM GH for indicated times. Cells were fixed and immunolabeled for phosphorylated STAT5B. ∗, Selected bile canaliculi. Scale bar, 10 μm. B: lysates (top) and purified nuclei (bottom) from cells treated as described in A and pelleted nuclei (P) and resultant supernatants (S) were immunoblotted for phosphorylated STAT5B (pSTAT5B). C: liver whole homogenates from control and ethanol-fed rats were immunoblotted for phosphorylated STAT5B or α-tubulin. Relative levels of expression were determined from densitometric analysis of the immunoreactive species, normalized to α-tubulin levels, and plotted as percentage of control.
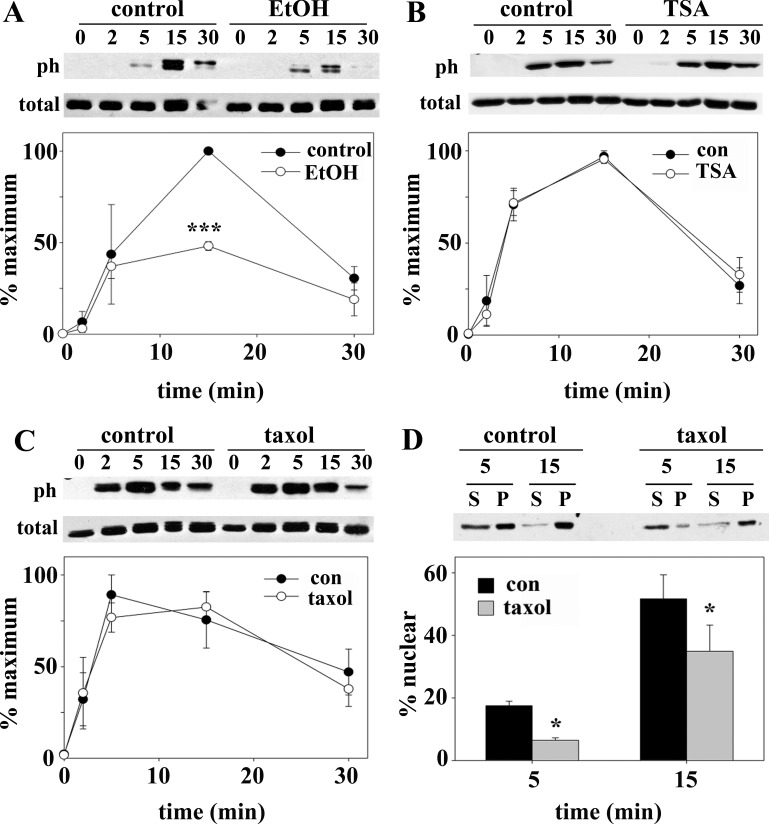
These observations were confirmed biochemically by immunoblotting cell lysates for pSTAT5B. In control cells, pSTAT5B was detected after only 2 min, with peak phosphorylation at 5–15 min (Fig. 8B, top). After 30 min, pSTAT5B levels returned to near-unstimulated levels. As seen morphologically, STAT5B phosphorylation was decreased and delayed in ethanol-treated cells; pSTAT5B was not detected until after 5 min of GH addition and persisted to 30 min (Fig. 8B, top). Immunoblots of purified nuclei confirmed these results. In control cells, substantial nuclear pSTAT5B was detected after 5 min of GH addition and remained high after 15 min. In contrast, the overall pSTAT5B levels and nuclear distribution were decreased (Fig. 8B, bottom) in treated cells. STAT5B phosphorylation was also impaired in livers from ethanol-fed rats. As shown in Fig. 8C, phosphorylation levels were reduced to only 45% of controls when normalized to tubulin. Importantly, these were the same fractions immunoblotted for total STAT5B in Fig. 5, where levels did not change. This impairment was strikingly similar to that in ethanol-treated WIF-B cells, where peak STAT5B phosphorylation after 15 min of GH addition was reduced to 48% of control (Fig. 9A).
Fig. 9.
Ethanol, but not taxol or TSA, impairs STAT5B phosphorylation after GH addition. A–C: cells were treated with ethanol, 20 μM taxol for 2 h, or 50 nM TSA for 30 min. In the continued presence of each agent, cells were incubated with 50 nM GH for up to 30 min. Cell lysates were immunoblotted for phosphorylated STAT5B (ph) or total STAT5B. Immunoreactivity was measured by densitometry and plotted as percentage of maximal phosphorylation. Values are means ± SE from 3 independent experiments. D: cells were treated as described in C, and nuclei were purified. Supernatants (S) and pelleted nuclei (P) were immunoblotted for phosphorylated STAT5B, and its nuclear distribution was calculated as percentage of total STAT5B. *P ≤ 0.05, ***P ≤ 0.005.
In contrast, pSTAT5B levels were nearly identical in control, taxol-treated (Fig. 9B), or TSA-treated (Fig. 9C) cells. Importantly, total STAT5B levels did not change with any of these treatments. To confirm that impaired nuclear translocation in ethanol-treated cells was activation-independent but dependent on enhanced microtubule acetylation and stability, we examined pSTAT5B translocation in taxol-treated cells that have control pSTAT5B levels. In control cells, 17.5 ± 1.5% of pSTAT5B was nuclear by 5 min compared with only 6.5 ± 0.8% in taxol-treated cells; by 15 min, 51.7 ± 7.7% was nuclear in controls, while only 34.9 ± 8.4% was nuclear in taxol-treated cells (Fig. 9D). Together, these results indicate that ethanol impairs STAT5B phosphorylation and subsequent translocation and that only the latter step is microtubule-dependent.
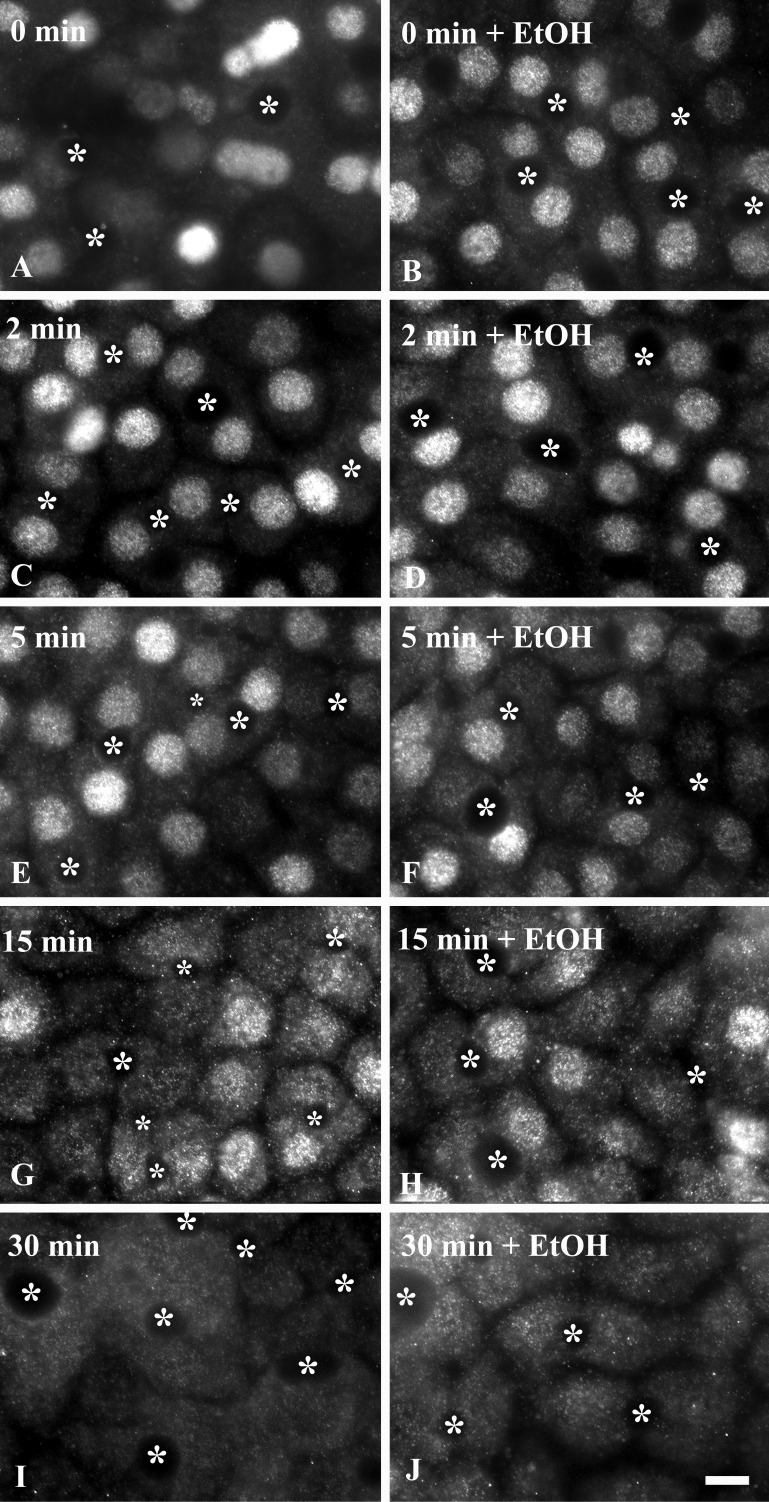
From these results, we further predict that nuclear exit and dephosphorylation, processes thought to be microtubule-independent, are not changed in ethanol-treated cells. For these experiments, cells were treated with GH for 30 min to fully translocate STAT5B to the nucleus. The ligand was diluted 40-fold to biologically inactive concentrations by addition of prewarmed medium, and pSTAT5B was monitored for up to 30 min of withdrawal. In control and ethanol-treated cells, robust nuclear pSTAT5B labeling was observed at 0 min of ligand withdrawal (Fig. 10). By 5 min, overall pSTAT5B signal was diminished, with a subpopulation in the cytoplasm reflecting dephosphorylation and nuclear exit, respectively. By 15 min, further decreased pSTAT5B staining was observed with increased cytoplasmic staining, indicating additional nuclear exit and dephosphorylation in control and ethanol-treated cells. Finally, by 30 min, pSTAT5B staining in control and treated cells returned to unstimulated levels. Similar results were obtained using TSA (unpublished results). Thus, as predicted, nuclear exit and dephosphorylation are not impaired in ethanol-treated cells.
Fig. 10.
Ethanol does not impair STAT5B dephosphorylation or nuclear exit. Cells were treated in the absence (A, C, E, G, and I) or presence of 50 mM ethanol for 72 h (B, D, F, H, and J) at 37°C. In the continued presence of ethanol, cells were incubated with 50 nM GH for 30 min. Prewarmed medium was then added to dilute the ligand 40-fold, thereby eliminating its ability to activate receptors, and cells were incubated for up to an additional 30 min at 37°C. Cells were fixed and immunolabeled for phosphorylated STAT5B. ∗, Selected bile canaliculi. Scale bar, 10 μm.
Ethanol selectively impairs Jak2 activation.
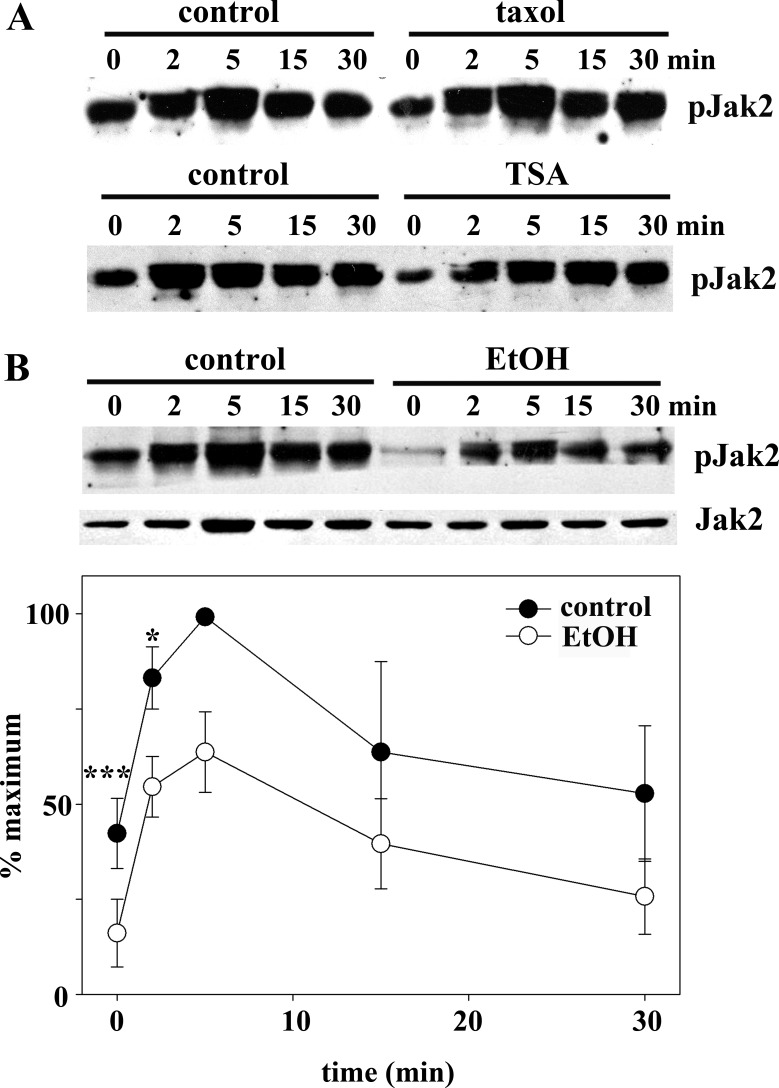
Since STAT5B phosphorylation was selectively impaired by ethanol treatment, we examined whether activation of its upstream tyrosine kinase Jak2 was also selectively impaired by immunoblotting for pJak2. In control, taxol-treated, and TSA-treated cells, pJak2 levels and appearance were nearly identical (Fig. 11A). In all cases, pJak2 was increased after 2 min of GH addition, peaked at 5 min, and began to diminish by 30 min. Importantly, peak Jak2 phosphorylation preceded peak STAT5B phosphorylation (5 min vs. 15 min), consistent with its proposed role in STAT activation. In ethanol-treated cells, much less steady-state pJak2 was observed, and its activation was attenuated at each time point, while total pJak2 levels remained unchanged (Fig. 11B). These results indicate that ethanol selectively impairs Jak2 phosphorylation, which can, in turn, explain impaired STAT5B phosphorylation.
Fig. 11.
Ethanol, but not taxol or TSA, impairs Jak2 phosphorylation after GH addition. A: cells were treated with 20 μM taxol for 2 h (top) or 50 nM TSA for 30 min (bottom). In the continued presence of each agent, cells were incubated with 50 nM GH for up to 30 min. Cell lysates were immunoblotted for phosphorylated Jak2 (pJak2). B: control and ethanol-treated cells were incubated with 50 nM GH for up to 30 min. Cell lysates were immunoblotted for total (bottom) and phosphorylated (top) Jak2. C: immunoreactivity was measured by densitometry and plotted as percentage of maximal phosphorylation. Values are means ± SE from 3 independent experiments. *P ≤ 0.05, ***P ≤ 0.005.
DISCUSSION
From these studies, we have made several major observations. 1) We confirmed that the two proposed models of microtubule-mediated nuclear translocation represented by Smad2/3 (sequestration) and STAT5B and STAT3 (directed delivery) operate in WIB cells. 2) We determined that only the latter mechanism is impaired by ethanol treatment and that the ethanol-induced impairment can be explained by increased microtubule acetylation and stability. 3) We found that the ethanol-induced defect in Jak2 activation and its subsequent activation of STAT5B are independent of microtubule acetylation and stability. 4) We demonstrated that STAT5B nuclear exit, a postulated microtubule-independent process, is not altered in ethanol-treated cells. 5) We showed that nuclear STAT5B activation and nuclear levels were decreased in VL-17A cells and livers from ethanol-fed rats and that expression of EGF-R, a known STAT5B target protein, is decreased, confirming that these results have physiological importance.
Ethanol selectively impairs directed nuclear translocation.
Microtubule depolymerization with nocodazole led to increased Smad2/3 nuclear delivery at steady state and in ligand-treated cells, whereas it impaired STAT5B and STAT3 delivery. This confirms that Smad2/3 is a microtubule sequestered factor, while STATs require microtubules for directed translocation in WIF-B cells. This is also consistent with the slower rate of nuclear appearance of Smad2/3 than of the STATs after ligand addition (30 min for peak nuclear delivery vs. 10–15 min).
We also determined that only STAT translocation was impaired by ethanol exposure and that taxol or TSA addition impaired STAT translocation to remarkably similar extents, suggesting that increased microtubule acetylation and stability can explain the defect. What is responsible for this selective effect? The answer may be related to the differential dependence of the factors on microtubule-based motors for nuclear delivery. Although the microtubule-associated protein (MAP)/motor responsible for Smad2/3 microtubule sequestration is not known, once it is released, it freely diffuses to the nucleus without microtubule assistance. In contrast, STAT5B translocation has been shown to require the minus-end-directed microtubule motor dynein (4). Because dynein has been shown to preferentially bind acetylated microtubules (13), a provocative explanation for our results is that its enhanced microtubule binding impedes microtubule-dependent translocation. From our studies with 4-MP, we further determined that impaired STAT5B nuclear translocation requires ethanol metabolism and is likely mediated by acetaldehyde. Because tubulin and purified hepatic MAPs and motors are known acetaldehyde-adducted proteins (14), we predict that impaired translocation can be alternatively (perhaps, additionally) explained by adduct-induced changes in MAP or motor function.
Ethanol, but not taxol or TSA, impairs STAT5B activation.
We determined that only ethanol exposure impairs STAT5B phosphorylation after GH activation. The kinetics and extent of STAT5B phosphorylation were not changed in taxol- or TSA-treated cells. Although this result is not especially surprising, given that these plasma membrane-located events likely do not require microtubules, it is not fully clear what is responsible for this impairment. In an effort to explain the selectivity of this defect, we examined activation of Jak2, the upstream, STAT5B-activating kinase. We found that only ethanol (not taxol or TSA) exposure led to decreased Jak2 activation. The delayed and decreased Jak2 activation correlates remarkably with the delayed and decreased STAT5B phosphorylation; thus we conclude that decreased pJak2 can explain the decreased STAT5B in our studies.
These results suggest that ethanol impairs GH-mediated signaling in at least two ways, with only translocation being microtubule-dependent. This is consistent with our findings that translocation of control pSTAT5B levels in taxol-treated cells is also impaired. This is also consistent with our observations that STAT5B nuclear exit and dephosphorylation were not changed in ethanol-treated cells, processes thought to be microtubule-independent. The open question is as follows: How does ethanol exposure, in a non-microtubule-mediated fashion, lead to impaired Jak2 activation? Recently, it was shown that the tyrosine phosphatase 1B (PTP1B) responsible for Jak2 dephosphorylation is upregulated in ethanol-treated rat skeletal muscle (9). Thus one intriguing possibility is that, in alcohol-exposed hepatocytes, PTP1B expression is also upregulated, leading to decreased pJak2. Alternatively, critical GH receptor intracellular docking sites or other components of the signaling machinery may be particularly prone to adduction or acetylation, preventing proper signaling complex formation. This is consistent with reports that STAT3 is an acetylated protein (22).
Clinical implications.
High circulating amounts of GH are present in alcoholic patients, yet the hepatoprotective activities of GH are diminished (26). One explanation for this paradox is that the ethanol-induced impairment of STAT5B nuclear translocation alters gene expression required for hepatoprotection. Our results with EGF-R expression levels and reports from the literature are perfectly consistent with this prediction. For example, expression of the known STAT5B target genes EGF-R, SOCS2 (suppressor of cytokine signaling), CYP4A12, and CYP7B1 are decreased in hepatocytes from ethanol-exposed rodents (2, 5, 6). Also, the expression of PPARγ (peroxisome proliferator-activated receptor-γ), a gene shown to be upregulated in STAT5B knockout mice, is enhanced in ethanol-fed animals (3, 11). We further suggest that the ethanol-induced downregulation of numerous genes involved in hepatomitogenesis and hepatoprotection may represent not-yet-identified targets for GH/STAT5B-mediated signaling.
Finally, these studies suggest that modulation of cellular acetylation levels is a unique therapeutic target for the treatment of alcoholic liver disease. The acetylation of numerous proteins is known to be enhanced by ethanol treatment, and this list is expanding (27, 28). Many naturally occurring and synthetic deacetylase agonists are in clinical trials for treatment of human diseases (8). One such drug, resveratrol, has been shown to attenuate fatty liver and oxidative stress in alcohol-exposed mice (1). An exciting possibility is that specific deacetylase agonists or acetyltransferase antagonists will be useful in treating alcoholic liver disease.
GRANTS
This work was supported by National Institute of Alcohol Abuse and Alcoholism Grant R01 AA-17626 (to P. L. Tuma).
DISCLOSURES
No conflicts of interest, financial or otherwise, are declared by the authors.
AUTHOR CONTRIBUTIONS
D.J.F. performed the experiments; D.J.F., D.J.T., and P.L.T. analyzed the data; D.J.F., D.J.T., and P.L.T. interpreted the results of the experiments; D.J.F. and P.L.T. prepared the figures; D.J.F. and P.L.T. drafted the manuscript; D.J.F., D.J.T., and P.L.T. edited and revised the manuscript; D.J.T. and P.L.T. are responsible for conception and design of the research; P.L.T. approved the final version of the manuscript.
ACKNOWLEDGMENTS
We thank the members of the Tuma laboratory for the many helpful comments and suggestions. We especially thank Dr. Blythe Shepard for assistance with the liver fractionation. We also thank Dr. Ann Hubbard for providing the anti-EGF-R antibodies and Dr. Dahn Clemens for providing the VL-17A cells.
REFERENCES
- 1.Ajmo JM, Liang X, Rogers CQ, Pennock B, You M. Resveratrol alleviates alcoholic fatty liver in mice. Am J Physiol Gastrointest Liver Physiol 295: G833–G842, 2008 [DOI] [PMC free article] [PubMed] [Google Scholar]
- 2.Baik M, Yu JH, Hennighausen L. Growth hormone-STAT5 regulation of growth, hepatocellular carcinoma, and liver metabolism. Ann NY Acad Sci 1229: 29–37, 2011 [DOI] [PMC free article] [PubMed] [Google Scholar]
- 3.Bardag-Gorce F, French BA, Dedes J, Li J, French SW. Gene expression patterns of the liver in response to alcohol: in vivo and in vitro models compared. Exp Mol Pathol 80: 241–251, 2006 [DOI] [PubMed] [Google Scholar]
- 4.Campbell EM, Hope TJ. Role of the cytoskeleton in nuclear import. Adv Drug Deliv Rev 55: 761–771, 2003 [DOI] [PubMed] [Google Scholar]
- 5.Deaciuc IV, Doherty DE, Burikhanov R, Lee EY, Stromberg AJ, Peng X, de Villiers WJ. Large-scale gene profiling of the liver in a mouse model of chronic, intragastric ethanol infusion. J Hepatol 40: 219–227, 2004 [DOI] [PubMed] [Google Scholar]
- 6.Deaciuc IV, Peng X, D'Souza NB, Shedlofsky SI, Burikhanov R, Voskresensky IV, de Villiers WJ. Microarray gene analysis of the liver in a rat model of chronic, voluntary alcohol intake. Alcohol 32: 113–127, 2004 [DOI] [PubMed] [Google Scholar]
- 7.Donohue TM, Osna NA, Clemens DL. Recombinant Hep G2 cells that express alcohol dehydrogenase and cytochrome P450 2E1 as a model of ethanol-elicited cytotoxicity. Int J Biochem Cell Biol 38: 92–101, 2006 [DOI] [PubMed] [Google Scholar]
- 8.Elliott PJ, Jirousek M. Sirtuins: novel targets for metabolic disease. Curr Opin Investig Drugs 9: 371–378, 2008 [PubMed] [Google Scholar]
- 9.Gao L, Zhang X, Wang FR, Cao MF, Zhang XJ, Sun NN, Zhang J, Zhao JJ. Chronic ethanol consumption up-regulates protein-tyrosine phosphatase-1B (PTP1B) expression in rat skeletal muscle. Acta Pharmacol Sin 31: 1576–1582, 2010 [DOI] [PMC free article] [PubMed] [Google Scholar]
- 10.Gleason EL, Hogan JC, Stephens JM. Stabilization, not polymerization, of microtubules inhibits the nuclear translocation of STATs in adipocytes. Biochem Biophys Res Commun 325: 716–718, 2004 [DOI] [PubMed] [Google Scholar]
- 11.Hosui A, Hennighausen L. Genomic dissection of the cytokine-controlled STAT5 signaling network in liver. Physiol Genomics 34: 135–143, 2008 [DOI] [PMC free article] [PubMed] [Google Scholar]
- 12.Ihrke G, Neufeld EB, Meads T, Shanks MR, Cassio D, Laurent M, Schroer TA, Pagano RE, Hubbard AL. WIF-B cells: an in vitro model for studies of hepatocyte polarity. J Cell Biol 123: 1761–1775, 1993 [DOI] [PMC free article] [PubMed] [Google Scholar]
- 13.Janke C, Bulinski JC. Post-translational regulation of the microtubule cytoskeleton: mechanisms and functions. Nat Rev Mol Cell Biol 12: 773–786, 2011 [DOI] [PubMed] [Google Scholar]
- 14.Jennett RB, Sorrell MF, Johnson EL, Tuma DJ. Covalent binding of acetaldehyde to tubulin: evidence for preferential binding to the α-chain. Arch Biochem Biophys 256: 10–18, 1987 [DOI] [PubMed] [Google Scholar]
- 15.Joseph RA, Shepard BD, Kannarkat GT, Rutledge TM, Tuma DJ, Tuma PL. Microtubule acetylation and stability may explain alcohol-induced alterations in hepatic protein trafficking. Hepatology 47: 1745–1753, 2008 [DOI] [PMC free article] [PubMed] [Google Scholar]
- 16.Kannarkat GT, Tuma DJ, Tuma PL. Microtubules are more stable and more highly acetylated in ethanol-treated hepatic cells. J Hepatol 44: 963–970, 2006 [DOI] [PubMed] [Google Scholar]
- 17.Lieber CS, DeCarli LM. Liquid diet technique of ethanol administration: 1989 update. Alcohol Alcohol 24: 197–211, 1989 [PubMed] [Google Scholar]
- 18.Lopez-Perez M, Salazar EP. A role for the cytoskeleton in STAT5 activation in MCF7 human breast cancer cells stimulated with EGF. Int J Biochem Cell Biol 38: 1716–1728, 2006 [DOI] [PubMed] [Google Scholar]
- 19.Nyasae LK, Hubbard AL, Tuma PL. Transcytotic efflux from early endosomes is dependent on cholesterol and glycosphingolipids in polarized hepatic cells. Mol Biol Cell 14: 2689–2705, 2003 [DOI] [PMC free article] [PubMed] [Google Scholar]
- 20.Phung-Koskas T, Pilon A, Pous C, Betzina C, Sturm M, Bourguet-Kondracki ML, Durand G, Drechou A. STAT5B-mediated growth hormone signaling is organized by highly dynamic microtubules in hepatic cells. J Biol Chem 280: 1123–1131, 2005 [DOI] [PubMed] [Google Scholar]
- 21.Ramnarayanan SP, Cheng CA, Bastaki M, Tuma PL. Exogenous MAL reroutes selected hepatic apical proteins into the direct pathway in WIF-B cells. Mol Biol Cell 18: 2707–2715, 2007 [DOI] [PMC free article] [PubMed] [Google Scholar]
- 22.Ray S, Boldogh I, Brasier AR. STAT3 NH2-terminal acetylation is activated by the hepatic acute-phase response and required for IL-6 induction of angiotensinogen. Gastroenterology 129: 1616–1632, 2005 [DOI] [PubMed] [Google Scholar]
- 23.Schaffert CS, Todero SL, Casey CA, Thiele GM, Sorrell MF, Tuma DJ. Chronic ethanol treatment impairs Rac and Cdc42 activation in rat hepatocytes. Alcohol Clin Exp Res 30: 1208–1213, 2006 [DOI] [PubMed] [Google Scholar]
- 24.Schaffert CS, Todero SL, McVicker BL, Tuma PL, Sorrell MF, Tuma DJ. WIF-B cells as a model for alcohol-induced hepatocyte injury. Biochem Pharmacol 67: 2167–2174, 2004 [DOI] [PubMed] [Google Scholar]
- 25.Shanks MR, Cassio D, Lecoq O, Hubbard AL. An improved polarized rat hepatoma hybrid cell line. Generation and comparison with its hepatoma relatives and hepatocytes in vivo. J Cell Sci 107: 813–825, 1994 [DOI] [PubMed] [Google Scholar]
- 26.Shepard BD, Fernandez DJ, Tuma PL. Alcohol consumption impairs hepatic protein trafficking: mechanisms and consequences. Genes Nutr 5: 129–140, 2010 [DOI] [PMC free article] [PubMed] [Google Scholar]
- 27.Shepard BD, Tuma DJ, Tuma PL. Chronic ethanol consumption induces global hepatic protein hyperacetylation. Alcohol Clin Exp Res 34: 280–291, 2010 [DOI] [PMC free article] [PubMed] [Google Scholar]
- 28.Shepard BD, Tuma PL. Alcohol-induced protein hyperacetylation: mechanisms and consequences. World J Gastroenterol 15: 1219–1230, 2009 [DOI] [PMC free article] [PubMed] [Google Scholar]


