Abstract
Purpose
Axial burst fractures of the distal tibia are challenging to treat and often lead to restricted function of the lower limb. The purpose of this study was to investigate the clinical outcome and changes in gait pattern in such patients.
Methods
Thirty-five patients in a level 1 trauma centre were followed up clinically and by gait analysis. The American Orthopaedic Foot and Ankle Society (AOFAS), visual analogue scale (VAS) foot and ankle scale and Phillips scores were applied. Dynamic pedography (emed-M; Novel, Germany) with analyses of load, pressure and force-time integral were undertaken to investigate possible changes in gait pattern.
Results
Mean follow-up was 50 (19–100) months. Mean AOFAS, VAS foot and ankle and Phillips scores were 65, 63 and 55 points, respectively. There were clear correlations between fracture severity in the Arbeitsgemeinschaft für Osteosynthesefragen (AO) classification and functional outcome in AOFAS (−0.63; p < 0.01), VAS foot and ankle scale (−0.56; p < 0.01) and Phillips (−0.64; p < 0.01) scores. There was a high correlation of 0.74 (p < 0.01) between the severity of the injury in the AO-classification and onset of post-traumatic arthrosis. Dynamic pedography revealed lesser load bearing for the total foot, medial foot, heel, first metatarsal and medial forefoot for the affected limb, and increased load bearing was seen in the lateral midfoot region.
Conclusions
Fractures of the tibial pilon lead to restricted function of the lower limb. Clinical outcome correlates with fracture severity in the AO classification, the onset of post-traumatic arthrosis and changes in gait patterns.
Introduction
Intra-articular fractures of the distal tibial pilon are commonly caused by axial loading forces with axial rotational forces. Treatment can be challenging, as high-energy patterns and soft-tissue injuries are often associated, and the soft-tissue envelope is limited at the fracture site [1, 2]. Treatment options are mainly open reduction and internal fixation (ORIF) or application of an external fixation device. Currently, a two-staged protocol with primarily external transfixation and later conversion to ORIF is a commonly accepted standard to decrease the risk of soft-tissue complications and infection rates [1, 3–6]. Sufficient stabilisation by the implants must be provided to achieve bony union [5, 7, 8]. The necessity for an anatomical restoration of the articular surface is controversial and does not always correlate with the clinical outcome [9]. Post-traumatic arthrosis of the ankle joint is a long-term problem and can influence clinical outcome [2]. Regarding outcome, most studies focus on complications, such as infection rates, pseudarthrosis or post-traumatic arthrosis, and there is limited data concerning quality of life. To our knowledge, no study has so far investigated possible alterations in walking patterns by pedography. This inspired us to set up a retrospective clinical study to investigate the clinical outcome and possible objective changes in walking patterns.
Patients and methods
The study was approved by the local ethics committee and follows the Declaration of Helsinki for ethical principles for medical research involving humans. All patients who had been treated for a pilon fracture between 2004 and 2010 in our institution were reviewed for inclusion/exclusion criteria. Inclusion criteria were age over 18 years, a unilateral fracture of the tibial pilon as the sole injury and no comorbid psychological or psychiatric conditions (such as depression, attempted suicide, etc.) that might potentially influence the subjective evaluation of the outcome or compliance with pedography. Patients’ full hospital records (e.g. operative protocol, postoperative load-bearing protocol etc.) were checked to assure that the inclusion/exclusion criteria were met.
Patients received verbal and written information about the study and provided written consent. Plain radiographs and computed tomography (CT) scans (where available) were examined according to the Arbeitsgemeinschaft für Osteosynthesefragen (AO) classification system [10]. Medical charts were used to identify operative procedures, length of hospital stay, complications, rehabilitation protocols etc. Physiotherapy was begun immediately after the operation, with lymph drainage, active joint mobilisation and gait training using crutches with partial weight bearing of 20 kg for eight to 12 weeks, depending on fracture type and operative treatment. In addition to a current clinical examination the visual analogue scale (VAS) foot and ankle questionnaire [11], the American Orthopaedic Foot and Ankle Society (AOFAS) questionnaire [12] and the Phillips score [13] were carried out. Radiographs were obtained and analysed for post-traumatic arthrosis using the Kellgren and Lawrence score [14]. Range of motion (ROM) of the upper and lower ankle joint were measured, and the difference from the healthy side was noted. Finally, a dynamic pedography was performed. For pedographic analysis, the affected foot was compared with the uninjured side.
Questionnaires
The VAS foot and ankle outcome score [11] is a 20-part questionnaire that reflects the patient’s subjective perceptions and is completed by patients themselves; 0–100 points (worst–best) are possible. The score reflects the categories of pain (four questions), function (11 questions), and other symptoms (five questions). In the AOFAS ankle–hindfoot scale [12] with nine questions, 0–100 points (worst–best) are achievable. It reflects the categories of pain, function and alignment. This scale is very well validated in outcome measurements after fractures of the ankle region. The score of Phillips et al. [13] consists of subjective and objective measurements. The first half is subjective and includes pain, stability, walking, activity level and sport, walking distance, swelling and weather influences; the second half is objective and includes ankle and subtalar joint ROM, ankle stability, inflammation (synovitis), pressure pain and radiological signs of osteoarthritis; 0–100 points (worst–best) are possible. It was also developed for follow-up examinations after ankle fractures.
Pedography
Dynamic pedography was carried out in an area measuring 1.2 × 8.0 m with an integrated measuring plate (EMED-M, 38 × 42 cm, four sensors per square centimetre, 50 Hz; Novel GmbH., Munich, Germany). Patients were allowed an unlimited number of test walks. At least five accurate measurements per side were carried out, and the average of the values was included in the subsequent analysis. Using software support (novel database essential© vers. 19.3.20, and a newly programmed report for the force-time integral), the foot was divided into ten zones (heel, midfoot, metatarsals 1–5, hallux, second toe, toes 3–5) for pressure, loading, contact time during the roll-over process and force-time integral. Maximum loading, contact time during the roll-over process and force-time integrals were analysed and averaged, and gait axis was depicted.
Statistics
Statistical analysis was carried out using IBM SPSS Statistics (version 17; IBM Deutschland Ltd., Ehningen, Germany). Shapiro–Wilk test showed normal distribution of the cohort. Student’s t test for paired samples for pedographic results, Pearson’s correlation and analysis of variance (ANOVA) were used to determine differences in clinical outcome; 95 % confidence intervals (CI) and standard deviations (SD) were calculated. Significance level was set at 5 % (α = 0.05).
Results
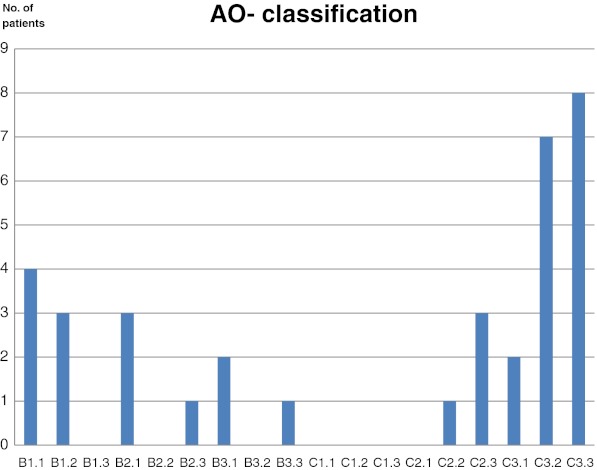
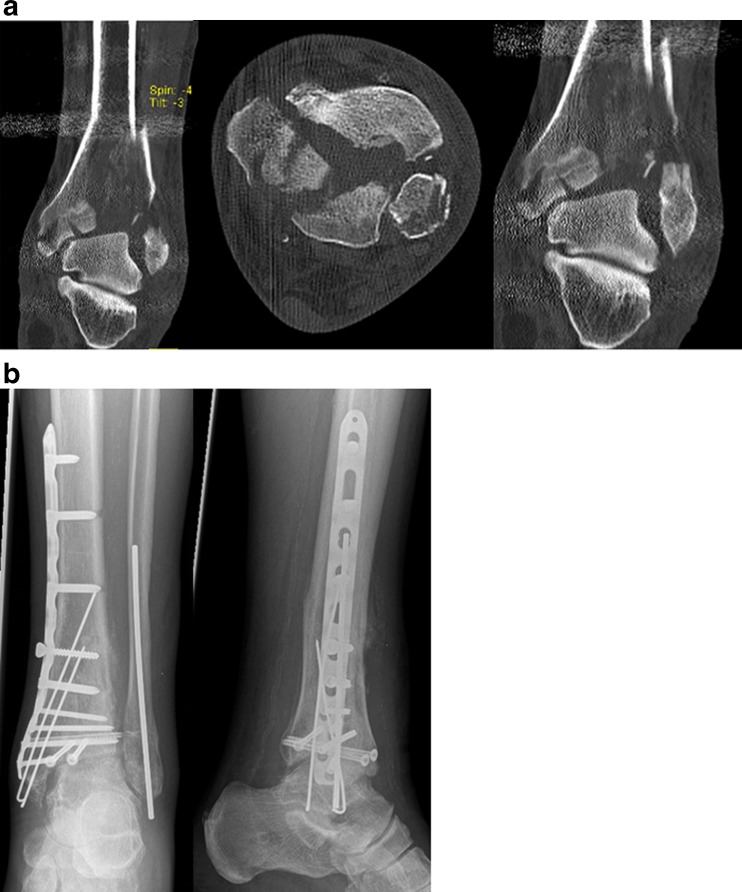
Forty-one patients who met the criteria were invited to enter the study, of whom 35 (follow-up 85 %) were willing to participate. There were 25 men and ten women. Average age was 47.6 (range 18–85) years. The right side was affected 21 times, the left 14 times. Mean follow-up was 50 (19–100) months. Seven fractures had been open (3× II° open, 4× III° open). Distribution of fracture types according to the AO classification [10] is shown in Fig. 1. All patients were treated operatively according to our protocol. In 20 patients, reconstruction was performed by angle-stable plates, 18 of them using a two-staged protocol after immediate external fixation and final reconstruction after soft-tissue recovery (Fig. 2). In ten patients, osteosynthesis was carried out by screws alone. Two patients received external fixation and screws, and in three cases, a combination of an intramedullary nail with additional screws was used. One of these 35 patients had to undergo ankle fusion due to post-traumatic arthrosis at a follow-up of 35 months, and one patient underwent ankle fusion after ten months due to ongoing infection with a large bony defect after a III° open fracture.
Fig. 1.
Distribution of fractures according to the Arbeitsgemeinschaft für Osteosynthesefragen (AO) classification
Fig. 2.
Example of a comminuted tibial pilon fracture treated by open reduction and internal fixation (ORIF) in a two-staged protocol. a Computed tomography (CT) after immediate external transfixation shows severe displacement of the articular surface. b Postoperative radiographs after reconstruction using the minimally invasive plate osteosynthesis (MIPO) technique
Range of motion
Motion of upper and lower ankle joint was restricted on the injured side compared with the healthy side. The injured upper ankle joint showed a lower ROM (extension/flexion) of 36° (±20° SD) vs. 67° (±11° SD) (p < 0.01) compared with the uninjured side. The lower ankle joint also showed a decreased mean ROM (pronation/supination) of 16° (±10° SD) vs. 32° (±10° SD) of the uninjured side (p < 0.01).
Questionnaires
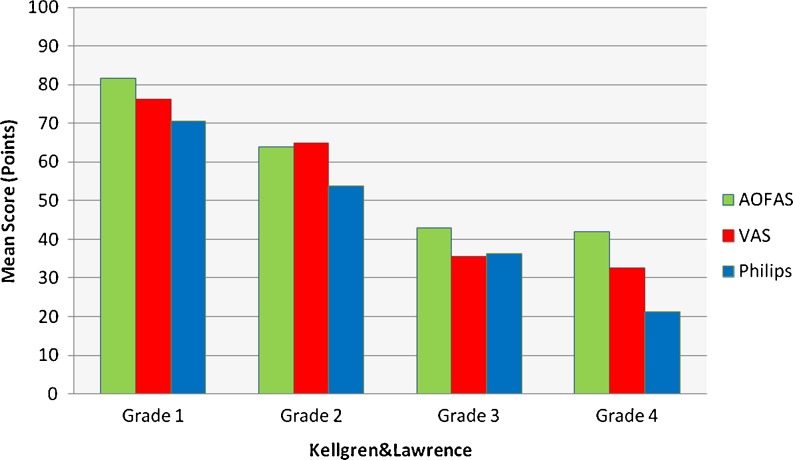
Mean value of the VAS foot and ankle outcome score was 79 points (range 58–98) for type B fractures and 51 (range 23–89) for type C fractures (p < 0.05), with a negative Pearson correlation of −0.56 (p < 0.01) between t VAS score and fracture pattern according to the AO classification; mean value of the AOFAS score was 82 points (range 73–100) for type B fractures and 55 (34–91) for type C fractures (p < 0.05), with a negative Pearson correlation of −0.63 (p < 0.01) between AOFAS score and AO classification; mean value of the Phillips score was 72 points (range 74–90) for type B fractures and 43 (range 14–83) for type C fractures (p < 0.05), with a negative Pearson correlation of −0.64 (p < 0.01) between Phillips score and AO classification (Fig. 3). Overall, mean functional results of all three questionnaires were satisfactory.
Fig. 3.
Correlations between the three different clinical outcome scores and fracture types according to the Arbeitsgemeinschaft für Osteosynthesefragen (AO) classification. There was a correlation of −0.63 (p < 0.01) with the American Orthopaedic Foot and Ankle Society (AOFAS) score, −0.56 (p < 0.01) with the visual analogue scale (VAS) and −0.64 (p < 0.01) with Phillips score and fracture types according to the AO classification
Radiological findings/post-traumatic arthrosis
Current radiographic assessments showed no signs of post-traumatic arthrosis in 15 patients (43 %), mild signs in 11 (31 %), clear signs in five (14 %) and severe signs in four (11 %) in accordance with the Kellgren and Lawrence score [14]. Patients who had undergone ankle fusion were regarded as having severe signs. There was a high correlation of 0.74 (p < 0.01) between injury severity in the AO classification and onset of post-traumatic arthrosis. ANOVA showed decreasing clinical outcome with arthrosis progression (p < 0.05 for all three questionnaires) (Fig. 4).
Fig. 4.
Clinical outcome in the three questionnaires in relation to grade of post-traumatic arthrosis using the Kellgren and Lawrence score. There is a deterioration of outcome with arthrosis progression
Pedography
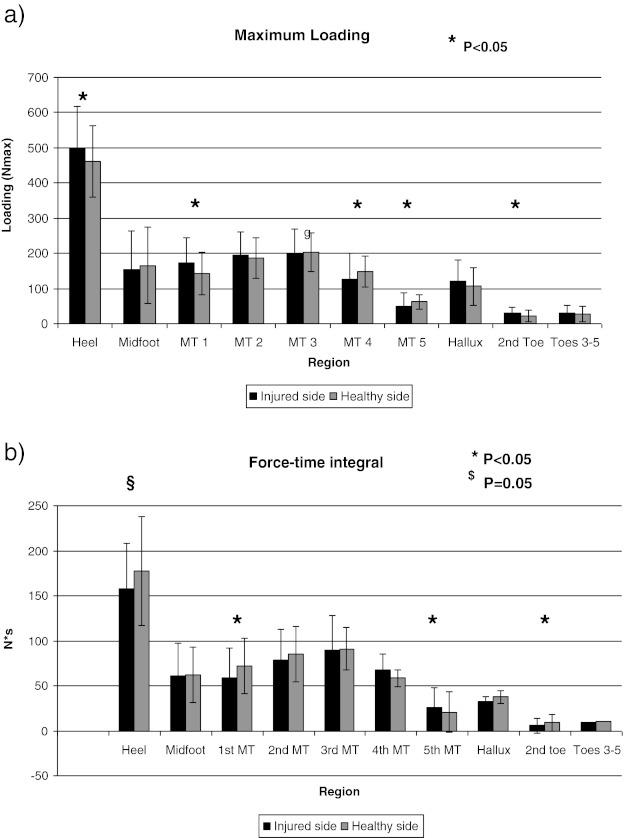
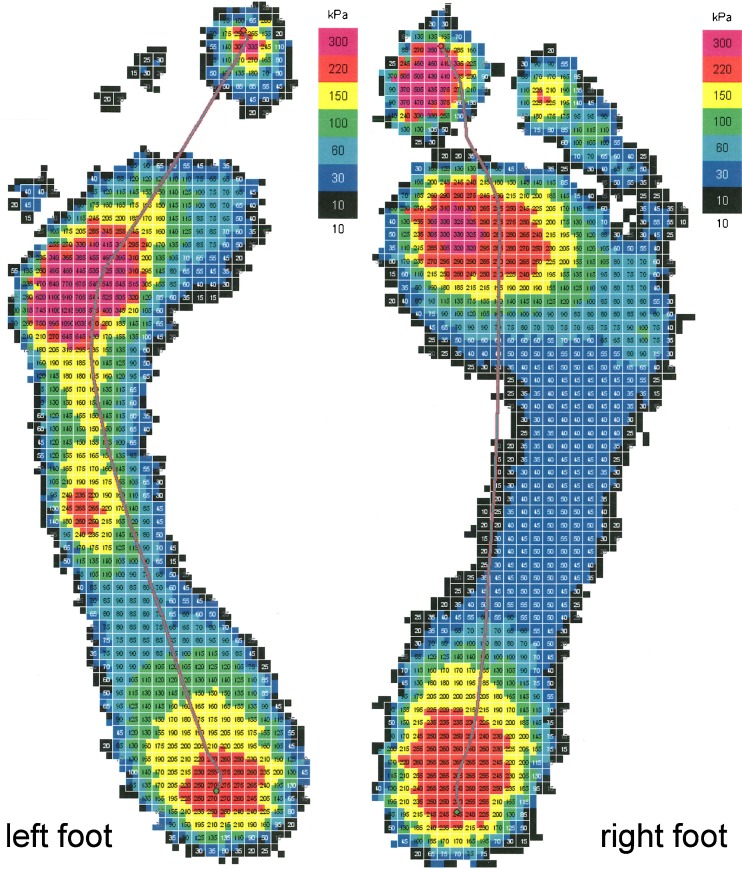
Dynamic pedography revealed a clearly disturbed walking pattern of the injured side. In the heel region, there was less loading (460 ± 118 N vs. 500 ± 102 N; p < 0.05) and a lower force-time integral (157 ± 73 N*s vs. 177 ± 66 N*s; p = 0.052) of the injured limb compared with the healthy side. Under the first metatarsal region, there was also less loading (142 ± 72 N vs. 171 ± 60 N; p < 0.05) and a lower force-time integral (59 ± 36 N*s vs. 72 ± 31 N*s; p < 0.05) of the injured limb compared with the healthy side. In contrast, under the fourth metatarsal, there was higher loading (148 ± 75 N vs. 126 ± 43 N; p < 0.05), than there was under the fifth metatarsal (62 ± 39 N vs. 49 ± 29 N; p < 0.05). There was a higher force-time integral (25 ± 18 N*s vs. 21 ± 9 N*s; p < 0.05) of the injured limb compared with the healthy side (Fig. 5). These results indicate a lateralisation of the gait axis of the injured limb (Fig. 6). Pedographic results correlated with clinical outcomes in the questionnaires (Table 1).
Fig. 5.
Results of dynamic pedobarography. a Maximum loading shows differences under the heel and the first, fourth and fifth metatarsal (MT). b Force-time integral affirms relief under the heel and lateralisation of the gait axis of the injured side
Fig. 6.
Example of a pedography after an open C 3.3 pilon fracture on the left side. Relief under the heel, increased loading under the fourth and fifth metatarsals and lateralisation of the gait line is clearly visible
Table 1.
Correlations of pedographic results
| Correlations | |||
|---|---|---|---|
| Region | Coefficient of correlation loading vs. AOFAS | Coefficient of correlation loading vs. VAS | Coefficient of correlation loading vs. Phillips |
| Correlations between loading and the three different scoring systems | |||
| Heel | −0,088 | −0,085 | −0,029 |
| Midfoot | 0,099 | 0,155 | 0,161 |
| MT 1 | −0,289 | −0,180 | −0,215 |
| MT 2 | −0,334 | −0,274 | −0,157 |
| MT 3 | −0,009 | −0,081 | −0,007 |
| MT 4 | 0,323 | 0,301 | 0,362* |
| MT 5 | 0,366* | 0,318 | 0,432* |
| Hallux | −0,390* | −0,355* | −0,355* |
| Toe 2 | −0,412* | −0,301 | −0,409* |
| Toes 3, 4, 5 | −0,255 | −0,212 | −0,324 |
| Coefficient of correlation FTI vs. AOFAS | Coefficient of correlation FTI vs. VAS | Coefficient of correlation FTI vs. Philips | |
| Correlations between FTI and the three scoring systems | |||
| Heel | −0,099 | −0,189 | −0,184 |
| Midfoot | −0,181 | −0,150 | −0,196 |
| MT1 | −0,371* | −0,297 | −0,279 |
| MT2 | −0,475* | −0,422* | −0,360* |
| MT3 | −0,270 | −0,323 | −0,252 |
| MT4 | 0,203 | 0,193 | 0,251 |
| MT5 | 0,334 | 0,307 | 0,401* |
| Hallux | −0,535* | −0,466* | −0,518* |
| Toe 2 | −0,482* | −0,428* | −0,487* |
| Toes 3, 4, 5 | −0,291 | −0,255 | −0,354* |
AOFAS American Orthopaedic Foot and Ankle Society, FTI force-time integral, VAS visual analogue scale
*p < 0,05
Discussion
Since the publishing of results for low-energy pilon fractures in 1969 by Rüedi and Allgöwer [15], operative treatment of these fractures with the four key principles (restoration of length and axis, anatomical reconstruction of the joint surface, filling of the defect and support of the medial column) have been a common standard. Nowadays, these principles are debated. Today, high-velocity injuries with severely compromised soft tissues are observed more frequently, which preclude the ORIF technique using the extensive approaches described by Rüedi and Allgöwer. Anatomically preshaped plate implants with angle-stable screws acting as an internal fixator using a minimally invasive technique (MIPO) have been developed and were supposed to deliver a crucial benefit for soft tissues, whereas formerly, surgeons were concerned about opening “Pandora’s box” postoperatively when using excessive surgical approaches in the presence of severe soft-tissue injuries. The need for additional bone grafting may be reduced with MIPO, as there is no classic compression osteosynthesis and the rigidity of the new implants is higher. However, so far those positive results have not been published in the literature, and complication rates, infections and the onset of osteomyelitis remain at high levels, (up to 23 %, as shown in the literature) and the quality of joint reduction and varus/valgus alignment is more demanding and difficult [16, 17]. Marsh et al. proposed that the correct alignment seems to be more important than an absolute anatomical reconstruction of the joint surface [9]. In our series, in four patients (11 %) problems with primary wound healing occurred, three of these (8.6 %) were associated with superficial infection and one leading to osteomyelitis (3 %). In two cases (5.7 %; one each), a varus/valgus malalignment of over 5° occurred.
A common problem in the long-term outcome is the development of post-traumatic arthrosis and thus limited function of the injured limb. In our collective, there were moderate or clear signs of post-traumatic osteoarthrosis in 25 % of patients. Other authors describe rates of 10–55 % [2, 18], with a correlation between fracture severity arthrosis onset. We also found a very high correlation between fracture severity (using the AO classification) and arthrosis development (0.74; p < 0.01). This correlation was also reflected in the functional outcome in the questionnaires. An average of 65.2 points in the AOFAS score, 54.6 in the Phillips score and 62.5 in the VAS foot and ankle outcome score was seen. These are overall satisfactory results. Ketz et al. found an average of 76.4 and 85.2 points in the AOFAS score in their groups of type C2 and C3 fractures, respectively, after plate osteosynthesis using different approaches; Kiene et al. described a mean AOFAS score of 81 points after a combination of external fixation and lag screws [19, 20].
Our study has some limitations: It was a retrospective single-centre study, and different fracture patterns were treated using different stabilisation techniques, including angular stable plates and external fixators as required. It is known that fracture patterns according to the AO classification are correlated with clinical and functional outcomes [21, 22] and therefore may lead to a bias in the pedographic results. Furthermore, conclusions from such a small cohort, of 35 patients, must be considered with caution. However, fractures of the tibial pilon represent less than 10 % of all tibial fractures [23], and studies with a large cohort are rare.
Whereas alterations in walking patterns are described in calcanea1 fractures, end-stage osteoarthrosis of the ankle and tibiotalar fusion, our study provides information on gait analysis after pilon fractures. Horisberger et al. found a decreased maximum force and contact area in the entire osteoarthritic foot and a decreased peak pressure in the hindfoot and toes in patients with end-stage osteoarthrosis of the ankle [24]. Similar changes were found in patients after intra-articular fractures of the calcaneus. In these patients, pressure reduction of the hindfoot with compensatory increase in pressure in the midfoot and lateral forefoot region with a lateralisation of the gait axis is described [25]. These changes also occurred in our patients and were additionally confirmed by calculations of the force-time integral. A possible explanation could be the reduced mobility of the hind foot, which is an associated feature in all of these patients. However, whether this is the only reason for the altered walking patterns or whether different operative treatments have an influence cannot be verified by our data and remain open to further investigation.
Conclusions
Fractures of the tibial pilon lead to restricted motion in the upper and lower ankle joint. Clinical outcome according to different questionnaires (VAS, Phillips, AOFAS scores) and onset of post-traumatic arthrosis correlate with fracture severity in the AO classification. Changes in gait patterns with lateralisation of the gait axis can be shown and are correlated with clinical outcome. Further pedographic studies with a focus on different treatment options are desirable.
Acknowledgements
The authors are grateful to Dr. Sabine Karl of the Institute of Mathematics at the University of Wuerzburg for her help and advice on statistics.
Conflict of interest statement
The study was conducted in compliance with the current laws applying in Germany. None of the authors has any conflicts of interest.
References
- 1.Bacon S, Smith WR, Morgan SJ, Hasenboehler E, Philips G, Williams A, Ziran BH, Stahel PF. A retrospective analysis of comminuted intra-articular fractures of the tibial plafond: Open reduction and internal fixation versus external Ilizarov fixation. Injury. 2008;39(2):196–202. doi: 10.1016/j.injury.2007.09.003. [DOI] [PubMed] [Google Scholar]
- 2.Conroy J, Agarwal M, Giannoudis PV, Matthews SJ. Early internal fixation and soft tissue cover of severe open tibial pilon fractures. Int Orthop. 2003;27(6):343–347. doi: 10.1007/s00264-003-0486-1. [DOI] [PMC free article] [PubMed] [Google Scholar]
- 3.Blauth M, Bastian L, Krettek C, Knop C, Evans S. Surgical options for the treatment of severe tibial pilon fractures: a study of three techniques. J Orthop Trauma. 2001;15(3):153–160. doi: 10.1097/00005131-200103000-00002. [DOI] [PubMed] [Google Scholar]
- 4.Patterson MJ, Cole JD. Two-staged delayed open reduction and internal fixation of severe pilon fractures. J Orthop Trauma. 1999;13(2):85–91. doi: 10.1097/00005131-199902000-00003. [DOI] [PubMed] [Google Scholar]
- 5.Sirkin M, Sanders R, DiPasquale T, Herscovici D., Jr A staged protocol for soft tissue management in the treatment of complex pilon fractures. J Orthop Trauma. 2004;18(8 Suppl):S32–S38. doi: 10.1097/00005131-200409001-00005. [DOI] [PubMed] [Google Scholar]
- 6.Tong D, Ji F, Zhang H, Ding W, Wang Y, Cheng P, Liu H, Cai X. Two-stage procedure protocol for minimally invasive plate osteosynthesis technique in the treatment of the complex pilon fracture. Int Orthop. 2012;36(4):833–837. doi: 10.1007/s00264-011-1434-0. [DOI] [PMC free article] [PubMed] [Google Scholar]
- 7.Pollak AN, McCarthy ML, Bess RS, Agel J, Swiontkowski MF. Outcomes after treatment of high-energy tibial plafond fractures. J Bone Joint Surg Am. 2003;85-A(10):1893–1900. doi: 10.2106/00004623-200310000-00005. [DOI] [PubMed] [Google Scholar]
- 8.Topliss CJ, Jackson M, Atkins RM. Anatomy of pilon fractures of the distal tibia. J Bone Joint Surg Br. 2005;87(5):692–697. doi: 10.1302/0301-620X.87B5.15982. [DOI] [PubMed] [Google Scholar]
- 9.Marsh JL, Weigel DP, Dirschl DR. Tibial plafond fractures. How do these ankles function over time? J Bone Joint Surg Am. 2003;85-A(2):287–295. [PubMed] [Google Scholar]
- 10.Muller ME NS, Koch P, Schatzker J (1990) The comprehensive classification of fractures of long bones
- 11.Richter MZS, Geerling J, Frink M, Knobloch K, Krettek C. A new foot and ankle outcome score: Questionnaire based, subjective, Visual-Analogue-Scale, validated and computerized. Foot Ankle Surg. 2006;12:191–199. doi: 10.1016/j.fas.2006.04.001. [DOI] [Google Scholar]
- 12.Kitaoka HB, Alexander IJ, Adelaar RS, Nunley JA, Myerson MS, Sanders M. Clinical rating systems for the ankle-hindfoot, midfoot, hallux, and lesser toes. Foot Ankle Int. 1994;15(7):349–353. doi: 10.1177/107110079401500701. [DOI] [PubMed] [Google Scholar]
- 13.Phillips WA, Schwartz HS, Keller CS, Woodward HR, Rudd WS, Spiegel PG, Laros GS. A prospective, randomized study of the management of severe ankle fractures. J Bone Joint Surg Am. 1985;67(1):67–78. [PubMed] [Google Scholar]
- 14.Kellgren JH, Lawrence JS. Radiological assessment of osteo-arthrosis. Ann Rheum Dis. 1957;16(4):494–502. doi: 10.1136/ard.16.4.494. [DOI] [PMC free article] [PubMed] [Google Scholar]
- 15.Rüedi TPAM. Fractures of the lower end of the tibia into the ankle joint. Injury. 1969;2:92–99. doi: 10.1016/S0020-1383(69)80066-5. [DOI] [Google Scholar]
- 16.Joveniaux P, Ohl X, Harisboure A, Berrichi A, Labatut L, Simon P, Mainard D, Vix N, Dehoux E. Distal tibia fractures: management and complications of 101 cases. Int Orthop. 2010;34(4):583–588. doi: 10.1007/s00264-009-0832-z. [DOI] [PMC free article] [PubMed] [Google Scholar]
- 17.Lau TW, Leung F, Chan CF, Chow SP. Wound complication of minimally invasive plate osteosynthesis in distal tibia fractures. Int Orthop. 2008;32(5):697–703. doi: 10.1007/s00264-007-0384-z. [DOI] [PMC free article] [PubMed] [Google Scholar]
- 18.Chen SH, Wu PH, Lee YS. Long-term results of pilon fractures. Arch Orthop Trauma Surg. 2007;127(1):55–60. doi: 10.1007/s00402-006-0225-3. [DOI] [PubMed] [Google Scholar]
- 19.Ketz J, Sanders R. Staged posterior tibial plating for the treatment of Orthopaedic Trauma Association 43C2 and 43C3 tibial pilon fractures. J Orthop Trauma. 2012;26(6):341–347. doi: 10.1097/BOT.0b013e318225881a. [DOI] [PubMed] [Google Scholar]
- 20.Kiene J, Herzog J, Jurgens C, Paech A. Multifragmentary tibial pilon fractures: midterm results after osteosynthesis with external fixation and multiple lag screws. Open Orthop J. 2012;6:419–423. doi: 10.2174/1874325001206010419. [DOI] [PMC free article] [PubMed] [Google Scholar]
- 21.Leung F, Kwok HY, Pun TS, Chow SP. Limited open reduction and Ilizarov external fixation in the treatment of distal tibial fractures. Injury. 2004;35(3):278–283. doi: 10.1016/S0020-1383(03)00172-4. [DOI] [PubMed] [Google Scholar]
- 22.Teeny SM, Wiss DA. Open reduction and internal fixation of tibial plafond fractures. Variables contributing to poor results and complications. Clin Orthop Relat Res. 1993;292:108–117. [PubMed] [Google Scholar]
- 23.Egol KA, Wolinsky P, Koval KJ. Open reduction and internal fixation of tibial pilon fractures. Foot Ankle Clin. 2000;5(4):873–885. [PubMed] [Google Scholar]
- 24.Horisberger M, Hintermann B, Valderrabano V. Alterations of plantar pressure distribution in posttraumatic end-stage ankle osteoarthritis. Clin Biomech (Bristol, Avon) 2009;24(3):303–307. doi: 10.1016/j.clinbiomech.2008.12.005. [DOI] [PubMed] [Google Scholar]
- 25.Hirschmuller A, Konstantinidis L, Baur H, Muller S, Mehlhorn A, Kontermann J, Grosse U, Sudkamp NP, Helwig P. Do changes in dynamic plantar pressure distribution, strength capacity and postural control after intra-articular calcaneal fracture correlate with clinical and radiological outcome? Injury. 2011;42(10):1135–1143. doi: 10.1016/j.injury.2010.09.040. [DOI] [PubMed] [Google Scholar]


