Abstract
A wealth of experimental data has verified the applicability of the Gouy-Chapman (GC) theory to charged lipid membranes. Surprisingly a validation of GC by molecular dynamics (MD) simulations has been elusive. Here we report a test of GC against extensive MD simulations of an anionic lipid bilayer solvated by water at different concentrations of NaCl. We demonstrate that the ion distributions from the simulations agree remarkably well with GC predictions when information on the adsorption of Na+ ions to the bilayer is incorporated.
Lipid membranes of cells provide both protective barriers and locations for cellular functions. Charged membranes in particular are important for a variety of biological processes such as selective adsorption of proteins [1] and conduction and selectivity of ions across transmembrane protein channels [2–5]. The predictions of the Gouy-Chapman (GC) theory [6, 7] for the electrostatic potentials and ion distributions near charged membranes have been verified by a wide range of experimental data over several decades [2–5, 8–10]. In recent years charged membranes have also been studied by molecular dynamics (MD) simulations [11–24]. It is natural to expect these simulations would provide a valuable testing ground of the GC theory. However, previous simulations of charged membranes with 1:1 salts have found either poor agreement between the GC theory and MD results [13, 22] or agreement in the presence of only the counterion without excess salt [17]. Given the wide use of the GC theory in analyzing experimental data and as the basis for continuum models of membrane systems [25, 26], we decided to take a fresh examination of the applicability and practical implementation through MD simulations of membranes composed of an anionic lipid, dioleoyl phosphatidylglycerol (DOPG), in the presence of NaCl. The simulations were designed to minimize pitfalls from insufficient amounts of solvent in the simulations systems and insufficient sampling. We found excellent agreement between the simulation results and GC theory when structural information from the simulations is incorporated.
Our MD simulations were performed using the GROMACS package [27]. The simulation systems contained a bilayer of 128 DOPG molecules and various numbers of SPC [28] water molecules and Na+ and Cl− ions (see below) in a periodic box. The systems were simulated in the NPγT ensemble with 1 bar of pressure and zero surface tension. Constant temperature was achieved by the Nose-Hoover algorithm [29, 30] with a 1 ps coupling time. Lipid headgroups and fatty acyl chains and solvent (water and ions) were coupled to separate heat baths. Constant pressure was achieved by the Parrinello-Rahman algorithm [31] with a 1 ps coupling time. The force field parameters of DOPG were based on Berger et al. [32], with those for the glycerol group taken from Elmore [20]. Water molecules were maintained rigid by the SETTLE algorithm [33]; all lipid bonds involving hydrogen atoms were constrained by the LINCS algorithm [34], with the masses of these hydrogens artificially quadrupled. These treatments allowed for an MD time step of 4 fs. The particle mesh Ewald method [35, 36] with a 16 Å real space cutoff was used to treat long-range electrostatic interactions. Lennard-Jones potentials were switched off smoothly between 12 and 14 Å. The list of nonbonded interactions, calculated with a 16 Å cutoff, was updated every 10 steps.
In one simulation system, the solvent consisted of 13664 SPC water molecules, 160 Na+ ions, and 32 Cl− ions (leaving the whole system at a zero net charge). The number of water molecules was more than 4-fold higher than found in typical membrane simulations (~ 25 water molecules per lipid). This system, referred to as 32Cl, was prepared by starting from a small bilayer system with 8 DOPG lipids solvated with 3416 SPC water molecules, 10 Na+, and 2 Cl− ions. After equilibration for 1 ns at 350 K, three copies of the initial system were translated within the x–y plane to quadruple the system size. After a 21-ns equilibration at 350 K, the system was again quadrupled to reach the final system size. To speed up equilibration, simulations were carried out at 350 K for the first 20 ns, and then the temperature was switched to 300 K for the remainder of a total 120 ns of simulation time. The last 60 ns (from 60 to 120 ns) were used for analyses.
Two other systems with different solvent compositions were prepared from the snapshot at 80 ns of the 32Cl system. In one, the number of Cl− ions was reduced by half to 16; the same number of Na+ ions were also removed to maintain a zero net charge. In the other, the number of Cl− ions was doubled to 64; the same number of Na+ ions were also added to maintain a zero net charge. The 64 additional ions were accommodated by displacing the same number of randomly selected water molecules. Simulations of these two systems, referred to as 16Cl and 64Cl, were carried out at 300 K for 60 ns, with snapshots after the first 20 ns saved for analyses. Snapshots for all the three systems were saved at an interval of 10 ps. The dimensions of the periodic boxes in the saved snapshots of all the three systems were ~56.6 Å × 56.6 Å × 175 Å. Correspondingly the surface area per lipid, A, was ~50 Å2.
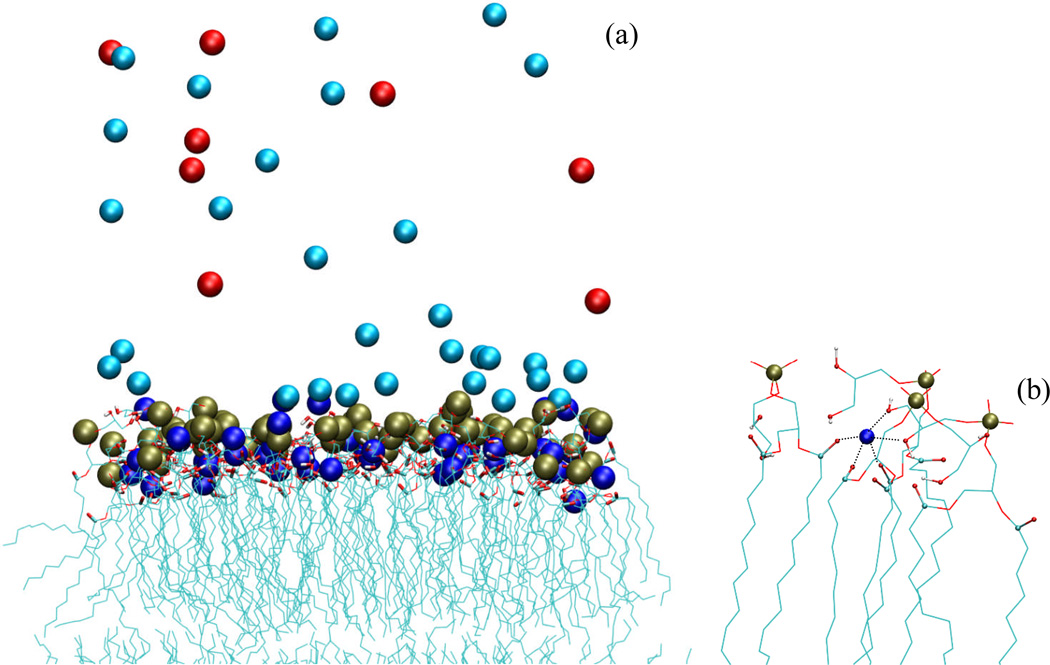
Figure 1a displays the ion distributions in a snapshot of the 32Cl system. A sub-population of Na+ penetrates into the membrane, forming favorable interactions with carbonyl and hydroxyl groups of the lipids (see Fig. 1b). Such interactions have been seen in previous simulations of neutral [37–39], anionic [16], and mixed neutral/cationic lipid bilayers [17]. Just outside the membrane there is an excess of Na+, with the density decreasing as the distance from the membrane surface increases. In contrast, the density of Cl− increases with increasing distance from the membrane surface.
FIG. 1.
Ion distributions around the charged DOPG bilayer. (a) A snapshot of the 32Cl system at 79 ns of the MD simulations. Lipids are displayed with carbonyl and hydroxyl groups highlighted with thick bonds and phosphorus atoms as gold spheres. Adsorbed and diffuse Na+ ions are displayed as blue and cyan spheres, respectively, and Cl− are displayed as red spheres. The lower leaflet is only partially shown. (b) A close-up view of the interactions around a Na+ ion penetrated into the bilayer Favorable interactions with three carbonyls and two hydroxyls are indicated by dotted lines.
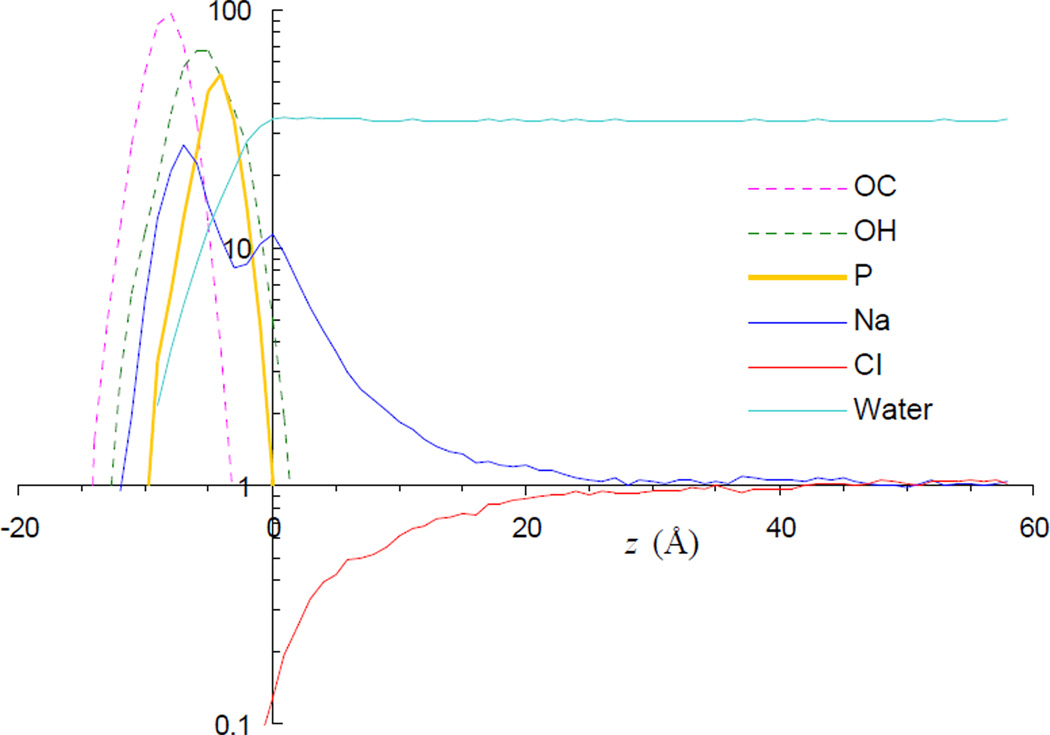
The density profiles of Na+, Cl−, and water as well as the carbonyl oxygens, hydroxyl oxygens, and phosphorus atoms of the lipids are shown in Fig. 2 for the 32Cl system. Around the membrane-water interface, the density profile of Na+ exhibits two peaks (which were also observed in a previous simulation of an anionic lipid bilayer [16]). The inner peak corresponds to Na+ ions penetrated into the membrane, and not unexpectedly is located between the most probable positions of the carbonyl and hydroxyl oxygens of the lipids. The outer peak occurs at precisely the location where the density of water molecules reaches the bulk value. We take this location as the origin of the z axis. The dip between the two peaks of the Na+ density profile probably arises partly due to steric hindrance from the phosphate groups. The densities of both Na+ and Cl− reach the bulk value long before the midpoint (at z ~ 59 Å) between the opposing leaflets of the simulation system and its adjacent periodic image, indicating that interference from periodic images is negligible. The bulk concentrations of the ions are 90, 160, and 310 mM, respectively, for the 16Cl, 32Cl, and 64Cl systems.
FIG. 2.
Average density profiles of lipid and solvent atoms of the 32Cl system. All densities, obtained in bins with a 1-Å width, are normalized by the bulk concentration of the ions, which is 163 mM, except for the density of water (calculated using the oxygen atom), which is scaled down by an additional factor of 10. The origin of the z axis is chosen to coincide with the outer density peak of Na+.
The ion distributions from the MD simulations appear to be in qualitative agreement with the GC theory. To make a quantitative comparison, we take z = 0, where the outer peak of the Na+ density profile is located, as the dividing surface between an “adsorbed” population and the diffuse population. The number of adsorbed Na+ ions thus obtained is within 46.4 ± 0.2 per leaflet for each of the three simulation systems (it should be noted that ~3/4 of this population is comprised of Na+ ions penetrated into the bilayer, as illustrated in Fig. 1b; the remaining ~1/4 interacts only weakly with the phosphate or hydroxyl groups of the lipids, but strongly with multiple structured water molecules). The near constancy of adsorbed Na+ ions, despite a nearly 4-fold difference in bulk concentration, is a manifestation of the so-called contact value theorem, which provides an important clue to the success of the GC theory [40]. The adsorbed Na+ ions reduce the surface charge density by 72.5%, or equivalently, by a factor α = 0.275. The net charge density σ is −0.275e/50 Å2.
The GC theory predicts the Na+ and Cl− densities as
| (1) |
where nb is the bulk ion concentration, κ = (8πnbe2/εkBT)1/2 is the Debye-Hückel screening parameter (with ε denoting the dielectric constant of water and kBT thermal energy), and Φs is the scaled electrostatic potential at z = 0. The last quantity is given by
| (2) |
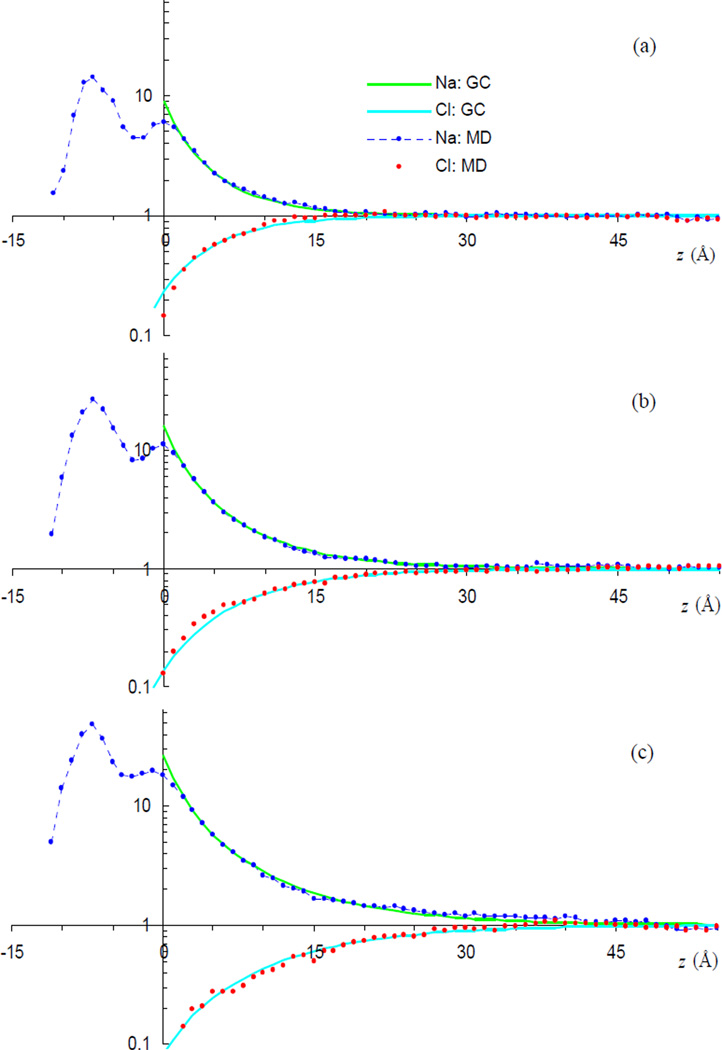
Figure 3 shows the direct comparison between the ion density profiles from the MD simulations and the GC predictions. For the counter-ion, the predictions do not involve any adjustable parameters. For the co-ion, the predicted are shifted toward the bilayer by 2 Å; no other adjustment is made. The 2-Å shift in z for Cl− is probably a manifestation of effects such as ion correlation not accounted for in the GC theory. For all the three simulation systems, the agreement between simulation and theory is remarkable. This agreement, not seen in previous simulations [13, 22], perhaps can be partly attributed to the large amounts of solvent included and exhaustive sampling in our simulations. Comparing the ion distributions among the three systems studied here, the decrease in decay length with increasing bulk ion concentration can be clearly seen.
FIG. 3.
Comparisons of MD results for Na+ and Cl− distributions with GC predictions. Panels (a) – (c) displays data for the 64Cl, 32Cl, and 16Cl systems, respectively. For each system, the ion densities are normalized by the bulk concentrations.
The values of the Na+ density at z = 0 for the 64Cl, 32Cl, and 16Cl systems are 2.8, 2.6, and 2.4 M, respectively, as calculated by Eq. (1). If we assume that the adsorption of Na+ to the membrane follows a Langmuir binding isotherm [41], then the reduction in surface charge density due to adsorption is given by
| (3) |
where Ka is the association constant. Our simulation results are consistent with a value of Ka ~ 1 M−1. Interestingly this value is also what is estimated in many experiments [8, 10].
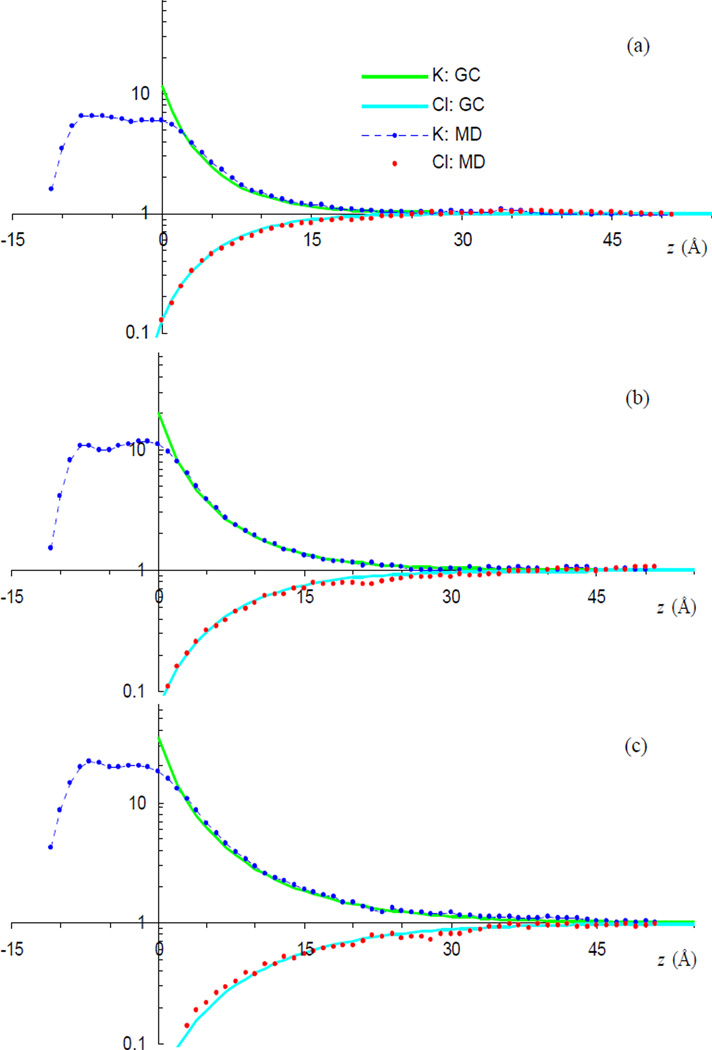
We also extended the interrogation of the GC theory to a different salt, KCl. Again the ion density profiles from the simulations are found to agree well with the GC theory (Fig. 4). There are two notable differences from the NaCl simulations. First, the number of adsorbed K+ ions is significantly less than the Na+ counterpart, and corresponds to an association constant of 0.5 M−1. The decrease in Ka on going from Na+ to K+ is qualitatively consistent with experimental observation [42]. Second, the inward shift in z for Cl− is reduced to 0.8 Å from the 2-Å value found in the NaCl simulations. Both of these differences can be attributed to the larger size of K+ relative to Na+.
FIG. 4.
Comparisons of MD results for K+ and Cl− distributions with GC predictions. Data in panels (a) – (c) are similar to the counterparts in Fig. 3, but with K+ replacing Na+. MD results were calculated on the last 40 ns of 70-ns trajectories.
In summary, our MD simulations of a charged membrane are found to be in good agreement with the GC theory when information on the adsorption of Na+ ions to the bilayer is incorporated. This work thus provides a possibility to learn when and how the GC theory can be used to model membrane systems and to analyze experimental data. Experimental probes of membranes are approaching resolutions at the atomic level [10, 43]. It is expected that combination of such studies and atomistic simulations like those reported here will lead to high-resolution delineation of membrane structures.
Acknowledgments
This work was supported in part by Grant GM058187 from the National Institutes of Health.
REFERENCES
- 1.Murray D, et al. Biophys. J. 1999;77:3176. doi: 10.1016/S0006-3495(99)77148-1. [DOI] [PMC free article] [PubMed] [Google Scholar]
- 2.McLaughlin SG, et al. Proc. Natl. Acad. Sci. USA. 1970;67:1268. doi: 10.1073/pnas.67.3.1268. [DOI] [PMC free article] [PubMed] [Google Scholar]
- 3.Bell JE, Miller C. Biophys. J. 1984;45:279. doi: 10.1016/S0006-3495(84)84154-5. [DOI] [PMC free article] [PubMed] [Google Scholar]
- 4.Raymond L, Slatin SL, Finkelstein A. J. Membr. Biol. 1985;84:173. doi: 10.1007/BF01872215. [DOI] [PubMed] [Google Scholar]
- 5.Rostovtseva TK, et al. Biophys. J. 1998;75:1783. doi: 10.1016/S0006-3495(98)77620-9. [DOI] [PMC free article] [PubMed] [Google Scholar]
- 6.Gouy M. J. Phys. Théor. Appl. 1910;9:457. [Google Scholar]
- 7.Chapman DL. Phil. Mag. 1913;25:475. [Google Scholar]
- 8.McLaughlin S. Annu. Rev. Biophys. Biophys. Chem. 1989;18:113. doi: 10.1146/annurev.bb.18.060189.000553. [DOI] [PubMed] [Google Scholar]
- 9.Zakharov SD, et al. Proc. Natl. Acad. Sci. USA. 2002;99:8654. doi: 10.1073/pnas.122613099. [DOI] [PMC free article] [PubMed] [Google Scholar]
- 10.Yang Y, Mayer KM, Hafner JH. Biophys. J. 2007;92:1966. doi: 10.1529/biophysj.106.093328. [DOI] [PMC free article] [PubMed] [Google Scholar]
- 11.Cascales JJL, et al. J. Chem. Phys. 1996;104:2713. [Google Scholar]
- 12.Pandit SA, Berkowitz ML. Biophys. J. 2002;82:1818. doi: 10.1016/S0006-3495(02)75532-X. [DOI] [PMC free article] [PubMed] [Google Scholar]
- 13.Pandit SA, Bostick D, Berkowitz ML. Biophys. J. 2003;85:3120. doi: 10.1016/S0006-3495(03)74730-4. [DOI] [PMC free article] [PubMed] [Google Scholar]
- 14.Balali-Mood K, Harroun TA, Bradshaw JP. Eur. Phys. J. E. 2003;12:S135. doi: 10.1140/epjed/e2003-01-031-3. [DOI] [PubMed] [Google Scholar]
- 15.Rog T, Murzyn K, Pasenkiewicz-Gierula M. Acta Biochim. Pol. 2003;50:789. [PubMed] [Google Scholar]
- 16.Mukhopadhyay P, Monticelli L, Tieleman DP. Biophys. J. 2004;86:1601. doi: 10.1016/S0006-3495(04)74227-7. [DOI] [PMC free article] [PubMed] [Google Scholar]
- 17.Gurtovenko AA, et al. J. Phys. Chem. B. 2005;109:21126. doi: 10.1021/jp053667m. [DOI] [PubMed] [Google Scholar]
- 18.Bhide SY, Berkowitz ML. J. Chem. Phys. 2005;123:224702. doi: 10.1063/1.2132277. [DOI] [PubMed] [Google Scholar]
- 19.Polyansky AA, et al. J. Phys. Chem. B. 2005;109:15052. doi: 10.1021/jp0510185. [DOI] [PubMed] [Google Scholar]
- 20.Elmore DE. FEBS Lett. 2006;580:144. doi: 10.1016/j.febslet.2005.11.064. [DOI] [PubMed] [Google Scholar]
- 21.Pedersen UR, et al. Biochim. Biophys. Acta. 2006;1758:573. doi: 10.1016/j.bbamem.2006.03.035. [DOI] [PubMed] [Google Scholar]
- 22.Carneiro FA, et al. Eur. Biophys. J. 2006;35:145. doi: 10.1007/s00249-005-0012-z. [DOI] [PubMed] [Google Scholar]
- 23.Zhao W, et al. Biophys. J. 2007;92:1114. doi: 10.1529/biophysj.106.086272. [DOI] [PMC free article] [PubMed] [Google Scholar]
- 24.Bhide SY, Zhang Z, Berkowitz ML. Biophys. J. 2007;92:1284. doi: 10.1529/biophysj.106.096214. [DOI] [PMC free article] [PubMed] [Google Scholar]
- 25.Shental-Bechor D, Haliloglu T, Ben-Tal N. Biophys J. 2007;93:1858. doi: 10.1529/biophysj.106.103812. [DOI] [PMC free article] [PubMed] [Google Scholar]
- 26.Nymeyer H, Zhou H-X. Biophys J. 2008;94:1185. doi: 10.1529/biophysj.107.117770. [DOI] [PMC free article] [PubMed] [Google Scholar]
- 27.Van der Spoel D, et al. J. Comput. Chem. 2005;26:1701. doi: 10.1002/jcc.20291. [DOI] [PubMed] [Google Scholar]
- 28.Berendsen HJC, et al. In: Intermolecular Forces. Pullman B, editor. Dordrecht, the Netherlands: D. Reidel Publishing; 1981. p. 331. [Google Scholar]
- 29.Nose S. Mol. Phys. 1984;52:255. [Google Scholar]
- 30.Hoover WG. Phys. Rev. A. 1985;31:1695. doi: 10.1103/physreva.31.1695. [DOI] [PubMed] [Google Scholar]
- 31.Parrinello M, Rahman A. J. Appl. Phys. 1981;52:7182. [Google Scholar]
- 32.Berger O, Edholm O, Jahnig F. Biophys. J. 1997;72:2002. doi: 10.1016/S0006-3495(97)78845-3. [DOI] [PMC free article] [PubMed] [Google Scholar]
- 33.Miyamoto S, Kollman PA. J. Comput. Chem. 1992;13:952. [Google Scholar]
- 34.Hess B, et al. J. Comput. Chem. 1997;18:1463. [Google Scholar]
- 35.Darden T, York D, Pedersen L. J. Chem. Phys. 1993;98:10089. [Google Scholar]
- 36.Essmann U, et al. J. Chem. Phys. 1995;103:8577. [Google Scholar]
- 37.Pandit SA, Bostick D, Berkowitz ML. Biophys J. 2003;84:3743. doi: 10.1016/S0006-3495(03)75102-9. [DOI] [PMC free article] [PubMed] [Google Scholar]
- 38.Bockmann RA, et al. Biophys J. 2003;85:1647. doi: 10.1016/S0006-3495(03)74594-9. [DOI] [PMC free article] [PubMed] [Google Scholar]
- 39.Lee S-J, Song Y, Baker NA. Biophys J. 2008;94:3565. doi: 10.1529/biophysj.107.116335. [DOI] [PMC free article] [PubMed] [Google Scholar]
- 40.Wennerström H, Jönsson B, Linse P. J. Chem. Phys. 1982;76:4665. [Google Scholar]
- 41.Stern O. Z. Elektrochem. 1924;30:508. [Google Scholar]
- 42.Eisenberg M, et al. Biochemistry. 1979;18:5213. doi: 10.1021/bi00590a028. [DOI] [PubMed] [Google Scholar]
- 43.Fukuma T, Higgins MJ, Jarvis SP. Phys. Rev. Lett. 2007;98:106101. doi: 10.1103/PhysRevLett.98.106101. [DOI] [PubMed] [Google Scholar]


