

Abstract
Background
Two recent advances in the statistical methods for testing hypotheses about mediation effects are important for nursing science. First, bootstrap sampling distributions provide more accurate tests of hypotheses about mediated effects. Second, methods for testing statistical hypotheses about subgroup differences in mediation models (moderated mediation) are now well developed.
Objective
The aims of this study were to demonstrate the use and relatively simple computation of bootstrap sampling distributions in tests of mediation effects and to demonstrate a recently refined method for testing hypotheses about moderated mediation.
Method
Using hypothetical data, a step-by-step demonstration was provided of the construction of a bootstrap sampling distribution for a correlation coefficient. Then, tests of mediation and moderated mediation were demonstrated using data from a clinical trial of an intervention for caregivers of patients with Parkinson’s disease or Alzheimer’s disease. In a model hypothesizing that mutuality between caregiver and care recipient mediates the effect of objective on subjective levels of caregiver burden, the bootstrap sampling distribution was calculated of the mediation effect and, from that, two types of 95% confidence intervals for it. Then the hypothesis was tested that the mediating effect of mutuality was stronger for caregivers of patients with Parkinson’s disease than for caregivers of patients with Alzheimer’s disease.
Conclusions
Statistical hypothesis testing should never dictate all conclusions. However, the statistical advances in mediation analysis described here will facilitate nursing research as both nurse scientists and methodologists understand their assumptions and logic.
Keywords: bootstrap sampling distribution, mediation, moderated mediation
Nurse researchers are often concerned with isolating potential mediators of health-related phenomena, but statistical tests for mediation have been limited in two ways. First, although methodologists have recommended bootstrap sampling distributions to test for mediation (MacKinnon, Lockwood, & Williams, 2004; Preacher & Hayes, 2008; Shrout & Bolger, 2002), a recent article in Nursing Research (Kraus et al., 2010) concluded that boot-strapping was too computationally complex to recommend. Second, before Edwards and Lambert (2007) and Preacher, Rucker, and Hayes (2007), statistical hypothesis tests for differences in mediated effects across sub-groups (moderated mediation) were underdeveloped.
Background
In the health and social scientific literature, mediation is the process whereby something causes an event or condition which in turn causes a third event (Collins, Graham, & Flaherty, 1998; James & Brett, 1984). For example, objective aspects of caregiver burden may affect the quality of the caregiver–care recipient relationship(mutuality), which in turn may influence the caregiver’s perception of burden: The effect of objective on subjective levels of burden may be mediated through mutuality. To demonstrate mediation, support must be provided for causation. This can be established by a temporal ordering of measures in the model. In the same example, support for mediation requires objective burden to be assessed prior to mutuality, which should be assessed prior to subjective burden.
Psychologists (Baron & Kenny, 1986; Collins et al., 1998; Preacher & Hayes, 2008; Shrout & Bolger, 2002) and nurse scientists (Barsevick, Dudley, & Beck, 2006; Chang, Lin, & Lin, 2007; Song, Moser, & Lennie, 2009) have focused research on potential mediators. Often, the Sobel (1982) method is used to test the null hypothesis that the mediated effect is equal to zero in the population. This test assumes that the sample mediated effect has a normal sampling distribution, which is not always true (MacKinnon, Lockwood, Hoffman, West, & Sheets, 2002; MacKinnon et al., 2004). Thus, the Sobel test can produce inaccurate probabilities, especially in small- and moderate-sized samples (MacKinnon et al., 2004).
The bootstrap method, used to construct the sampling distribution of a statistic, is useful when the form of the statistic’s sampling distribution is unknown (Efron & Tibshirani, 1994). Bootstrap sampling distributions are constructed by repeatedly sampling with replacement from n observations. A confidence interval (CI) can be constructed from a bootstrap sampling distribution by several methods (see Chapters 12–14 of Efron & Tibshirani, 1994). Two of these methods will be demonstrated here: the percentile and the bias, corrected. The bootstrap sampling distribution of the mediated effect provides the basis of more accurate hypothesis tests than do methods previously used, for example, the Sobel (1982) test (MacKinnon et al., 2004; Preacher & Hayes, 2004; Shrout & Bolger, 2002). Improved accuracy provides more power for identifying subtle mediating effects and mitigates the pursuit of false leads.
More complex mediational models propose that links in the mediation process are influenced by other variables called moderators. Muller, Judd, and Yzerbyt (2005) described two such models: mediated moderation and moderated mediation. The focus of this article is on moderated mediation. In models with moderated mediation, the magnitude of the mediated effect depends on the level of a moderator. The burden–mutuality–perception relationships just described may differ by patient diagnosis, for example, stronger among caregivers of Parkinson’s disease patients and weaker among caregivers of Alzheimer’s disease patients. Statistical tests of hypotheses about moderated mediation were proposed by Muller et al. However, their statistical tests were valid primarily when the independent variable was randomized treatment assignment.
Edwards and Lambert (2007) and Preacher et al. (2007) provided a general framework for statistical tests of moderated mediation, using similar tests. Because Edwards and Lambert provided an algebraic derivation of moderated mediated effects and discussed a broad range of models with moderated mediation, the Edwards and Lambert framework is used here.
Hypothesis Testing of the Mediation Effect
Baron and Kenny (1986) proposed criteria for the claim that a variable (M) is responsible for mediating the effect of an independent variable (X) on a particular dependent variable (Y). An example of a single variable (mutuality measured at 3 months) that is hypothesized to mediate the relationship between an independent variable (objective caregiver burden measured at 0 months) and a dependent variable (subjective caregiver burden measured at 12 months) is shown in Figure 1. The path coefficients in Figure 1 can be estimated by fitting three general linear models as follows:
Y = α1 + cX. The coefficient c quantifies the total relationship between X and Y, in this example, between objective and subjective levels of caregiver burden.
M = α2 + aX. The coefficient a quantifies the relationship between X and M, in this example, between objective level of caregiver burden and mutuality.
Y = α3 + c′X + bM. The coefficient b quantifies the relationship between M and Y when X is held constant or that between mutuality and subjective level of burden when objective level of burden is held constant. Also, c′ quantifies the relationship between X and Y while controlling M (the direct effect of X on Y).
Given Equations 1–3, the quantity (c′ – c) is equal to the quantity (a×b) (MacKinnon, Warsi, & Dwyer, 1995). Herein, the quantity (a × b) is referred to as the mediating effect of X on Y through M.
FIGURE 1.

Notation and model for mediation analyses.
According to Baron and Kenny (1986), M is a mediator of the relationship between X and Y when c is estimated to be nonzero (i.e., when there is a relationship between X and Y) and when both a and b are estimated to be nonzero. The latter condition is tested by the null hypothesis that the mediated effect in the population is equal to zero, that is, that (a×b) = 0. Many statistical tests of this null hypothesis have been proposed, with most based on the assumption that the sampling distribution of (a × b) is normal (e.g., Sobel, 1982), an assumption often unmet (MacKinnon et al., 2004). Furthermore, under the null hypothesis (i.e., when a × b = 0), the sampling distribution of sample estimates of (a × b) depends on whether a and b are both zero or only one of the coefficients is zero in the population. Even though the sampling distributions of (a × b) are known under each of these conditions (Meeker, Cornwell, & Aroian, 1981), it is impossible for the researcher to know which one to use. The theoretical rationale for using bootstrap sampling distributions for testing hypotheses about mediated effects is that they will approximate the correct distribution, regardless of its form (Efron & Tibshirani, 1994).
Using extensive simulations, MacKinnon et al. (2004) evaluated the accuracy of a variety of tests of the mediated effect, including several types of CIs based on bootstrap sampling distributions as well as the Sobel (1982) test. When (a × b) = 0 in the population, Type I error rates were more accurate for the bootstrap methods than for the Sobel test. Conversely, when (a × b) ≠ 0, the bootstrap tests rejected the null hypothesis more often than did the Sobel test. The best performing method was the bias-corrected CI based on a bootstrap sampling distribution (Efron & Tibshirani, 1994, Chapter 14). Before the MacKinnon et al. results, Shrout and Bolger (2002) recommended the bootstrap method to test hypotheses about mediation effects. Subsequently, Preacher and Hayes (2004) provided SPSS and SAS macros for computing bootstrap sampling distributions of mediated effects.
The Bootstrap Method
Example of the Bootstrap Method to Test a Single Relationship
The bootstrap method is demonstrated in Table 1 using a hypothetical sample of 15 caregivers (Column 1) who rated themselves on a mutuality scale (Archbold, Stewart, Greenlick, & Harvarth, 1992) with a care recipient (Column 2) and on the Center for Epidemiological Studies–Depression scale (Column 3; Radloff, 1977). The Spearman correlation between these two variables in this sample was .207. To construct a bootstrap sampling distribution of the sample correlation coefficient, the following was done:
A random sample was drawn of the 15 participants in such a way that any participant chosen was immediately returned to the pool and could be chosen again for the same sample, using a replacement method. The participant numbers chosen for this sample are shown in Column 4 (Bootstrap Sample 1). Collectively, the group of participant numbers may be referred to as a bootstrap sample. Some participant numbers appeared more than once in the bootstrap sample, whereas other participants in the original sample never appeared in the bootstrap sample. This produces variability across bootstrap samples.
Based on the scores from this first bootstrap sample, the Spearman correlation coefficient between depression and mutuality (r = −.089) was computed and stored.
Steps 1 and 2 were repeated B times. Efron and Tibshirani (1994) suggest that the value of B be at least 500 and they provided a formula (p. 275) showing how variability in bootstrap distributions of a sample statistic is affected by both B and the sample size n. In this example, B = 2,000. Columns 5 and 6 of Table 1 show participant numbers selected for the second and third (out of 2,000) bootstrap samples using this method.
TABLE 1.
Mutuality and Depression Scores of Hypotheticala Participants (n = 15) Selected for Bootstrap Samples by Random Sampling With Replacement
| Hypothetical sample |
Participant number selected for each bootstrap sampleb |
||||
|---|---|---|---|---|---|
| Participant no. | Score on mutualityc |
Score on depressiond |
Bootstrap Sample 1 |
Bootstrap Sample 2 |
Bootstrap Sample 3b |
| 1 | 3.400 | 16 | 5 | 1 | 3 |
| 2 | 3.677 | 13 | 4 | 14 | 4 |
| 3 | 3.333 | 34 | 13 | 9 | 6 |
| 4 | 3.133 | 22 | 4 | 14 | 15 |
| 5 | 1.933 | 9 | 10 | 14 | 12 |
| 6 | 3.067 | 4 | 12 | 8 | 9 |
| 7 | 1.467 | 1 | 11 | 12 | 13 |
| 8 | 3.269 | 7 | 1 | 1 | 1 |
| 9 | 2.933 | 4 | 15 | 9 | 9 |
| 10 | 1.867 | 12 | 7 | 10 | 13 |
| 11 | 3.677 | 3 | 11 | 1 | 7 |
| 12 | 3.933 | 4 | 15 | 1 | 15 |
| 13 | 3.600 | 13 | 10 | 15 | 6 |
| 14 | 3.267 | 21 | 11 | 4 | 11 |
| 15 | 1.730 | 9 | 10 | 8 | 9 |
| Sample Spearman correlation | .207 | −.089 | .142 | .262 | |
The small sample size of 15 was chosen to demonstrate that members of the original sample may reappear in the bootstrap samples multiple times or not at all.
Only 3 (of 2,000) bootstrap samples are shown here to illustrate the details of bootstrap sampling and not for analytic purposes. In practice, a much larger number of bootstrap samples would be drawn.
Hypothetical mutuality scores range from 1 to 4, with 1 indicative of low relationship quality and 4 indicative of high relationship quality.
Hypothetical depression scores range from 0 to 60, with low scores indicative of fewer depressive symptoms and high scores indicative of more depressive symptoms.
The frequency distribution of these 2,000 sample values represented a bootstrap sampling distribution of the Spearman correlation coefficient between caregiver depression and mutuality based on random samples of 15 participants, as shown in Figure 2.
FIGURE 2.

The bootstrap sampling distribution of B = 2,000 sample correlation coefficients.
The bootstrap 95% percentile CI for the Spearman correlation between depression and mutuality was derived from the 2.5th and the 97.5th percentiles of the distribution and was −0.407 to 0.703. When testing the null hypothesis that the Spearman correlation coefficient was zero in the population of all caregivers, it could not be rejected at the .05 level because zero fell between −0.407 and 0.703. The 95% bias-corrected bootstrap CI for these data was computed as follows: The proportion of correlation coefficients in the bootstrap sampling distribution that were below the value of 0.207 was 0.505. The standard normal z score associated with 0.505 was 0.0125. Then, ((2)(0.0125) − 1.96) = −1.935 and ((2)(0.0125) + 1.96) = 1.985. The percentiles of these z scores were 0.026 and 0.976, respectively. The points in the bootstrap sampling distributions corresponding to these percentiles yielded the bias-corrected 95% CI for the population Spearman correlation coefficient: −0.407 and 0.709.
Example of the Bootstrap Method to Test a Mediated Relationship
To test the null hypothesis that the mediation effect is zero in the population, on each of 2,000 bootstrap samples three general linear models are fit as described in Equations 1 through 3. Using parameters from these models, the estimated mediated effect of (ab) is calculated and stored for each sample. From the frequency distribution of these stored data, CIs can be computed and the null hypothesis can be tested by observing whether or not it contains zero.
It was hypothesized that over time, the demands of caregiving change the level of mutuality between caregiver and patient, resulting in altering subjective levels of burden experienced by the caregiver. The mediation model is presented in Figure 3 with path coefficients estimated from the general linear models. The mediated effect of objective on subjective burden through mutuality was estimated as (a × b) = 0.084. The 95% bootstrap percentile and the bias-corrected CIs for the mediated effect were similar: −0.060 to 0.260. Because this interval contained zero, the hypothesis that mutuality mediated the objective–subjective burden relationship was not supported.
FIGURE 3.
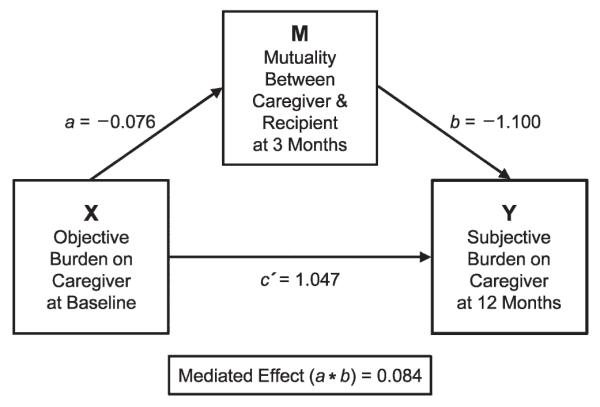
Estimated mediation model without the disease group.
Moderated Mediation
The general framework of Edwards and Lambert (2007) for moderated mediation incorporates the effects of other variables on the independent variable–mediator(a) path, the mediator– dependent variable (b) path, or independent and dependent variables while controlling a mediator (c′). General linear models are fit to the original sample, similar to Equations 1 through 3. However, for paths hypothesized to be affected by subgroups, the general linear model includes an interaction term to capture the variability in the path coefficient across subgroups. After the estimation of path coefficients based on the total sample, explicitly derived formulas for estimating mediation effects by subgroup are applied. These formulas depend upon which paths are hypothesized to be affected by the subgroups. Next, they use bootstrap sampling distributions to test the hypothesis that the mediation effect is equivalent across subgroups in the population. This requires drawing a large number of bootstrap samples and, for each, (1) computing the mediation effect (ab) by a subgroup using coefficients derived from the total sample; (2) calculating the difference, for example, (ab)Group 1 − (ab)Group 2; and (3) storing the result. The frequency distribution of the stored values is the bootstrap sampling distribution of the difference in (a × b) across subgroups. A percentile or bias-corrected CI for this difference is constructed from the bootstrap sampling distribution, allowing the test of the null hypothesis that the difference in mediation effects across subgroups is zero in the population.
Example of a Bootstrap Test for Moderated Mediation
It was hypothesized that the mediation model shown in Figure 3 would be different depending upon the disease of the care recipient and that the source of this difference lay in the relationship between mutuality and subjective burden (the b path). Based on the general linear models (Table 2), the estimated b path coefficient differed statistically across the two groups of caregivers (Table 2, fifth row, interaction parameter bmz = −4.145, t = −2.13, p = 0.035); the estimated a path coefficient did not (Table 2, third row, interaction parameter axz = −0.048, t = −1.71, p = .090). These interaction parameters were used in the calculation of the estimated path coefficients for either group of caregivers, as shown at the bottom of Table 3. The results are presented in the main part of Table 3. The estimated a paths for the two groups of caregivers were similar: −0.090 for the caregivers of Parkinson’s patients and −0.042 for the caregivers of Alzheimer’s patients. The b coefficient was much larger for caregivers of Parkinson’s patients: −3.478 versus 0.667 for caregivers of Alzheimer’s patients. This difference was reflected in a difference in the mediating effect of objective on subjective burden through mutuality across the two groups. The mediated effects were larger for caregivers of Parkinson’s patients (0.313, fifth column) than for caregivers of Alzheimer’s patients (−0.028, fifth column).
TABLE 2.
General Linear Modeling Results Neededa for the Calculation of Moderated Mediation Effects of Objective Burden on Subjective Burden Through Mutuality Among Caregivers (n = 151) According to the Disease of the Care Recipientb
| Effect | Edward’s notationc | Parameter estimate | SE | 95% CI | t | p |
|---|---|---|---|---|---|---|
| a Path: objective burden to mutuality | ax | −0.041 | 0.019 | −0.083 to −0.004 | −2.15 | .033 |
| Interaction of objective burden and disease on mutuality |
axz | −0.048 | 0.028 | −0.104 to 0.007 | −1.71 | .090 |
|
b Path: mutuality to subjective burden holding objective burden constant |
bm | 0.667 | 1.229 | −0.742 to 3.075 | 0.54 | .588 |
| Interaction of mutuality and disease on subjective burden holding objective burden constant |
bmz | −4.145 | 1.944 | −7.954 to −0.335 | −2.13 | .035 |
|
c′ Path: objective burden to subjective burden holding mutuality constant. |
bx | 1.041 | 0.227 | 0.595 to 1.487 | 4.58 | <0.001 |
| Interaction of objective burden and disease on subjective burden holding mutuality constant |
bxz | −0.166 | 0.358 | −0.867 to 0.536 | −0.46 | .644 |
Note. CI = confidence interval.
The parameters shown here are used in the computation of the a and b path coefficients by subgroup as well as the mediation effects (a × b) by subgroup as shown in Table 3.
The parameters shown here were derived from three separate general linear models, each based on the original sample of 151.
The statistical notation used in this table was taken from Edwards and Lambert (2007).
TABLE 3.
Direct and Mediated Effect Path Coefficients Across Disease Groups Derived from the Results of the General Linear Models (n = 151)
|
a Path coefficient1 |
b Path coefficient2 |
c′ Direct effect coefficient3 |
(ab) Mediated effect coefficient4 |
|
|---|---|---|---|---|
| Parkinson’s (Z = 1) |
−0.090 | −3.478 | 0.875 | 0.313 |
| Alzheimer’s (Z = 0) |
−0.042 | 0.667 | 1.041 | −0.028 |
| Difference | −0.048 | −4.145 | −0.166 | 0.340 |
a Path = (ax + axzZ) = −0.0415 − 0.0484 = −0.0899 if Z = 1 (for Parkinson’s) or −0.0415 if Z = 0 (for Alzheimer’s).
b Path = (bm + bmzZ) = 0.6668 – 4.1445 = −3.4777 if Z = 1 (for Parkinson’s) or 0.6668 if Z = 0 (for Alzheimer’s).
Direct effects = (bx + bxzZ) = 1.0410 – 0.1658 = 0.8752 if Z = 1 (for Parkinson’s) or 1.0410 if Z = 0 (for Alzheimer’s).
Mediated effects = (a path)(b path) = (−0.0899)(−3.4777) = 0.3126 if Z = 1 (for Parkinson’s) or (−0.0415)(0.6668) = −0.0277 if Z = 0 (for Alzheimer’s).
In Table 4, only the bias-corrected 95% CI for the difference in mediated effects derived from the bootstrap sampling distribution excluded zero (Row 6, 0.057 to 0.806). These results, summarized in Figure 4, provided limited support for the hypothesis that mutuality mediated the effects of objective on subjective levels of burden in caregivers of Parkinson’s but not Alzheimer’s disease patients. As hypothesized, the mediation effect failed to appear in the caregivers of Alzheimer’s disease patients because of the absence of a relationship between mutuality and subjective levels of burden, when objective levels of burden were controlled (i.e., the b path coefficient).
TABLE 4.
95% Confidence Intervals and Their Widths for Mediated Effects of Objective Burden on Subjective Burden Through Mutuality by Disease Group (n = 151)
| Mediated effect for |
|||
|---|---|---|---|
| Statistical method | Parkinson’s disease caregivers .313 |
Alzheimer’s disease caregivers −.028 |
Difference in mediated effects .340 |
| Percentile bootstrap | |||
| Bounds | −0.000 to 0.709 | −0.152 to 0.100 | −0.015 to 0.743 |
| Width | 0.709 | 0.252 | 0.758 |
| Bias-corrected bootstrap | |||
| Bounds | 0.053 to 0.751 | −0.178 to 0.074 | 0.057 to 0.806 |
| Width | 0.698 | 0.252 | 0.749 |
FIGURE 4.
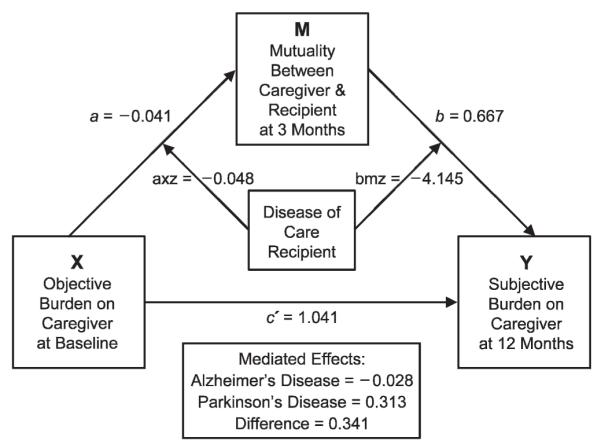
Estimated mediation model including the disease group.
Software to execute statistical tests of moderated mediation for the five models discussed by Preacher et al. (2007) is available in SPSS (see http://www.quantpsy.org). Programs to perform calculations in this article are available in SAS from the corresponding author.
Conclusions
The bootstrap sampling distribution yields more accurate statistical tests of mediated relationships and is not computationally burdensome. The Edwards and Lambert (2007) framework for moderated mediation allows researchers to test statistical hypotheses about mediation models hypothesized to vary depending on levels of another variable. Although conclusions are never based on the results of statistical hypothesis testing alone, an understanding of their logic is essential for nurse scientists to appropriately weigh their contributions.
Acknowledgments
Thank you to Judith Hays, PhD, for her invaluable contributions in writing this manuscript.
Footnotes
The authors have no funding or conflicts of interest to disclose.
Contributor Information
Janet A. Levy, School of Nursing, Duke University, Durham, North Carolina.
Lawrence R. Landerman, Center for the Study of Aging and Human Development, Duke University Medical Center, Durham, North Carolina.
Linda Lindsey Davis, School of Nursing, Duke University, Durham, North Carolina.
References
- Archbold P, Stewart B, Greenlick M, Harvarth T. Clinical assessment of mutuality and preparedness in family caregivers to frail older people. In: Funk S, Tornquist E, Champagne M, Weise R, editors. Key aspects of elder care: Managing falls, incontinence and cognitive impairment. Springer; New York: 1992. pp. 328–339. [Google Scholar]
- Baron RM, Kenny DA. The moderator-mediator variable distinction in social psychological research: Conceptual, strategic, and statistical considerations. Journal of Personality and Social Psychology. 1986;51(6):1173–1182. doi: 10.1037//0022-3514.51.6.1173. [DOI] [PubMed] [Google Scholar]
- Barsevick AM, Dudley WN, Beck SL. Cancer-related fatigue, depressive symptoms, and functional status: A mediation model. Nursing Research. 2006;55(5):366–372. doi: 10.1097/00006199-200609000-00009. [DOI] [PubMed] [Google Scholar]
- Chang HJ, Lin MF, Lin KC. The mediating and moderating roles of the cognitive triad on adolescent suicidal ideation. Nursing Research. 2007;56(4):252–259. doi: 10.1097/01.NNR.0000280611.00997.0e. [DOI] [PubMed] [Google Scholar]
- Collins LM, Graham JJ, Flaherty BP. An alternative framework for defining mediation. Multivariate Behavioral Research. 1998;33(2):295–312. doi: 10.1207/s15327906mbr3302_5. [DOI] [PubMed] [Google Scholar]
- Edwards JR, Lambert LS. Methods for integrating moderation and mediation: A general analytic framework using moderated path analysis. Psychological Methods. 2007;12(1):1–22. doi: 10.1037/1082-989X.12.1.1. [DOI] [PubMed] [Google Scholar]
- Efron G, Tibshirani R. An introduction to the bootstrap. Chapman & Hall/CRC; New York: 1994. [Google Scholar]
- James LR, Brett JM. Mediators, moderators, and tests for mediation. Journal of Applied Psychology. 1984;69:307–321. [Google Scholar]
- Kraus MR, Serlin RC, Ward SE, Rony YZ, Ezenwa MO, Naab F. Testing mediation in nursing research: Beyond Baron and Kenny. Nursing Research. 2010;59(4):288–294. doi: 10.1097/NNR.0b013e3181dd26b3. [DOI] [PMC free article] [PubMed] [Google Scholar]
- MacKinnon DP, Lockwood CM, Hoffmann JM, West SG, Sheets V. A comparison of methods to test the significance of mediation and other intervening variable effects. Psychological Methods. 2002;7(1):83–104. doi: 10.1037/1082-989x.7.1.83. [DOI] [PMC free article] [PubMed] [Google Scholar]
- MacKinnon DP, Lockwood CM, Williams J. Confidence limits for the indirect effect: Distribution of the product and resampling methods. Multivariate Behavioral Research. 2004;39(1):99–128. doi: 10.1207/s15327906mbr3901_4. [DOI] [PMC free article] [PubMed] [Google Scholar]
- MacKinnon DP, Warsi G, Dwyer JH. A simulation study of mediated effect measures. Multivariate Behavioral Research. 1995;30(1):41–62. doi: 10.1207/s15327906mbr3001_3. [DOI] [PMC free article] [PubMed] [Google Scholar]
- Meeker WQ, Jr., Cornwell LW, Aroian LA. Selected tables in mathematical statistics: Volume VII: The product of two normally distributed random variables. American Mathematical Society; Providence, RI: 1981. [Google Scholar]
- Muller D, Judd CM, Yzerbyt VY. When moderation is mediated and mediation is moderated. Journal of Personality & Social Psychology. 2005;89:852–863. doi: 10.1037/0022-3514.89.6.852. [DOI] [PubMed] [Google Scholar]
- Preacher KJ, Hayes AF. SPSS and SAS procedures for estimating indirect effects in simple mediation models. Behavior Research Methods, Instruments and Computers. 2004;36(4):717–731. doi: 10.3758/bf03206553. [DOI] [PubMed] [Google Scholar]
- Preacher KJ, Hayes AF. Asymptotic and resampling strategies for assessing and comparing indirect effects in multiple mediator models. Behavior Research Methods. 2008;40(3):879–891. doi: 10.3758/brm.40.3.879. [DOI] [PubMed] [Google Scholar]
- Preacher KJ, Rucker DD, Hayes AF. Addressing moderated mediation hypotheses: Theory, methods, and prescriptions. Multivariate Behavioral Research. 2007;42(1):185–227. doi: 10.1080/00273170701341316. [DOI] [PubMed] [Google Scholar]
- Radloff L. The CES-D scale: A self-report depression scale for research in the general population. Applied Psychological Measurement. 1977;1(3):385–401. [Google Scholar]
- Shrout PE, Bolger N. Mediation in experimental and nonexperimental studies: New procedures and recommendations. Psychological Methods. 2002;7(4):422–445. [PubMed] [Google Scholar]
- Sobel ME. Asymptotic confidence intervals for indirect effects in structural equation models. Sociological Methodology. 1982;13:290–312. [Google Scholar]
- Song EK, Moser D, Lennie TA. Relationship of depressive symptoms to the impact of physical symptoms on functional status in women with heart failure. American Journal of Critical Care. 2009;18(4):348–356. doi: 10.4037/ajcc2009450. [DOI] [PMC free article] [PubMed] [Google Scholar]