

Abstract
There are no effective antivirals currently available for the treatment of flavivirus infection in humans. As such, the identification and characterization of novel drug target sites are critical to developing new classes of antiviral drugs. The flavivirus NS5 N-terminal capping enzyme (CE) is vital for the formation of the viral RNA cap structure, which directs viral polyprotein translation and stabilizes the 5′ end of the viral genome. The structure of the flavivirus CE has been solved, and a detailed understanding of the CE–guanosine triphosphate (GTP) and CE–RNA cap interactions is available. Because of the essential nature of the interaction for viral replication, disrupting CE–GTP binding is an attractive approach for drug development. The authors have previously developed a robust assay for monitoring CE–GTP binding in real time. They adapted this assay for high-throughput screening and performed a pilot screen of 46 323 commercially available compounds. A number of small-molecule inhibitors capable of displacing a fluorescently labeled GTP in vitro were identified, and a second functional assay was developed to identify false positives. The results presented indicate that the flavivirus CE cap-binding site is a valuable new target site for antiviral drug discovery and should be further exploited for broad-spectrum anti-flaviviral drug development.
Keywords: flavivirus, NS5 N-terminal capping enzyme (CE), high-throughput screening, drug development, anti-infective drugs, fluorescence polarization (FP)
INTRODUCTION
Mosquito-borne flaviviruses (family Flaviviridae, genus flavivirus), including dengue, yellow fever, and West Nile viruses, can cause significant morbidity and mortality worldwide. The Aedes aegypti mosquito, which is found on almost every continent of the world,1 is the primary vector for both dengue and yellow fever viruses.2 Flavivirus infection can cause a wide range of disease symptoms ranging from mild febrile illness to hemorrhagic disease in dengue infection and liver and kidney failure in yellow fever infection.3 Fifty to 100 million cases of dengue fever and 200 000 cases of yellow fever are reported each year, resulting in respectively ~20 000 and ~30 000 deaths annually throughout the world.4,5 Despite the morbidity and mortality caused by flavivirus infection, there is currently no effective chemotherapeutic treatment for infection by any member of the flavivirus family. The dearth of small-molecule therapeutics available for clinical use has driven the search for novel and potent inhibitors of viral infection in recent years. Antivirals are in the early stages of development against various flaviviral targets, including inhibitors of viral entry,6,7 translation,8 protein processing,9 and replication.10,11 The global socioeconomic impact of the flavivirus pathogens coupled with the propensity of RNA viruses to become resistant following drug selection necessitates both continued identification and validation of targets as well as the design of novel antiviral compounds.
Flaviviruses possess a 5′ capped, positive sense RNA genome of approximately 11 kb in length. The viral genome encodes for three structural proteins—the capsid (C), the premembrane (prM), and the envelope (E)—and eight nonstructural proteins (NS): NS1, NS2A, NS2B, NS3, NS4A, 2K, NS4B, and NS5. Viral RNA replication occurs on the cytoplasmic surface of the endoplasmic reticulum of infected cells, and flaviviruses have evolved a series of enzymes to cap their genomic RNA in the absence of cellular RNA capping enzymes.12–14,16 RNA caps are formed by the action of three classes of enzymes: RNA triphosphatase to remove the gamma phosphate from the 5′ end of the newly replicated viral positive-strand RNA, guanylyltransferase to transfer a guanosine monophosphate moiety from guanosine triphosphate (GTP) to the diphosphorylated 5′ RNA end, and methyltransferase to transfer methyl groups from S-adenosylmethionine to the guanine N-7 and ribose 2′ hydroxyl positions.17 Flaviviruses encode their RNA triphosphatase in the multifunctional NS3 enzyme.16,18 The NS5 N-terminal capping enzyme (CE) is responsible for transferring a guanosine monophosphate (GMP) from GTP to the diphosphorylated genomic14 and for adding methyl groups to the guanine N-7 and ribose 2′ hydroxyl positions of the viral cap.19 The structures of several flavivirus CE enzymes are known,7,13,20–23 and they all show a high degree of functional and structural conservation.
A great deal of work has been performed to delineate the biochemical mechanism of CE activity, particularly focused on the methyl-transfer reaction,4,19,24–26 the binding of the guanine cap structure by the protein,13,21–23 and the guanylyltransfer reaction centered at the GTP binding site.13 Each of these functions is a potential point of therapeutic intervention as they are critical to CE function.13,27 The guanine cap-binding mechanism is significantly different from that used by the cellular cap and by other GTP binding proteins, which generally coordinate the guanine base between two planar or charged amino acid side chains.28–30 The open architecture of the flavivirus CE GTP binding pocket suggests that compounds may be developed that selectively target the viral CE cap binding and guanylyltransferase active site.13,14,21,22 We previously performed a detailed structural and biochemical characterization of dengue and yellow fever CE cap-binding characteristics using an in vitro fluorescence polarization (FP) assay that monitored the displacement of a fluorescent GTP analog, GTP–BODIPY.13 During the course of these studies, we tested a number of GTP analogs for their ability to displace GTP–BODIPY from the capping enzymes, which indicated that our FP assay would be adaptable to high-throughput screening (HTS) of chemical libraries to identify novel chemical entities that could displace GTP from the CE. In this report, we describe the validation of the FP assay for HTS and its application in a preliminary screen of 46 323 compounds and the identification of compounds able to displace GTP from the CE. Initial hits were confirmed and apparent Kis were determined for the small molecules that displayed high affinity for the binding site. Computational-based analysis of a number of the small-molecule hits sheds light on possible modes of inhibitor–CE interaction. Furthermore, a secondary assay was developed to identify false positives. Our results suggest that the assay can be used for a larger screen with the goal of identifying small molecules with antiviral activity against the CE of flaviviruses.
MATERIALS AND METHODS
Compound libraries
The chemical library screened is a subset of a compilation of commercially available small-molecule chemical libraries maintained at the NERCE National Screening Laboratory (NSRB), which is housed at the ICCB-Longwood screening facility located at Harvard Medical School. The compounds have been prescreened for drug-like properties (Lipinski’s rules).31 Stock libraries were stored at a concentration of 5 mg/mL in DMSO at −80 °C in 384-well format, with at least two empty columns on each plate to allow for on-plate controls. Libraries (number of molecules) from the following companies were evaluated: Asinex (12378; Winston-Salem, NC), ChemBridge (10560; San Diego, CA), ChemDiv (1249; San Diego, CA), Enamine (14080; Kiev, Ukraine), Life Chemicals (3893; Burlington, Canada), Maybridge (3212; Cornwall, UK), Peakdale (352; High Peak, UK), and Mixed Commercial (599; Dr. Tudor Oprea, University of New Mexico, NM).
Preparation of proteins
Recombinant NS5 CE domains from YF (strain 17D, AA 1–268) and DEN2 (strain 16681, AA 1–267) were previously described.13 YF protein was produced in BL21 (DE3) Codon Plus Escherichia coli cells (Novagen, Madison, WI). DEN2 protein was produced in BL21 (DE3) pLysS E. coli cells (Novagen). YF and DEN2 proteins were induced and purified using the same protocol. Cultures (750 mL) were induced with 400 μM isopropyl-beta-D-thiogalactopyranoside (IPTG) overnight at 22 °C, and the bacterial pellets were collected and stored at −80 °C in low imidizole lysis buffer. Frozen pellets were thawed and lysed with an M-110-L Pneumatic microfluidizer (Microfluidics, Inc., Newton, MA), and the lysate was clarified by centrifugation at 18K rpm in a SS-24 rotor. The histidine-tagged protein was purified from clarified lysates using a Hi-Trap Nickel column (GE Healthcare, Piscataway, NJ) on an AKTA Purifier FPLC system. The eluted proteins were concentrated using 10K Amicon Ultra concentrators (Millipore, Billerica, MA) and buffer exchanged into 200 mM NaCl, 20 mM Tris-Base (pH 7.5), 0.02%sodiumazide,20%glycerol, and5mMTris(2-Carboxyethyl) phosphine hydrochloride (TCEP-HCl) on a Superdex 200 gel filtration column (Amersham, Buckinghamshire, UK). Purified proteins were concentrated using 10K Amicon Ultra concentrators to 300 μM, and the concentrations were determined by the absorbance at 280 nm using extinction coefficients obtained from the ExPASy website. Isolated proteins were >99% pure as estimated from sodium dodecyl sulfate polyacrylamide gel electrophoresis (SDS-PAGE) and Coomassie blue staining. Purified protein was stored at −80 °C in single-use aliquots.
High-throughput screening
A fluorescence polarization assay was adapted for high-throughput compound screening. The assay evaluated the ability of a small-molecule inhibitor to compete with GTP–BODIPY for the GTP-binding site of the YF CE and was performed in 384-well format using low-binding opaque black microplates (3654; Corning, Corning, NY). A Matrix WellMate (Thermo Fisher Scientific, Waltham, MA) with plate stacker was used for all liquid handling steps except compound transfer, and 25 μL per well of master mix for a final concentration of 500 nM YF CE, 10 nM GTP–BODIPY (G22183; Invitrogen, Carlsbad, CA), 2 mM dithiothreitol (DTT), and binding buffer (50 mM Tris-Base (pH 7.5), 0.01 NP-40) was preplated. Small molecules were added by robotic pin transfer using an Epson compound transfer robot. The transfer volume was 100 nL of stock compound at a concentration of 5 mg/mL in DMSO. GTP was used as a control for maximal inhibition and was added in a 15-μL volume (in H2O) to relevant wells for a final concentration of 10 μM. All other wells received 15 μL H2O to a final volume of 40 μL, CE concentration of 500 nM, and GTP–BODIPY of 10 nM. Final DMSO concentration was 0.25%. Plates were incubated at room temperature for 1 h, and FP and total fluorescence signals were detected using an EnVision 2103 multilabel plate reader with a plate stacker attachment (PerkinElmer, Waltham, MA). Each compound was tested in duplicate. The assay conditions as used were optimized to provide a Z′ factor (see data analysis below) >0.74.
Competition assays
The fluorescence polarization competition assays have been described previously.13 Cherry-pick compounds identified from the HTS were requested from NSRB in 2-μL aliquots (5 mg/mL) and retested in-house using the fluorescence polarization assay on a Victor 3V multimode plate reader (PerkinElmer). Cherry-pick compounds that repeated were purchased from commercial vendors (Table 1) and used in 24-point Ki determination assays. All assays were performed in opaque black 384-well micro-plates (3573; Corning) in 50-μL volumes. Briefly, DMSO-diluted compounds (2.5 μL) were added to wells preplated with 47.5 μL of 1.05× master mix (525 nM CE, 10.5 nM GTP–BODIPY, 52.5 mM Tris [pH 7.5], 0.0105% NP-40) for a final concentration of 500 nM CE protein (YF or DEN) and 10 nM GTP–BODIPY. Control wells (GTP–BODIPY + DMSO and GTP–BODIPY + CE + DMSO) were included on each plate to determine minimum and maximum FP and fluorescence signals, respectively. Plates were incubated at room temperature for 1 h, and FP and total fluorescence signals were detected using a Victor 3V multimode plate reader (PerkinElmer). All assays were performed three times in duplicate.
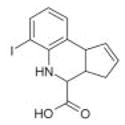
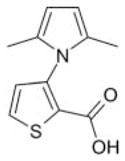
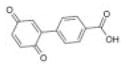
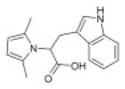
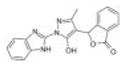
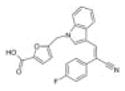
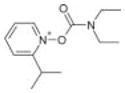
Table 1.
Summary of the Hit Compounds
| Structure | Company/Library Vendor ID | Percent Inhibition HTS | FP (μM) DEN YF |
TF (μM) DEN YF |
FP TF Hill Slope (max; min) |
Guanylation IC50 (μM) DEN |
|---|---|---|---|---|---|---|
|
Chembridge3 | 40 | 7.1 ± 1.4 | 2.1 ± 0.39 | −3.8 (310; 219) | 7.3 ± 4.3 |
| 5660163 | 4.5 ± 0.2 | 3.9 ± 1.2 | −2.5 (8.17E6; 4.75E6) | |||
|
Maybridge 5 | 46 | 9.8 ± 1.0 | 8.9 ± 0.8 | −3.6 (311; 213) | 5.2 ± 3.8a |
| GK 02514 | 3.2 ± 0.5 | 10.0 ± 0.7 | −2.5 (8.21E6; 4.73E6) | |||
|
Chembridge 3 | 24 | 5.2 ± 0.6 | 5.4 ± 0.1 | −2.4 (319; 199) | 95.6 ± 65.0a |
| 5406174 | 7.7 ± 1.6 | 13.3 ± 2.0 | −2.1 (8.59E6; 4.78E6) | |||
|
Asinex 1 | 23 | 10.1 ± 1.3 | 9.1 ± 2.5 | −2.4 (322; 205) | 78.9 ± 37.8 |
| BAS 01211690 | 5.8 ± 0.5 | 5.8 ± 1.7 | −1.8 (7.97E6; 5.01E6) | |||
|
Chembridge 3 | 17 | 7.4 ± 0.8 | 7.3 ± 1.4 | −3.6 (315; 214) | 7.7 ± 7.4 |
| 7871678 | 17.2 ± 1.8 | 38.6 ± 3.0 | −1.8 (7.92E6; 4.17E6) | |||
|
Chembridge 3 | 16 | 2.1 ± 0.7 | 2.3 ± 0.3 | −4.2 (309; 209) | 87.8 ± 11.5 |
| 7972338 | 1.9 ± 1.0 | 3.2 ± 3.0 | −2.6 (7.54E6; 4.20E6) | |||
|
|
Asinex | 12 | 4.8 ± 1.5 | 2.6 ± 0.5 | −2.8 (308; 189) | <100 |
| BAS01531218 | 4.9 ± 1.0 | 6.2 ± 1.4 | −1.9 (7.34E6; 3.94E6) | |||
|
Asinex | 11 | 2.2 ± 0.3 | 3.0 ± 0.2 | −1.74 (306; 227) | <100 |
| BAS01531205 | 7.5 ± 0.6 | 7.6 ± 3.0 | −1.44 (5.0E6; 2.93E6) |
HTS, high-throughput screening; FP, fluorescence polarization; TF, total fluorescence.
Precipitates protein.
Guanylation assay
The protein guanylation reaction was set up as 5 mM Tris-base (pH 7.5), 3 μM DEN CE, 1 μM GTP-ATTO-680 (catalog NU-830; Jena Biosciences, Jena, Germany), 500 nM MgCl2, and 0.1% NP-40 in 10-μL volumes. All the compounds were stored in DMSO and added to the guanylation reaction at six concentrations (200, 100, 50, 25, 12.5, and 6.25 μM), with DMSO concentrations of 0.5%. DMSO control samples (0.5%) were run in parallel on each gel.
Samples were incubated with compound at 37 °C for 4 h, and 1 μL of 1 M EDTA was added to quench each reaction. Then, 6× Laemmli loading buffer was added to each tube, and the proteins were denatured at 100 °C for 5 min. Next, 10 μL of each sample was resolved using SDS-PAGE. The gels were imaged on a Licor (Lincoln, NE) Odyssey scanner on the 700-nm channel at an intensity of 7.5. The gels were then stained in Coomassie blue to verify protein equivalence.
Pixel counts for each band were quantified with the Odyssey software package. The pixel count of each sample was divided by the pixel count of its DMSO appropriate control. To normalize for protein concentration, the Odyssey signal was compared against the Coomassie blue stain of the PAGE gel. The Coomassie blue–stained PAGE gel was scanned using a Bio-Rad (Hercules, CA) Versa Doc Imaging System. The mean intensities of each band were obtained using Image J (National Institutes of Health, Bethesda, MD). To normalize for protein concentration, each Odyssey signal was divided by its corresponding Coomassie blue signal to yield an Odyssey/Coomassie blue ratio. This ratio represents the amount of guanylation signal observed per unit of observable protein. The value obtained for the control was set to 1, and the value obtained for each sample represented the fraction of the control signal observed from each normalized sample. Percent inhibition (PI) was calculated as [1 − (sample/control)] × 100%. The Q-test32 was applied to all data at 90% confidence and outliers discarded. The standard error of the mean (SEM) was calculated for all compounds.
Docking and scoring
To explore potential ligand-binding conformations and to satisfy ligand-binding requirements, we used the GOLDScore docking and scoring algorithm implemented in GOLD.33 Each inhibitor was docked 50 times using default parameters into the YF CE structure (PDB ID, 3EVD). The centroid was defined as the 10 Å centered at (X = 16.37, Y = −52.73, and Z = 17.934). The ligand orientation selected for further analysis was the top scoring consensus orientation from the 50 independent Genetic Algorithm (GA) runs generated by GOLD. Docking orientations and probable hydrogen bonds were visualized using DS Viewer Pro, and figures were generated using PyMol.34 The docking protocol used was previously validated with GTP, guanosine diphosphate (GDP), and GMP (data not shown).
Data analysis
High-throughput screening
Data analysis was performed in Excel 97.
Fluorescence polarization35 is defined as follows:
| (1) |
where P is polarization, Is is parallel polarization emission light, and IP is perpendicular polarized emission light.
To evaluate the quality and suitability of the FP assay for HTS, the Z′ factor associated with the assay (all wells) was determined. The bound GTP–BODIPY was used as the negative control, and the GTP–BODIPY in the presence of 10 μM GTP was used as the positive control. An assay with a Z′ factor value >0.7 is considered very robust and suggests that the assay will perform well in a high-throughput screen.36
Hits from the HTS assay were determined as percent inhibition (PI). PI is defined as follows:
| (2) |
For a compound to be considered a hit, the following criteria had to be met: (1) compounds with >30% PI were considered strong hits, 20% to 30% medium hits, and 10% to 20% weak hits; (2) duplicates must be consistent (mP values within 20% for duplicates); and (3) total fluorescence must not increase. Total fluorescence is used as a quality control criterion to identify inherently fluorescent molecules.15
Competition assays
Fluorescence polarization and total fluorescence data were analyzed as previously described.13 Fluorescence and FP data whose values appeared to be increased due to intrinsic compound fluorescence were excluded from the analysis. In cases where a complete curve could not be achieved due to intrinsic compound fluorescence, GTP–BODIPY-only control values were used to define the bottom of the curve, and then Ki values were generated using the constrained curve. Compounds with average Ki values of greater than 100 μM were reported as >100 μM.
RESULTS
Assay optimization and validation
The flavivirus CE GTP binding site appears to have two functions in viral capping: binding GTP in the guanlylyl transfer reaction to transfer GMP to diphosphorylated viral RNAs14 and to position the flaviviral RNA cap structure as the initial step in the methyl group transfer from the cofactor S-adenosylmethionine.13,20–23,26 As the CE binds both GTP and the guanosine cap structure during viral replication, GTP is considered an appropriate proxy for the flaviviral RNA cap structure in a competition assay.13,21 We have previously established an in vitro FP assay that can be used to determine whether molecules are able to compete with GTP for the CE GTP-binding site.13 FP assays have been broadly implemented for biomolecular HTS applications37–41 and have been successfully applied to GTP binding assays.42,43 FP is a ratiometric measurement of the normalized difference of parallel (IS) and perpendicular (IP) emission beam intensities such that polarization, P = (IS − IP)/(IS + IP). Initial characterization of the FP assay developed to evaluate the effects of small-molecule association with the CE GTP binding site has been described previously,13 and relevant data are addressed only briefly here. For this study, we are using GTP linked to the fluorophore 4,4-difluoro-4-bora-3a, 4a-diaza-s-indacence (BODIPY) via the γ-thiol of GTP-γ-S. We previously determined the following: first, similar Kd values were obtained for GTP–BODIPY bound to both DEN2 and YF CE (72 + 2 nM and 124 + 6 nM, respectively); second, change in FP and total fluorescence intensities was determined in the presence of varying concentrations of GTP and GTP–BODIPY as a function of protein concentration. For the DEN2 CE, the GTP–BODIPY Ki = 126 + 15 nM, whereas the Ki for GTP = 119 + 25 nM. Finally, in a competition assay, the Ki for the displacement of GTP–BODIPY by GTP = 40 + 10 nM as compared to 350 + 39 μM for displacement by adenosine triphosphate (ATP).13
To explore the robustness of the assay in HTS format, we first evaluated the Z′ factor associated with inhibition of the positive control, GTP. The dependency of the Z′ factor on the standard deviation of the duplicates (see equation (2)) suggests an exploration of the plating volumes to maximize the consistency by minimizing the variability associated with plating. Both the master mix and the GTP (or water) were loaded and dispensed using a Matrix WellMate. Volumes of 5, 10, and 15 μL were analyzed for GTP/water addition, and final assay volumes of 35, 40, 45, and 50 μL were considered. We found that preplating 25 μL of the master mix and 15 μL of the control GTP provided a Z′ consistently >0.74 (data not shown). As this work represents a pilot screen and we propose screening additional libraries, we analyzed the Z′ factors calculated for all screening plates to examine the repeatability and robustness of the assay (Fig. 1). The overall average Z′ factor for the screen was 0.82 ± 0.04, suggesting that the assay is applicable for HTS. The 40-μL volume used resulted in final compound concentrations of 12.5 μg/mL in each test well.
FIG. 1.

Analysis of the robustness of the pilot screen. (A) Examination of the Z′ and mP values associated with the screen. Red lines indicate the first and second screening sessions performed on day 2. (B) Comparison of mP values associated with the first and second screening sessions on day 2.
Compound screening results
In an effort to identify novel inhibitors of flaviviral CE activity, we employed our fluorescence polarization assay to test the ability of small molecules to compete with GTP for the CE GTP-binding site. The screening was completed at the NRSB screening facility housed at Harvard Medical School. We examined the effects of 46 323 small-molecule compounds. The molecules were obtained from multiple vendors (see Materials and Methods for details) and selected for both chemical diversity and drug-likeness.31 The screen was performed in duplicate with a final compound concentration of 12.5 μg/mL. From the compounds tested, we identified 60 compounds as hits, representing a hit rate of 0.13%. Hits are described as compounds shown to inhibit CE GTP binding in both FP duplicates with less than 20% variation between samples with no increase in total fluorescence. Eleven strong (>30% inhibition), 11 medium (20%–30% inhibition), and 38 weak hits (10%–20% inhibition) were identified representing 0.024%, 0.024%, and 0.082%, respectively, of the compounds tested (Table 2). Hit selection criteria were determined following completion of data collection.
Table 2.
Overview of the Statistical Data for the Pilot Screen
| Compounds tested | 46 323 | Total hits | 60 |
| Average Z′ | 0.82 ± 0.04 | Overall hit rate | 0.13% |
| Overall repeat rate | 65.0% |
| Hit | Screen, % (n) | Cherry Pick, % (n) | %Repeat | |
|---|---|---|---|---|
| Strong | >30% | 0.024 (11) | 0.019 (9) | 82 |
| Medium | 20%–30% | 0.024 (11) | 0.013 (6) | 55 |
| Weak | 10%–20% | 0.082 (38) | 0.052 (24) | 63 |
For validation, samples of the compounds identified by the screening process as able to compete with GTP were reanalyzed using different instrumentation. The compounds of interest were provided by NRSB (1.2 μL each of a 5-mg/mL DMSO stock). Because of the limited amount of material, each sample was diluted to 2.5 mM and 500 μM and tested at 50 μM and 10 μM for GTP–BODIPY displacement activity. Briefly, 1 μL of each diluted compound was added to a 49-μL CE–GTP–BODIPY premix and incubated for 1 h, and FP and total fluorescence values were determined. Compounds that reduced FP signal with values similar to that observed in the screen compared to DMSO controls without increasing total fluorescence values were considered repeating hits (Table 2). The overall repeat rate for all compounds was 65% with repeat rates of 82%, 55%, and 63% for the strong, medium, and weak hits, respectively. As expected, the strong hits had the highest repeat rate (82%) with both the medium and weak repeat rate exceeding 55% (Table 2).
Determination of apparent Ki values
Compounds that repeated and were considered drug-like were purchased from commercial sources (if available). From various vendors, 5 mg each of 22 compounds was ordered, and the apparent Ki for each compound was determined against YF and DEN2 CE proteins as described in the Materials and Methods section. Of the 22 compounds purchased from commercial vendors, a total of 14 compounds had Ki values of less than 100 μM, with 8 compounds showing apparent Ki values less than 10 μM using both FP and total fluorescence signals to calculate binding affinity. Structural details of the compounds, vendor information, apparent Kis (calculated both from fluorescence polarization and total fluorescence reads), and Ki Hill slopes are provided (Table 1). Importantly, compounds tended to affect both YF and DEN2 CE in similar manners, indicating that inhibitory compounds targeting the GTP binding site may be inhibitors of multiple flavivirus CE proteins.
Validation of compound activity
To confirm the activity of the compounds identified as potential CE inhibitors, we developed a second, functional assay independent of the FP-based GTP-binding assay. An intermediate in the formation of the 5′ cap 1 structure is a GMP–protein adduct, in which GMP is covalently linked to the guanylyltransferase prior to GMP transfer to a diphosphorylated RNA.14,17 Formation of this guanylated protein intermediate is necessary for the capping reaction to occur. Thus, by inhibiting the formation of this GMP–protein adduct, inhibition of the overall reaction can be inferred. The guanylation inhibition assay uses a GTP molecule fluorescently labeled from the guanine ring (8-[(6-amino)hexyl]-amino-GTP), allowing the visualization of the formation of the protein–GMP adduct in a sensitive and reproducible manner on SDS-PAGE gels without the use of radioactivity.
We determined the guanylation inhibition IC50 for all compounds that exhibited greater than 20 μM affinity in the fluorescence polarization assay against the DEN CE (Table 1 and Fig. 2A,B).
FIG. 2.

Inhibition of capping enzyme (CE) guanosine monophosphate (GMP)–protein adduct formation by hit compounds. (A) Guanylation inhibition orthogonal assay with compound 5660163. Example of a polyacrylamide gel electrophoresis (PAGE) gel showing the inhibition of CE guanylation by compound 5660163. Lane 1 is an H2O control, and lane 2 is a 1% DMSO control. Lanes 3 to 8 contain 1% DMSO and 200 μM (lane 3), 100 μM (lane 4), 50 μM (lane 5), 25 μM (lane 6), 10 μM (lane 7), and 2.5 μM (lane 8) of compound 5660163. Guanylation reaction conditions are described in Materials and Methods, and samples were incubated at 37 °C for 4 h, then resolved on a 12% PAGE gel. The gel was scanned on an Odyssey UV imager for the CE-ATTO-680-GMP adduct (top panel), then stained with Coomassie blue to detect total protein (bottom panel). Pixel counts for the CE-ATTO-680-GMP adduct were determined using the Odyssey UV Imager software package, and pixel counts for Coomassie blue–stained protein were determined using the Image J package (NIH) on scanned gels. Percent guanylation for each sample is calculated by normalizing each control and sample for protein concentration based on Coomassie blue staining, and then the equation [(normalized sample/normalized DMSO control) × 100%] was applied for each sample. Each compound was tested at least three times, and the averages and standard deviations were plotted to generate a dose–response curve (B).
DISCUSSION
Generally speaking, steady-state FP assays are fast and sensitive with low background and are therefore conducive to high-throughput format.44 On the basis of this knowledge, we have established an FP assay that is fast, reliable, and, as demonstrated by the pilot screen discussed, sufficiently robust for use for the future screening of additional chemical libraries. Initial validation of the FP assay (see Assay Optimization and Validation) provided the following evidence for the appropriateness of the assay in terms of identifying inhibitors of the CE enzyme: (1) both enzymes have similar binding characteristics, (2) the attachment of the fluorophore does not affect binding to the CE binding site, and (3) the expected selectivity for GTP over ATP is observed.
To explore the vigor of the assay conditions, we performed an analysis of the Z′. With a cutoff Z′ factor >0.5 indicative of an assay appropriate for HTS, the obtained overall average Z′ factor for the screen >0.80 suggests an extremely robust and dependable assay. Noticeably, the Z′ factor decreased during the second screening session of day 2 (Fig. 1). Throughout this session, the amplitude of the negative versus positive control signals in the assay decreased in a manner consistent with the decrease observed for the Z′ factor (Fig. 1). The limits of the assay were determined by the GTP–BODIPY association with the CE in the presence and absence of 10 μM GTP. During this screening session, it was possible that the GTP was at an incorrect concentration as there is a noticeable difference in the inhibitory effects of GTP as compared to the first screening session of day 2 (data not shown). The average mP value of inhibition with 10 μM GTP during the first session was 42.4 ± 5.19, whereas inhibition decreased markedly with 10 μM GTP, equaling only 81.8 ± 6.09 in the second session. It is important to note that the Z′ remained >0.69 throughout the second screening session on day 2, and the average Z′ of all plates analyzed during this screening session was 0.76. These data indicated that the assay remained sufficiently robust throughout this screening session to tolerate a degree of potential experimental error. This assumption is confirmed as the repeatability of the hits identified during day 2 remained consistent with the overall repeatability for the entire screen. GTP was used at a 2000-fold excess of the Ki to define maximal competition with GTP–BODIPY, and at this concentration, mP values for GTP competition are generally indistinguishable from the mP values associated with free GTP–BODIPY (data not shown). Therefore, for subsequent validation assays and in future screens, the lower limit of the assay (complete inhibition) will continue to be determined by the mP values associated with GTP-mediated displacement of GTP–BODIPY from the CE as well as free GTP–BODIPY, and Z′ monitoring will be performed to detect potential experimental error in each plate.
A novel protein guanylation assay was also developed and used as an orthogonal assay to identify false positives and demonstrate that inhibitors interfere with the enzymatic function of the CE. Two compounds (5660163 and 7871678) showed dose-dependent inhibition and IC50 values similar to the GTP displacement Ki values. Compounds BAS 01211690, 7972338, and BAS 01531205 showed weaker inhibition of guanylation than was observed with the GTP displacement assay. Compounds GK 02514 and 5406174 both resulted in strong aggregation of protein on gel as observed by Coomassie blue staining (data not shown), indicating that the compounds were precipitating or aggregating the protein.
The inhibitors identified as a result of the pilot screen are chemically diverse and appear to mimic the essential binding site associations used by GTP. Furthermore, the pilot screen has identified two novel chemical core compounds that both have an affinity greater or equal to that of the only known CE inhibitor, ribavirin triphosphate.21 We have previously solved structures of the CE enzyme from both DEN2 and YF bound with GTP and the cofactor S-adenosyl homocysteine and described the important interactions involved in GTP binding.13 GTP is predicted to use a number of hydrogen bonding interactions (Table 3), and both hydrophobic interactions and π/π stacking with the aromatic side chain of Phe24 (YF numbering) also appear to influence affinity. The HTS assay applied here is designed to identify inhibitors based on their ability to directly compete with GTP. We applied computational docking and scoring methodology to explore possible interactions between hit compounds and the GTP binding site of the YF CE. Compounds able to compete with GTP for the binding site appear to enter into hydrophilic and hydrophobic interactions with residues previously identified as important for GTP association (Table 3 and Fig. 3). The orientation of small-molecule compounds in association with GTP is representative of residue interactions and of the relative orientations observed for active compounds identified as a result of the screen. Interestingly, the orientation of the docked compounds suggests that aromatic ring systems with solvent-exposed functional groups are tolerated by the CE. Cellular guanosine binding proteins may not bind well to these molecules as the mode of association for guanine binding to cellular enzymes makes use of interactions on both sides of the guanine ring to stabilize binding. If true, this may provide a mode of improved specificity of compounds for the flavivirus CE and result in reduced cytotoxic effects. RNA viruses such as flaviviruses are prone to mutation due to low fidelity of their RNA-dependent RNA polymerases and as such may mutate rapidly in the presence of an antiviral compound. Because the residues in the targeted GTP-binding region are very well conserved, it is important that inhibitors use interaction with the binding site residues identified as essential for GTP association to minimize the likelihood of resistance becoming a major problem. As discussed above, many of the important conserved interactions in GTP binding appear to be conserved in compound binding (Table 3 and Fig. 3), suggesting that the establishment of resistance to compounds binding to this site could also decrease the affinity of GTP.
Table 3.
Interactions between YF CE and the GTP Cap Structure13
| GTP Cap | Interaction | YF Mtase | Inhibitor Interaction, % |
|---|---|---|---|
| Base | π/π stacking | Phe 24 | 90 |
| N1 | H2O bridge | Leu 19 (backbone) | |
| exocyclic N | H bond | Leu 16 (backbone) | 10 |
| H bond | Leu 19 (backbone) | 0 | |
| C2′-hydroxyl | H bond | Lys 13 (side chain) | 70 |
| H bond | Asn 17 (side chain) | 20 | |
| C3′-hydroxyl | H bond | Lys 13 (side chain) | 70 |
| α-phosphate | H bond | Ser 215 (side chain) | 20 |
| β-phosphate | H bond | Ser 150 (side chain) | 10 |
| γ-phosphate | H bond | Arg 213 (side chain) | 0 |
CE, capping enzyme; GTP, guanosine triphosphate.
FIG. 3.

A representative molecule (5660163) shown along with the YF virus capping enzyme (CE) protein. The left panel provides a three-dimensional visualization of the molecules bound within the YF guanosine triphosphate (GTP) binding site (images developed with PyMOL). Small molecule: carbon, green; nitrogen, blue; oxygen, red; and hydrogen, white. For protein surface and residues: carbon, gray; nitrogen, blue; oxygen, red; and hydrogen, white. The right panel provides a two-dimensional “flatland” image with potential interactions indicated. Hydrogen bonds are represented with a dotted green line and π/π stacking interactions with a dash-dot magenta line.
The work presented here further validates the flavivirus CE as an important antiviral drug target and represents the first step toward the discovery and characterization of potent and selective inhibitors as potential antiviral agents toward flaviviruses.
Acknowledgments
High-throughput screening capability was provided by the National Screening Laboratory for the Regional Centers of Excellence in Biodefense and Emerging Infectious Diseases (NIAID U54 AI057159). We thank Su Chaing and the staff at the NERCE National Screening Laboratory (NSRB) for assistance in performing the high-throughput screening and post-screen analysis. This work was supported by a grant from the Rocky Mountain Regional Center for Excellence (RMRCE) to BG and SK (NIAID U54 AI065357).
References
- 1.Rigau-Pérez JG, Gubler DJ, Vorndam AV, Clark GG, Dengue A Literature Review and Case Study of Travelers from the United States 1986–1994. J Travel Med. 1997;4:65–71. doi: 10.1111/j.1708-8305.1997.tb00782.x. [DOI] [PubMed] [Google Scholar]
- 2.Centers for Disease Control and Prevention. Dengue: Entomology/Ecology. http://www.cdc.gov/dengue/entomologyEcology/index.html.
- 3.Nishiura H, Halstead SB. Natural History of Dengue Virus (DENV)1 and DENV4 Infections: Reanalysis of Classic Studies. J Infect Dis. 2007;195:1007–1013. doi: 10.1086/511825. [DOI] [PubMed] [Google Scholar]
- 4.Guzman A, Istúriz RE. Update on the Global Spread of Dengue. Int J Antimicrob Agents. 2010;36(Suppl 1):S40–42. doi: 10.1016/j.ijantimicag.2010.06.018. [DOI] [PubMed] [Google Scholar]
- 5.Centers for Disease Control and Prevention. Dengue. http://www.cdc.gov/dengue/
- 6.Wang QY, Patel SJ, Vangrevelinghe E, Xu HY, Rao R, Jaber D, Schul W, Gu F, Heudi O, Ma NL, et al. A Small-Molecule Dengue Virus Entry Inhibitor. Antimicrob Agents Chemother. 2009;53:1823–1831. doi: 10.1128/AAC.01148-08. [DOI] [PMC free article] [PubMed] [Google Scholar]
- 7.Zhou Z, Khaliq M, Suk JE, Patkar C, Li L, Kuhn RJ, Post CB. Antiviral Compounds Discovered by Virtual Screening of Small-Molecule Libraries against Dengue Virus E Protein. ACS Chem Biol. 2008;3:765–775. doi: 10.1021/cb800176t. [DOI] [PMC free article] [PubMed] [Google Scholar]
- 8.Noueiry AO, Olivo PD, Slomczynska U, Zhou Y, Buscher B, Geiss B, Engle M, Roth RM, Chung KM, Samuel M, et al. Identification of Novel Small-Molecule Inhibitors of West Nile Virus Infection. J Virol. 2007;81:11992–12004. doi: 10.1128/JVI.01358-07. [DOI] [PMC free article] [PubMed] [Google Scholar]
- 9.Mueller NH, Pattabiraman N, Ansarah-Sobrinho C, Viswanathan P, Pierson TC, Padmanabhan R. Identification and Biochemical Characterization of Small-Molecule Inhibitors of West Nile Virus Serine Protease by a High-Throughput Screen. Antimicrob Agents Chemother. 2008;52:3385–3393. doi: 10.1128/AAC.01508-07. [DOI] [PMC free article] [PubMed] [Google Scholar]
- 10.Goodell JR, Puig-Basagoiti F, Forshey BM, Shi PY, Ferguson DM. Identification of Compounds with Anti–West Nile Virus Activity. J Med Chem. 2006;49:2127–2137. doi: 10.1021/jm051229y. [DOI] [PubMed] [Google Scholar]
- 11.Puig-Basagoiti F, Tilgner M, Forshey BM, Philpott SM, Espina NG, Wentworth DE, Goebel SJ, Masters PS, Falgout B, Ren P, et al. Triaryl Pyrazoline Compound Inhibits Flavivirus RNA Replication. Antimicrob Agents Chemother. 2006;50:1320–1329. doi: 10.1128/AAC.50.4.1320-1329.2006. [DOI] [PMC free article] [PubMed] [Google Scholar]
- 12.Cleaves G, Dubin D. Methylation Status of Intracellular Dengue Type 2 40 S RNA. Virology. 1979;96:159–165. doi: 10.1016/0042-6822(79)90181-8. [DOI] [PubMed] [Google Scholar]
- 13.Geiss BJ, Thompson AA, Andrews AJ, Sons RL, Gari HH, Keenan SM, Peersen OB. Analysis of Flavivirus NS5 Methyltransferase Cap Binding. J Mol Biol. 2009;385:1643–1654. doi: 10.1016/j.jmb.2008.11.058. [DOI] [PMC free article] [PubMed] [Google Scholar]
- 14.Issur M, Geiss BJ, Bougie I, Picard-Jean F, Despins S, Mayette J, Hobdey SE, Bisaillon M. The Flavivirus NS5 Protein Is a True RNA Guanylyltransferase That Catalyzes a Two-Step Reaction to Form the RNA Cap Structure. RNA. 2009;15:1941–1948. doi: 10.1261/rna.1609709. [DOI] [PMC free article] [PubMed] [Google Scholar]
- 15.Turconi S, Shea K, Ashman S, Fantom K, Earnshaw DL, Bingham RP, Haupts UM, Brown MJB, Pope AJ. Real Experiences of uHTS: A Prototypic 1536-Well Fluorescence Anisotropy-Based uHTS Screen and Application of Well-Level Quality Control Procedures. J Biomol Screen. 2001;6:275–290. doi: 10.1177/108705710100600502. [DOI] [PubMed] [Google Scholar]
- 16.Wengler G, Wengler G. The NS2 Nonstructural Protein of Flaviviruses Contains an RNA Triphosphatase Activity. Virology. 1993;197:265–273. doi: 10.1006/viro.1993.1587. [DOI] [PubMed] [Google Scholar]
- 17.Bisaillon M, Lemay G. Viral and Cellular Enzymes Involved in Synthesis of mRNA Cap Structure. Virology. 1997;236:1–7. doi: 10.1006/viro.1997.8698. [DOI] [PubMed] [Google Scholar]
- 18.Benarroch D, Selisko B, Locatelli GA, Maga G, Romette JL, Canard B. The RNA Helicase, Nucleotide 5′-Triphosphatase, and RNA 5′-Triphosphatase Activities of Dengue Virus Protein NS3 are Mg2+-Dependent and Require a Functional Walker B Motif in the Helicase Catalytic Core. Virology. 2004;328:208–218. doi: 10.1016/j.virol.2004.07.004. [DOI] [PubMed] [Google Scholar]
- 19.Dong H, Ren S, Zhang B, Zhou Y, Puig-Basagoiti F, Li H, Shi PY. West Nile Virus Methyltransferase Catalyzes Two Methylations of the Viral RNA Cap through a Substrate-Repositioning Mechanism. J Virol. 2008;82:4295–4307. doi: 10.1128/JVI.02202-07. [DOI] [PMC free article] [PubMed] [Google Scholar]
- 20.Assenberg R, Ren J, Verma A, Walter TS, Alderton D, Hurrelbrink RJ, Fuller SD, Bressanelli S, Owens RJ, Stuart DI, et al. Crystal Structure of the Murray Valley Encephalitis Virus NS5 Methyltransferase Domain in Complex with Cap Analogues. J Gen Virol. 2007;88:2228–2236. doi: 10.1099/vir.0.82757-0. [DOI] [PubMed] [Google Scholar]
- 21.Benarroch D, Egloff MP, Mulard L, Guerreiro C, Romette JL, Canard B. A Structural Basis for the Inhibition of the NS5 Dengue Virus mRNA 2′-O-Methyltransferase Domain by Ribavirin 5′-Triphosphate. J Biol Chem. 2004;279:35638–35643. doi: 10.1074/jbc.M400460200. [DOI] [PubMed] [Google Scholar]
- 22.Egloff MP, Benarroch D, Selisko B, Romette JL, Canard B. An RNA Cap (nucleoside-2[prime]-O-)-Methyltransferase in the Flavivirus RNA Polymerase NS5: Crystal Structure and Functional Characterization. EMBO J. 2002;21:2757–2768. doi: 10.1093/emboj/21.11.2757. [DOI] [PMC free article] [PubMed] [Google Scholar]
- 23.Egloff MP, Decroly E, Malet H, Selisko B, Benarroch D, Ferron F, Canard B. Structural and Functional Analysis of Methylation and 5′-RNA Sequence Requirements of Short Capped RNAs by the Methyltransferase Domain of Dengue Virus NS5. J Mol Biol. 2007;372:723–736. doi: 10.1016/j.jmb.2007.07.005. [DOI] [PubMed] [Google Scholar]
- 24.Bhattacharya D, Ansari IH, Striker R. The Flaviviral Methyltransferase Is a Substrate of Casein Kinase 1. Virus Res. 2009;141:101–104. doi: 10.1016/j.virusres.2009.01.002. [DOI] [PMC free article] [PubMed] [Google Scholar]
- 25.Ray D, Shah A, Tilgner M, Guo Y, Zhao Y, Dong H, Deas T, Zhou Y, Li H, Shi P. West Nile Virus 5′-Cap Structure Is Formed by Sequential Guanine N-7 and Ribose 2′-O Methylations by Nonstructural Protein 5. J Virol. 2006;80:8362–8370. doi: 10.1128/JVI.00814-06. [DOI] [PMC free article] [PubMed] [Google Scholar]
- 26.Zhou Y, Ray D, Zhao Y, Dong H, Ren S, Li Z, Guo Y, Bernard K, Shi PL. Structure and Function of Flavivirus NS5 Methyltransferase. J Virol. 2007;81:3891–3903. doi: 10.1128/JVI.02704-06. [DOI] [PMC free article] [PubMed] [Google Scholar]
- 27.Geiss BJ, Stahla H, Hannah AM, Gari HH, Keenan SM. Focus on Flaviviruses: Current and Future Drug Targets. Future Med Chem. 2009;1:327–344. doi: 10.4155/fmc.09.27. [DOI] [PMC free article] [PubMed] [Google Scholar]
- 28.Hu G, Tsai AL, Quiocho FA. Insertion of an N7-Methylguanine mRNA Cap between Two Coplanar Aromatic Residues of a Cap-Binding Protein Is Fast and Selective for a Positively Charged Cap. J Biol Chem. 2003;278:51515–51520. doi: 10.1074/jbc.M307654200. [DOI] [PubMed] [Google Scholar]
- 29.Mazza C, Segref A, Mattaj IW, Cusack S. Large-Scale Induced Fit Recognition of an m(7)GpppG Cap Analogue by the Human Nuclear Cap-Binding Complex. EMBO J. 2002;21:5548–5557. doi: 10.1093/emboj/cdf538. [DOI] [PMC free article] [PubMed] [Google Scholar]
- 30.Niedzwiecka A, Jarcotrigiano J, Stepinski J, Jankowska-Anyszka M, Wyslouch-Cieszynska A, Dadlez M, Gingras AC, Mak P, Darzynkiewicz E, Sonenberg N, et al. Biophysical Studies of elF4E Cap-Binding Protein: Recognition of mRNA 5′ Cap Structure and Synthetic Fragments of elF4G and 4E-BP1 Proteins. J Mol Biol. 2002;319:615–635. doi: 10.1016/S0022-2836(02)00328-5. [DOI] [PubMed] [Google Scholar]
- 31.Lipinski CA. Drug-Like Properties and the Causes of Poor Solubility and Poor Permeability. J Pharmacol Toxicol Methods. 2000;44:235–249. doi: 10.1016/s1056-8719(00)00107-6. [DOI] [PubMed] [Google Scholar]
- 32.Dean R, Dixon W. Simplified Statistics for Small Numbers of Observations. Anal Chem. 1951;23:636–638. [Google Scholar]
- 33.Jones G, Willett P, Glen RC, Leach AR, Taylor R. Development and Validation of a Genetic Algorithm for Flexible Docking. J Mol Biol. 1997;267:727–748. doi: 10.1006/jmbi.1996.0897. [DOI] [PubMed] [Google Scholar]
- 34.DeLano WL. The PyMOL Molecular Graphics System. DeLano Scientific; San Carlos, CA: 2002. [Google Scholar]
- 35.Perrin F. Polarisation de la lumière de fluorescence. Vie moyenne des molécules dans l’etat excité. J Phys Radium. 1926;7:390–401. [Google Scholar]
- 36.Zhang JH, Chung TDY, Oldenburg KR. A Simple Statistical Parameter for Use in Evaluation and Validation of High Throughput Screening Assays. J Biomol Screen. 1999;4:67–73. doi: 10.1177/108705719900400206. [DOI] [PubMed] [Google Scholar]
- 37.Checovich WJ, Bolger RE, Burke T. Fluorescence Polarization: A New Tool for Cell and Molecular Biology. Nature. 1995;375:254–256. doi: 10.1038/375254a0. [DOI] [PubMed] [Google Scholar]
- 38.Hill JJ, Royer CA. Fluorescence Approaches to Study of Protein-Nucleic Acid Complexation. Methods Enzymol. 1997;278:390–416. doi: 10.1016/s0076-6879(97)78021-2. [DOI] [PubMed] [Google Scholar]
- 39.Jameson DM, Sawyer WH. Fluorescence Anisotropy Applied to Biomolecular Interactions. Methods Enzmol. 1995;246:283–300. doi: 10.1016/0076-6879(95)46014-4. [DOI] [PubMed] [Google Scholar]
- 40.Kakehi K, Oda Y, Kinoshita M. Fluorescence Polarization: Analysis of Carbohydrate-Protein Interaction. Anal Biochem. 2001;297:111–116. doi: 10.1006/abio.2001.5309. [DOI] [PubMed] [Google Scholar]
- 41.Terpetschnig E, Szmacinski H, Lakowicz JR. Long-Lifetime Metalligand Complexes as Probes in Biophysics and Clinical Chemistry. Methods Enzymol. 1997;278:295–321. doi: 10.1016/s0076-6879(97)78016-9. [DOI] [PubMed] [Google Scholar]
- 42.Jameson EE, Roof RA, Whorton MR, Mosberg HI, Sunahara RK, Neubig RR, Kennedy RT. Real-Time Detection of Basal and Stimulated G Protein GTPase Activity Using Fluorescent GTP Analogues. J Biol Chem. 2005;280:7712–7719. doi: 10.1074/jbc.M413810200. [DOI] [PubMed] [Google Scholar]
- 43.Willard FS, Kimple AJ, Johnston CA, Siderovski DP. A Direct Fluorescence-Based Assay for RGS Domain GTPase Accelerating Activity. Anal Biochem. 2005;340:341–351. doi: 10.1016/j.ab.2005.02.015. [DOI] [PubMed] [Google Scholar]
- 44.Eggeling C, Brand L, Ullmann D, Jager S. Highly Sensitive Fluorescence Detection Technology Currently Available for HTS. Drug Discov Today. 2003;8:632–641. doi: 10.1016/s1359-6446(03)02752-1. [DOI] [PubMed] [Google Scholar]