

Abstract
The aim was to investigate the propagation of Ca2+ waves between cells and determine whether this synchronizes alternating Ca2+ release between cells. Experiments were carried out on electrically coupled cell pairs; spontaneous Ca2+ waves were produced by elevating external Ca2+. There was a significant difference in the ability of these waves to propagate between cells depending on the orientation of the pairs. Although almost all pairs connected by side-to-side contacts showed propagating Ca2+ release, this was very uncommon in end-to-end cell pairs. Confocal studies showed that there was a gap at the intercalated disc consisting of cell membranes and a region of cytoplasm devoid of sarcoplasmic reticulum. This gap was 2.3 μm in length and is suggested to interfere with Ca2+ wave propagation. The gap measured was much smaller between side-to-side contacts: 1.5 μm and so much less likely to interfere with propagation. Subsequent experiments investigated the synchronization between cells of Ca2+ alternans produced by small depolarizing pulses. Although this alternation results from beat-to-beat alternation of intracellular Ca2+ wave propagation, there was no evidence that propagation of Ca2+ waves between cells contributed to synchronization of this alternans.
Key points
In cell pairs isolated from rat ventricular muscle, spontaneous waves of Ca2+-induced Ca2+ release are much more likely to propagate between cells connected side to side than end to end.
Investigation of this difference using fluorescence techniques shows that the end-to-end connection probably contains the intercalated disc. It is this structure that accounts for the greater distance between sarcoplasmic reticulum Ca2+ release units being so large (about 2.3 μm). At side-to-side connections, this distance is much less (about 1.6 μm). This variation may be the cause of the difference in propagation properties.
In cell pairs isolated from rat ventricular muscle, we have been able to induce systolic Ca2+ alternans in-phase between the cells in a pair. This is not due to propagation of Ca2+ waves between cells. In some cases, wave propagation can interfere with synchrony.
Introduction
Ca2+ release from the cardiac sarcoplasmic reticulum (SR) normally occurs by the process of Ca2+-induced Ca2+ release (CICR) in which calcium entering the cell via the L-type Ca2+ channel binds to the SR Ca2+ release channel (ryanodine receptor, RyR) resulting in opening of the RyR and further release of Ca2+ from the SR. Under conditions when the cell and SR are overloaded with Ca2+, release from the SR can occur in the absence of the triggering L-type channel. This occurs as a wave of CICR that propagates along the cell. These Ca2+ waves activate the electrogenic Na+–Ca2+ exchange (NCX) and the resulting depolarization has been shown to trigger arrhythmias (see Venetucci et al. 2008 for review).
Given that Ca2+ waves can propagate along a cell, it is of interest to know whether this can also occur via gap junctions between cells. In several studies Ca2+ waves pass between cells although rather unreliably (Takamatsu et al. 1991; Minamikawa et al. 1997; Lamont et al. 1998; Miura et al. 1999; Kaneko et al. 2000; Klauke et al. 2007). The major aim of this paper was therefore to investigate propagation of waves between cells in a pair.
Recent work shows that propagation of Ca2+ waves within a single cell can contribute to instability in controlling the amplitude of the systolic Ca2+ transient. When cells are stimulated with small depolarizing pulses, there is a beat-to-beat alternation in the amplitude of the Ca2+ transient. This arises because the larger responses involve propagation of Ca2+ waves whereas propagation fails on the smaller ones (Díaz et al. 2004; Li et al. 2009). As well as its relevance to the control of stability per se, this alternation of SR Ca2+ release may play a role in the generation of pulsus alternans, which is a complication of heart failure that has a poor prognosis for the patient as it is strongly associated with sudden cardiac death (see Weiss et al. 2006 for review). Given that propagation of Ca2+ waves within a cell can result in alternans, the question arises as to whether propagation between cells can lead to co-ordinated alternans of multicellular structures, and answering this was the other aim of the paper.
In this paper, we therefore attempt to define whether Ca2+ waves can propagate between cells. We find that the ease with which Ca2+ waves can propagate from cell to cell depends critically on whether the cells are connected side to side or end to end. In turn, the ease of propagation depends on the ultrastructure of the connections with the gap between SR Ca2+ release units being critical. We also find that the propagation of Ca2+ waves does not contribute to the synchronization of alternans between cells.
Methods
Cell pairs were isolated from male Wistar rats using a modification of a published method (Eisner et al. 1989). This modification involved adding bovine serum albumin (1 mg ml−1) to the isolation solution and increasing times in the enzyme solution. Rats were grown to a weight above 350 g before they were killed; at this weight the success of isolating cell pairs was greater than at lower weights. All procedures were in accordance with the Animals (Scientific Procedures) Act 1986.
Voltage clamp experiments
Cells were bathed in a control solution (in mm): NaCl 134, Hepes 10, glucose 11.1, MgCl2 1.2, KCl 4 and CaCl2 1. For voltage clamp experiments we used the perforated patch clamp technique (Rae et al. 1991) with the switch clamp mode of the Axoclamp 2A voltage clamp amplifier (Axon Instrument, Union City, CA, USA). Pipettes (<5 MΩ) were filled with the following solution (mm): KCH3O3S 125, KCl 12, NaCl 10, Hepes 10, MgCl2 5, EGTA 0.1; titrated to pH 7.2 with KOH; and a final concentration of amphotericin B of 240 μg ml−1. External Ca2+ was raised to 4 mm; 0.1 mm Ba2+ and 5 mm 4-aminopyridine were added to block K+ currents. Cells were stimulated by depolarizations from −40 mV to the required level between −30 and −20 mV to produce alternans of systolic release. To measure intracellular Ca2+, cells were loaded with the acetoxymethyl ester of fluo-3 (5 μm for 10 min at room temperature). Once a cell in a pair was patched, the voltage clamp was applied and measurement of images began. Light from the xenon arc lamp was filtered at 488 nm and fluorescence images (>500 nm) recorded at 30 Hz using a LucaEM Andor Camera System (Belfast, UK). Images were analysed using Andor software and ImageJ (http://rsbweb.nih.gov/ij/).
Visualization of membranes and sarcoplasmic reticulum
Visualization of cell membranes and SR was performed using a Leica SP2 confocal microscope. Cell pairs were incubated with Di-8 ANEPPS (5 μm for 5 min at 20°C) to show surface membranes and transverse tubules and ER-Tracker Green (500 nm for 30 min at 37°C) to show SR location. Both dyes were obtained from Invitrogen (Paisley, UK). Fluorescence from both dyes was excited at 488 nm. Emitted light was measured between 500 and 540 nm for ER-Tracker and 625 and 700 nm for Di-8 ANEPPS.
Statistics
All statistics reported are mean ± SEM. We have used Student's paired or unpaired t tests, chi squared or Mann–Whitney tests, as appropriate.
Results
All data in this paper come from electrically coupled cell pairs. We tested for electrical coupling by voltage clamping one cell of a pair and depolarizing it to determine if a Ca2+ release took place in both cells. Figure 1 shows typical data recorded from a pair of cells connected side to side. Here cell 1 was voltage clamped with a voltage pulse to 0 mV from −40 mV. The systolic Ca2+ transient was identical in both cells of the pair (Fig. 1B).
Figure 1. Ca2+ transients recorded from a pair of coupled cells.
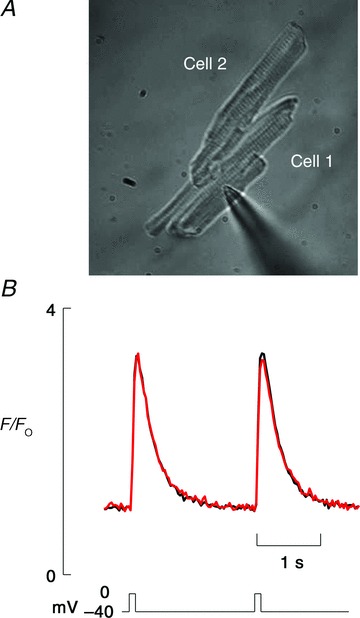
Voltage clamping one cell effectively clamps both cells. A, image of cell pair in the side-to-side configuration. B, corresponding fluorescence traces taken from each of cells in the image. Depolarizing pulse was from −40 to 0 mV for 100 ms. Black trace is from cell 1 and red from cell 2.
Do calcium waves pass between cells?
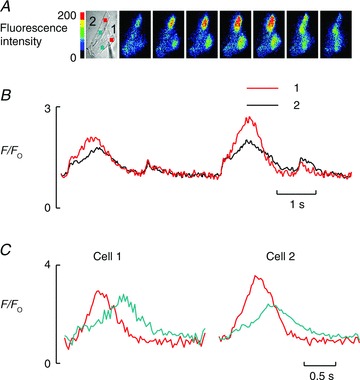
In this series of experiments, we investigated whether spontaneous Ca2+ waves could propagate between cells. Experiments showed that the result depended on the physical relationship between the two cells. Some cells (e.g. Fig. 2A) were connected side to side and the actual degree of overlap of the lateral membranes was variable; others (e.g. Fig. 2B) were connected via their ends. The images in Fig. 2A show an example of a spontaneous wave of CICR passing from one cell to another via a side-to-side configuration junction. The wave begins in the lower part of the upper cell but very quickly passes to the lower cell with barely any detectable delay. However, wave propagation occurred only very rarely between cells connected end to end (e.g. Fig. 2B). In this case, two independent waves begin in each cell but both stop at the same point, presumably the intercalated disc between the cells. Summary data for this propagation behaviour are shown in the histogram in Fig. 2C. Fluorescence movies of the cell pairs in Fig. 2 can be seen in the supplementary data; these show the real-time propagation of CICR in these cells.
Figure 2. Wave propagation between cells.
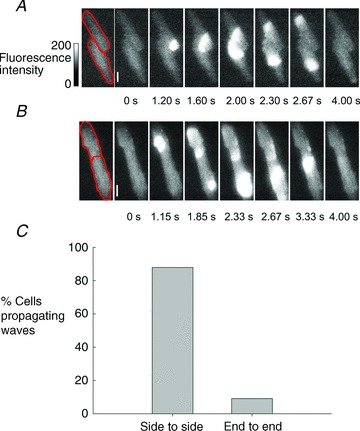
A, cells connected side to side. Spontaneous Ca2+ wave starts in the lower part of upper cell then spreads to the lower cell and propagates through both. The full-time course can be seen in Supplementary Movie 1. B, cells connected end to end. In this example, independent, spontaneous waves start in the two cells but do not propagate between them. The full-time course can be seen in Supplementary Movie 2. C, summary data showing proportion of cells showing propagation. Times under each image show when image was recorded.
In subsequent experiments, we investigated whether the probability of intercellular wave propagation in either configuration depended on the degree of Ca2+ overload. The experiment in Fig. 3 shows recordings of Ca2+ waves from regions of two cells connected side to side. In the top panel of Fig. 3A the superfusion solution contained 1 mm Ca2+. Here the first wave did not propagate whereas the second one did. In the lower panel, external Ca2+ was increased to 6 mm. The most obvious effect is an increase in the frequency of Ca2+ waves (Díaz et al. 1997). Here the first wave arose in the cell indicated with the dashed line and then propagated to the other. The third wave propagated in the other direction. The second wave arose at the same time in both cells. Figure 3B shows the fraction of waves that propagated during 66 s observation periods in six cells over a range of Ca2+ from 1 to 6 mm. There is no significant effect of external Ca2+ concentration on the fraction of waves that propagate (one-way ANOVA). We performed similar experiments on seven cells connected end to end. In none of these cells did wave propagation occur at any of the Ca2+ concentrations used (not shown). In these end-to-end cells, we also investigated whether potentiating the RyR would allow propagation. We found, however, that 100 μm caffeine did not promote propagation. Similarly, beta-adrenergic stimulation with 1 μm isoprenaline did not result in propagation.
Figure 3. Lack of effect of changing external Ca2+ concentration on the probability of propagation of waves between side-to-side connected cells.
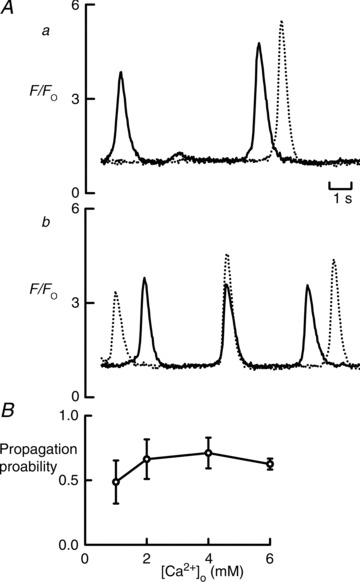
A, original data. Solid trace shows fluorescence from a region of interest in one cell and dashed from the other cell. Trace a was recorded in 1 mm Ca2+ and b in 6 mm. B, mean probability of propagation as a function of external Ca2+ concentration for six cell pairs.
Why does propagation fail in the end-to-end configuration?
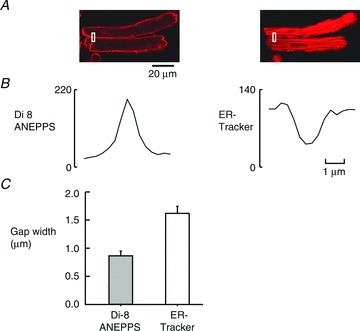
We investigated the reason for the different CICR wave propagation properties of the two pair configurations. Our hypothesis was that the intercalated disc formed a barrier to propagation of CICR preventing passage of the wave. We used ER-Tracker Green to show the distribution of SR and the sarcolemma was identified by the membrane-staining dye Di-8 ANEPPS. A sample (end-to-end) cell pair loaded with both dyes is illustrated in Fig. 4A. The lower part of Fig. 4A shows the fluorescence from Di-8 ANEPPS indicating staining of the intercalated disc with other surface membranes also visible. The graph in Fig. 4Ba shows the profile of the stain intensity along the cell interior, from the white rectangle on the left, showing a sarcomeric pattern in both stains, with a periodicity of 1.81 ± 0.02 μm (n = 18). However, it is clear that the two stains are exactly out of phase with each other. This is to be expected as the membrane dye stains t-tubules and the ER dye shows the location of the SR; however, these two structures are never found in the same place. In the right-hand plots (Fig. 4Bb), we see the spatial location of fluorescence across the end-to-end junction in the cell pair shown in the green rectangles in the centre of the images in Fig. 4A. Here the two dyes are again found in different parts of the images. The membrane dye shows the location of the intercalated disc, the SR is not associated with this part of the image.
Figure 4. The area of the intercalated disc lacks sarcoplasmic reticulum.
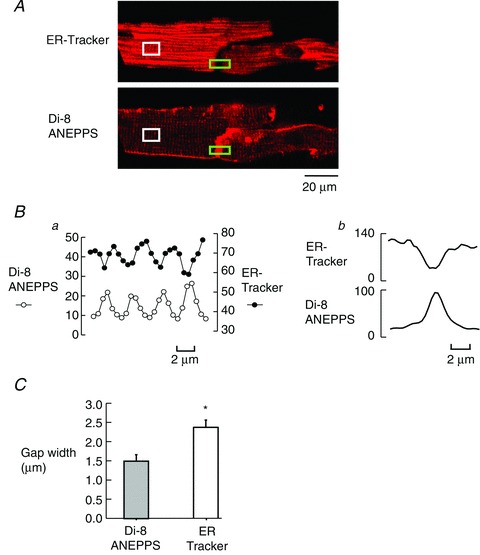
A, images of ER-Tracker (above) and Di-8 ANEPPS (below). Ba, plots showing fluorescence measured from the region of interest marked by white rectangle along the sarcomeric pattern to the left in each image. b, the spatial profiles of fluorescence across the intercalated disc at the points indicated by the green rectangles. C, summary data for 12 cell pairs of gap widths at end-to-end junctions in both membrane and ER dyes. *P = 0.001.
In Fig. 4C the region of membrane staining is smaller than the gap between cells stained with ER-Tracker; on average the gap between the SR staining had a half distance of 2.35 ± 0.19 μm (n = 12) and the membrane half distance was 1.48 ± 0.17 μm in the same cell pairs. This is a statistically significant difference (P = 0.001). Such an area lacking SR would be a barrier to propagation.
Figure 5A shows that the side-to-side junction between cells is narrower than the intercalated disc observed in end-to-end junctions. Staining is quantified in Fig. 5B from the regions indicated by rectangles in Fig. 5A. Again, the membrane dye shows a narrower staining than the ER-Tracker dye.
Figure 5. Thicknesses of membranes between cells.
A, Di-8 ANEPPS and ER-Tracker-labelled cell pair showing the measurements made of side to side. B, these plots show the fluorescence intensities for the two regions contained within rectangles on image above. NB The distances shown in B represent the vertical dimension in A. C, summary data for nine cell pairs, *P = 0.002.
There is also a significant difference between end membranes and side-to-side membranes, i.e. the side-to-side membrane is thinner at 0.86 ± 0.08 μm than the membrane at the end of the cell (1.48 ± 0.17 μm; Mann–Whitney test P < 0.002). In addition, the gap measured using ER-Tracker is also significantly greater at the intercalated disc (2.35 ± 0.19 μm) as against the thickness measured at the side-to-side junctions (1.59 ± 0.14 μm; P = 0.006). We will discuss the appropriateness of our side-to-side membrane measurements in the discussion but the physiological significance of these measurements is clear: the ability of propagation to cross from side to side is very likely due to the much smaller gap between the SR units either side of the membranes.
Alternans of systolic calcium release in cell pairs
The aim of this series of experiments was to see to what extent the alternation in the amplitude of the systolic Ca2+ transient produced by small depolarizing pulses was co-ordinated between cells in a pair, and whether there was evidence for propagation of Ca2+ waves between cells playing a role. The data in Fig. 6 show that alternans occurs in cell pairs under appropriate conditions. Both panels show recordings from a pair of cells; on the left, the cells are connected end to end whereas on the right they are side to side. In both cases, one cell is patched and depolarized under conditions of slight Ca2+ overload (4 mm external Ca2+ concentration). In both cells in the pair, one stimulus produces a large release of calcium and the next a small one. The larger release also has a much longer duration than the smaller one (cf. Fig. 8) indicating wave propagation. In other words the alternans observed in cell pairs is very similar to that seen previously in single cells (Díaz et al. 2004; Li et al. 2009)
Figure 6. Alternans produced by small depolarizing pulses.
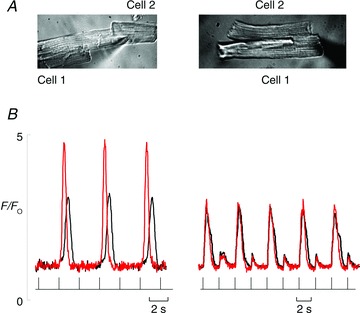
A and B, the upper panel shows an image of the cells and patch pipette and the bottom shows superimposed recordings of fluo-3 fluorescence from the two cells. A, a pair of cells connected end to end, stimulated by depolarizing pulses from −40 to −23 mV (bottom trace shows when each stimulus was applied). B, a pair of cells connected side to side stimulated by a pulse from −40 mV to −25 mV. The red trace is from cell 1 and black line from cell 2.
Figure 8.
A, fluorescence images of cells in a side-to-side pair Ca2+-induced Ca2+ release initiation does not need to take place where cells meet. B, fluorescence traces taken from the cell pair shown in A. Each of the two cells is showing in-phase systolic alternans. C, fluorescence traces taken from the two coloured regions of interest shown in images in A. Both show clear wave propagation.
Is calcium passing through the gap junction required for alternans?
The next series of experiments was designed to investigate whether movement of Ca2+ across the gap junctions between cells was required to maintain Ca2+ alternans in pairs of cells. One line of evidence casting doubt on an obligatory role for intercellular Ca2+ waves in synchronizing alternans comes from data in Fig. 7. In this case the only Ca2+ wave recorded propagated from cell 1 into cell 2 during the Ca2+ transient marked with the asterisk (see also Supplementary Movie 3). However, this wave did not help enforce the phase of alternans rather it interferes with and decreases the magnitude of alternans in cell 2.
Figure 7. Changing pattern of alternans in the same cell pair.
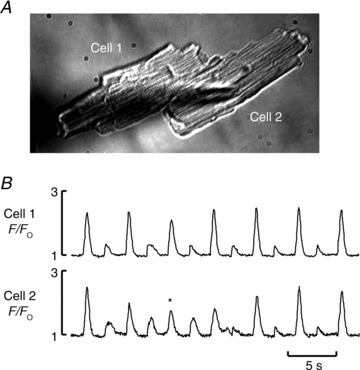
A, bright field image of the cell pair. B, fluorescence traces measured from cell 1 (Top) and from cell 2 (Bottom). Cell 1 shows classical systolic Ca2+ alternans. However, cell 2 shows that when there is propagation of Ca2+-induced Ca2+ release between the two cells (marked by the asterisk and in Supplementary Movie 3), this interferes with the alternans phase.
Another means of testing this question is shown in Fig. 8. Here the alternans is in-phase as shown in Fig. 8B; these traces indicate changes of fluorescence taken from regions that occupy the majority of each of the two cells. However, images in Fig. 8A show how these traces arose. The coloured boxes are regions of interest shown in the same colour code as the traces in Fig. 8C. It is clear that each of the two waves that produce the large release initiates at sites that are not in contact with each other (i.e. the two regions cannot be expected to influence each other). In addition, the waves do not cross from one cell into the other.
What evidence is there that alternans is in-phase in cell pairs? Of the 14 cell pairs in which we observed alternans, nine were in-phase in each cell (i.e. as in Fig. 2); in two out of phase. Finally, in three cell pairs there was one cell alternating while the other cell was giving uniform systolic Ca2+ transients. If we perform a chi-squared test to determine if there is a preference for in-phase as opposed to any other pattern of alternans the value we get is 1.92 (i.e. not sufficiently high enough to reject the null hypothesis that the alternans phase is random between the two cells in the pair; P = 0.18).
Discussion
In this paper, we have studied interactions between Ca2+ waves in pairs of cells. We find that Ca2+ waves do not propagate between pairs of cells connected end to end but, in contrast, can propagate between pairs connected side to side. The lack of propagation between cells connected end to end is associated with the gap junction providing a substantial gap between the SR of the two cells. Furthermore, we find that changes of Ca2+ in individual cells in a cell pair during systolic Ca2+ alternans do not reinforce alternans of systolic Ca2+ alternans in the other cell.
Propagation of waves of calcium-induced calcium release between cells
It has been previously reported in multicellular tissues that the probability of CICR waves passing between cells is low (Takamatsu et al. 1991; Minamikawa et al. 1997; Lamont et al. 1998; Miura et al. 1999; Kaneko et al. 2000; Klauke et al. 2007). In our study on isolated cell pairs we confirm the observation that end-to-end propagation is relatively unlikely (see Fig. 2) but, in contrast to previous work, we find that waves pass readily between cells arranged in the side-by-side configuration. We have investigated why this might be by looking at the junctions between cell pairs that can propagate waves and those that cannot. We have used the lipid marking dye Di-8 ANEPPS to show where membranes intervene between cells and find that the intercalated disc between cells forms a barrier about 1.5 μm wide between end-to-end connected cells. Furthermore, by staining with ER-Tracker Green in the same cells to visualize SR, we find a gap about 2.3 μm wide in the same location. Previous electron microscopic studies of the intercalated disc region show that the majority of gap junctions in that region are associated with sparse junctional SR (Forbes & Sperelakis, 1977, 1980). This suggests that around the intercalated disc region there ought to be a gap between cells where less SR is present. Our measurements suggest that this region extends for about 0.4 μm on either side of the disc region. The region will also include the thickness of the intercalated disc itself.
On the other hand, at the side–to-side junctions the gap due to the membrane is about 0.9 μm wide. The important point, however, is the gap between release units of the SR; we measure this as 1.6 μm. The location of the gap junction in these cell pairs is unknown as we do not measure Ca2+ in these cells but the gap between SR release units seems to be within the distance that CICR can bridge.
It is possible that it is the large length of the intercalated disc at end-to-end junctions that interferes with cell-to-cell propagation. Modelling of wave propagation predicts that propagation will fail when the sarcomere spacing is increased above normal sarcomere lengths (i.e. 1.9 μm). It is thought that propagation of spontaneous activity is prevented by the diffusion distance from one Ca2+ release unit to the next (Chen-Izu et al. 2006; Izu et al. 2006). Our measurements show that the gap between SR Ca2+ release units at the intercalated disc always exceeds this value (2.3 μm); however, the SR gap between side-to-side contacts is always much less (1.6 μm). This could explain the lack of end-to-end propagation and the much higher probability of propagation in the side-to-side contacting cells. We cannot rule out, however, the possibility that other differences in the intercalated disc region contribute to preventing propagation. For example, it is possible that Ca2+ buffering is greater in this region. Our measurements of the width of side-to-side contacts between cells are almost certainly an overestimate of the gap junction, as they will be affected by the finite depth of the images. However, the only important region for measurement is the gap junction. At this point the membrane is very thin (10–20 nm) (Sommer & Waugh, 1976; Severs, 1990) and well below the spatial resolution of the light microscope. We have selected the thinnest portion of the side-to-side membrane we could find in all the examples we use. This may well not be the gap junction but it is still a lot thinner than the membrane at the intercalated disc region and, according to the models published for wave propagation (Chen-Izu et al. 2006; Izu et al. 2006), should offer little resistance to wave propagation.
Low-voltage-induced alternans in cell pairs
Stimulation of cell pairs with small depolarizing pulses results in alternans of the Ca2+ transient. The mechanism of this alternans has previously been demonstrated (Díaz et al. 2004; Li et al. 2009). In particular (see Fig. 8) there are two phases of calcium release. The first of these represents direct CICR from the small L-type Ca2+ current and the later phase is the propagating wave of CICR that leads to the larger of the two transients. Two lines of evidence lead us to conclude that propagation of CICR between cells is not required to maintain systolic Ca2+ alternans. First, the fact that end-to-end cell pairs do not generally allow propagation of CICR but do allow in-phase alternans (see Fig. 6A). Secondly cell pairs can also show in-phase alternans when sites of initiation of the CICR waves are not close to the points of contact of the cells (see Fig. 8).
If in-phase alternans between two cells in a pair is possible without propagation of CICR there remain only two other possible mechanisms: membrane potential/ membrane current or random chance. We know that conditions favouring small releases of Ca2+ can lead to alternans. Thus, a small release can then trigger a larger propagating release; however, many cells do not show alternans in this situation. If the two cells are electrically effectively one (meaning that the small L-type Ca2+ current stimulation of Ca2+ release from the SR will be present in both cells) then it may simply be that both cells spontaneously begin to show systolic alternans at the same time. Statistical analysis of the data shows that there is no reason to believe that cells in a pair influence each other to produce systolic Ca2+ alternans.
Relationship of low-voltage-induced alternans to pulsus alternans
Clinically, pulsus alternans involves the synchronization of many cells. The fact that alternans produced by low-voltage depolarization is not synchronized between cells suggests that it is unlikely to be the major mechanism of the clinical condition.
This study has shown that systolic Ca2+ alternans is present in cell pairs isolated from rat ventricular muscle. In addition, we find no strong evidence for any influence between cells in a cell pair that can alter the phase of systolic Ca2+ alternans. We also report that propagation of CICR between cells is very frequent in side-to-side cell pairs and much less frequent between end-to-end pairs. We also propose that the intercalated disc, by excluding SR, prevents propagation of CICR while side-to-side junctions do not as the gap between SR units is much lower.
Acknowledgments
This work was supported by the British Heart Foundation.
Glossary
- CICR
Ca2+-induced Ca2+ release
- NCX
Na+–Ca2+ exchange
- RyR
ryanodine receptor
- SR
sarcoplasmic reticulum
Author contributions
The work was performed in the Unit of Cardiac Physiology, University of Manchester. D.A.E. and S.C.O. designed the project and wrote the manuscript. Y.L. performed the experiments and, with D.A.E. and S.C.O., analysed the data.
Supplementary material
Movie#1
Movie#2
Movie#3
References
- Chen-Izu Y, McCulle SL, Ward CW, Soeller C, Allen BM, Rabang C, Cannell MB, Balke CW, Izu LT. Three-dimensional distribution of ryanodine receptor clusters in cardiac myocytes. Biophys J. 2006;91:1–13. doi: 10.1529/biophysj.105.077180. [DOI] [PMC free article] [PubMed] [Google Scholar]
- Díaz ME, Trafford AW, O’Neill SC, Eisner DA. Measurement of sarcoplasmic reticulum Ca2+ content and sarcolemmal Ca2+ fluxes in isolated rat ventricular myocytes during spontaneous Ca2+ release. J Physiol. 1997;501:3–16. doi: 10.1111/j.1469-7793.1997.003bo.x. [DOI] [PMC free article] [PubMed] [Google Scholar]
- Díaz ME, O’Neill SC, Eisner DA. Sarcoplasmic reticulum calcium content fluctuation is the key to cardiac alternans. Circ Res. 2004;94:650–656. doi: 10.1161/01.RES.0000119923.64774.72. [DOI] [PubMed] [Google Scholar]
- Eisner DA, Nichols CG, O’Neill SC, Smith GL, Valdeolmillos M. The effects of metabolic inhibition on intracellular calcium and pH in isolated rat ventricular cells. J Physiol. 1989;411:393–418. doi: 10.1113/jphysiol.1989.sp017580. [DOI] [PMC free article] [PubMed] [Google Scholar]
- Forbes MS, Sperelakis N. Myocardial couplings: their structural variations in the mouse. J Ultrastruct Res. 1977;58:50–65. doi: 10.1016/s0022-5320(77)80007-5. [DOI] [PubMed] [Google Scholar]
- Forbes MS, Sperelakis N. Structures located at the levels of the Z bands in mouse ventricular myocardial cells. Tissue Cell. 1980;12:467–489. doi: 10.1016/0040-8166(80)90037-3. [DOI] [PubMed] [Google Scholar]
- Izu LT, Means SA, Shadid JN, Chen-Izu Y, Balke CW. Interplay of ryanodine receptor distribution and calcium dynamics. Biophys J. 2006;91:95–112. doi: 10.1529/biophysj.105.077214. [DOI] [PMC free article] [PubMed] [Google Scholar]
- Kaneko T, Tanaka H, Oyamada M, Kawata S, Takamatsu T. Three distinct types of Ca2+ waves in Langendorff-perfused rat heart revealed by real-time confocal microscopy. Circ Res. 2000;86:1093–1099. doi: 10.1161/01.res.86.10.1093. [DOI] [PubMed] [Google Scholar]
- Klauke N, Smith GL, Cooper JM. Microfluidic systems to examine intercellular coupling of pairs of cardiac myocytes. Lab Chip. 2007;7:731–739. doi: 10.1039/b706175g. [DOI] [PubMed] [Google Scholar]
- Lamont C, Luther PW, Balke CW, Wier WG. Intercellular Ca2+ waves in rat heart muscle. J Physiol. 1998;512:669–676. doi: 10.1111/j.1469-7793.1998.669bd.x. [DOI] [PMC free article] [PubMed] [Google Scholar]
- Li Y, Diaz ME, Eisner DA, O’Neill SC. The effects of membrane potential, SR Ca content and RyR responsiveness on systolic Ca alternans in rat ventricular myocytes. J Physiol. 2009;587:1283–1292. doi: 10.1113/jphysiol.2008.164368. [DOI] [PMC free article] [PubMed] [Google Scholar]
- Minamikawa T, Cody SH, Williams DA. In situ visualization of spontaneous calcium waves within perfused whole rat heart by confocal imaging. Am J Physiol Heart Circ Physiol. 1997;272:H236–H243. doi: 10.1152/ajpheart.1997.272.1.H236. [DOI] [PubMed] [Google Scholar]
- Miura M, Boyden PA, ter Keurs HE. Ca2+ waves during triggered propagated contractions in intact trabeculae. Determinants of the velocity of propagation. Circ Res. 1999;84:1459–1468. doi: 10.1161/01.res.84.12.1459. [DOI] [PubMed] [Google Scholar]
- Rae J, Cooper K, Gates P, Watsky M. Low access resistance perforated patch recordings using amphotericin B. J Neurosci Methods. 1991;37:15–26. doi: 10.1016/0165-0270(91)90017-t. [DOI] [PubMed] [Google Scholar]
- Severs NJ. The cardiac gap junction and intercalated disc. Int J Cardiol. 1990;26:137–173. doi: 10.1016/0167-5273(90)90030-9. [DOI] [PubMed] [Google Scholar]
- Sommer JR, Waugh RA. The ultrastructure of the mammalian cardiac muscle cell, with special emphasis on the tubular membrane systems. A review. Am J Pathol. 1976;82:192–232. [PMC free article] [PubMed] [Google Scholar]
- Takamatsu T, Minamikawa T, Kawachi H, Fujita S. Imaging of calcium wave propagation in guinea-pig ventricular cell pairs by confocal laser scanning microscopy. Cell Struct Funct. 1991;16:341–346. doi: 10.1247/csf.16.341. [DOI] [PubMed] [Google Scholar]
- Venetucci LA, Trafford AW, O’Neill SC, Eisner DA. The sarcoplasmic reticulum and arrhythmogenic calcium release. Cardiovasc Res. 2008;77:285–292. doi: 10.1093/cvr/cvm009. [DOI] [PubMed] [Google Scholar]
- Weiss JN, Karma A, Shiferaw Y, Chen PS, Garfinkel A, Qu Z. From pulsus to pulseless: the saga of cardiac alternans. Circ Res. 2006;98:1244–1253. doi: 10.1161/01.RES.0000224540.97431.f0. [DOI] [PubMed] [Google Scholar]
Associated Data
This section collects any data citations, data availability statements, or supplementary materials included in this article.