

Abstract
Despite efforts to understand and treat acute myeloid leukemia (AML), there remains a need for more comprehensive therapies to prevent AML-associated relapses. To identify new therapeutic strategies for AML, we screened a library of on- and off-patent drugs and identified the antimalarial agent mefloquine as a compound that selectively kills AML cells and AML stem cells in a panel of leukemia cell lines and in mice. Using a yeast genome-wide functional screen for mefloquine sensitizers, we identified genes associated with the yeast vacuole, the homolog of the mammalian lysosome. Consistent with this, we determined that mefloquine disrupts lysosomes, directly permeabilizes the lysosome membrane, and releases cathepsins into the cytosol. Knockdown of the lysosomal membrane proteins LAMP1 and LAMP2 resulted in decreased cell viability, as did treatment of AML cells with known lysosome disrupters. Highlighting a potential therapeutic rationale for this strategy, leukemic cells had significantly larger lysosomes compared with normal cells, and leukemia-initiating cells overexpressed lysosomal biogenesis genes. These results demonstrate that lysosomal disruption preferentially targets AML cells and AML progenitor cells, providing a rationale for testing lysosomal disruption as a novel therapeutic strategy for AML.
Introduction
Despite advances in our understanding of many aspects of the molecular basis and treatment of human acute myeloid leukemia (AML), relapse rates remain high (1). One factor that may account for these clinical problems is the presence of leukemia-initiating cells (LICs) within the bulk AML population (2, 3) that are resistant to conventional chemotherapy agents. This suggests that the identification of therapeutic strategies that target all AML compartments while sparing normal hematopoietic cells will be important in order to improve the outcomes of AML patients.
One therapeutic strategy is to target the cell’s protein degradation machinery. The 26S proteasome, along with the lysosome, constitutes the cell’s protein degradation/recycling machinery (4–6). The biological role of the proteasome has been well described, and proteasome inhibitors are used clinically for the treatment of multiple myeloma and mantle cell lymphoma (7–9). While the utility of targeting the proteasome has been previously reported, the impact of disrupting lysosomes has not been fully elucidated. Lysosomes are acidic organelles, typically 50–100 nm in diameter, produced by the Golgi apparatus. They sequester hydrolases, lipases, and proteases (10–12) that control protein degradation, cholesterol biosynthesis, and organelle recycling. Unregulated release of lysosomal hydrolases and proteases into the cytosol triggers caspase-independent cell death (13–17). Here, we report that the antileukemic effects of lysosome disruption derive from increased lysosomal size and biogenesis in AML.
Results
Identification of the antimalarial mefloquine from an initial screen of compounds cytotoxic to leukemic cells in vitro.
To identify known compounds with antileukemic activity, we compiled a library of 100 on- and off-patent drugs, focusing on antimicrobials and metabolic regulators with wide therapeutic windows. We screened this library in a dose-response manner (72-hour incubation) on a panel of leukemia cell lines and measured cell growth and viability using the MTS assay. Previously we reported on the treatment of leukemia cells with ivermectin, the most potent compound identified from this screen (18).
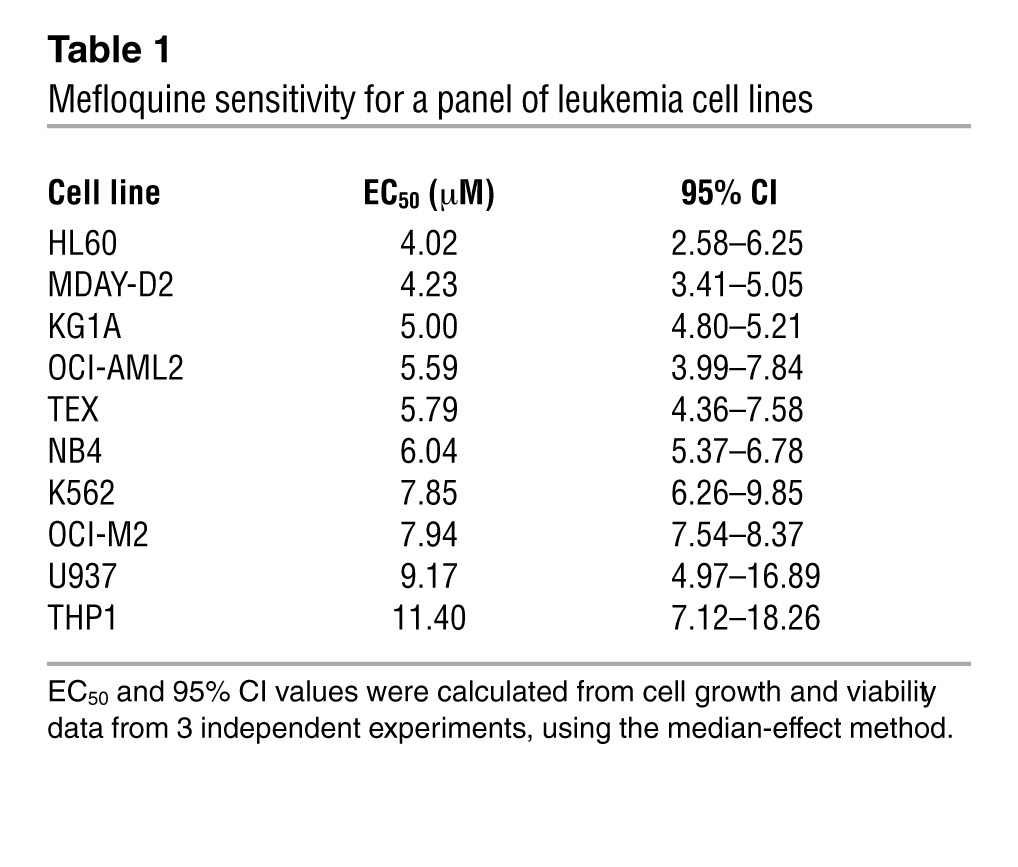
Mefloquine is the second-most-active drug identified, based on a ranking of drug EC50s (Figure 1, A and B). Subsequent testing of the effect of mefloquine on another 10 human and mouse leukemia cell lines showed that in 8 of 10, mefloquine reduced growth and viability with EC50s less than 8 μM (Table 1). Mefloquine-induced cell death was confirmed by Annexin V and propidium iodide (PI) staining, and cell death increased with prolonged incubation with the drug (Supplemental Figure 1A; supplemental material available online with this article; doi: 10.1172/JCI64180DS1). In contrast to its effects on leukemia cells, mefloquine was less cytotoxic to normal murine bone marrow mononuclear cells (EC50 31.8 ± 5.4 μM) and murine monocyte-derived normal dendritic cells (EC50 17. 6 ± 2.7 μM) (Figure 1C). Quinoline-derived compounds can induce differentiation (19, 20), and mefloquine was recently reported to induce differentiation in human pluripotent stem cells (21). However, mefloquine did not induce differentiation of TEX leukemia cells (Supplemental Figure 1B).
Figure 1. Mefloquine exhibits cytotoxicity against AML cells in vitro.

(A) High-throughput screen of 100 known drugs (each represented by a diamond) in OCI-AML2 leukemia cells, ranked by EC50 value. (B) (R)- and (S)-mefloquine. (C) Effect of mefloquine treatment (24 hours) on mouse monocyte-derived dendritic cells, mouse bone marrow mononuclear cells, and MDAY-D2 mouse leukemia cells. Data represent the mean percent viability ± SD (Annexin V/PI staining) compared with vehicle-treated controls from 3 independent experiments. (D) Effect of mefloquine treatment (left panel, 30 hours; right panel, 48 hours) on viability (Annexin V/PI staining) of normal human hematopoietic cells (n = 9) and primary human AML samples (n = 17). EC50 values for each sample, calculated using the median effect method (see Methods). *P < 0.05; **P < 0.01; ***P < 0.005. Top bracket indicates comparison between mefloquine sensitive AML and normal samples. Line indicates comparison between all AML and normal samples. (E) Effect of mefloquine treatment (10 μM) on colony forming potential of normal human hematopoietic samples (n = 3) and primary human AML cells (n = 4). Data represent the mean percent inhibition of colony formation ± SD compared with untreated cells. (F) Effect of mefloquine pre-treatment (10 μM, 24 hours) on the engraftment of normal and leukemic cells. Data represent the percent engraftment of human CD45+CD33+ cells in mouse femurs. Each data point represents a single mouse.
Table 1.
Mefloquine sensitivity for a panel of leukemia cell lines
Mefloquine kills primary human AML cells more effectively than normal human hematopoietic cells.
We next compared the ability of mefloquine to kill cells from primary human AML samples (Supplemental Table 1) and normal human hematopoietic cells, following 30 and 48 hours of exposure in culture (n = 9 AML, n = 5 normal at 30 hours; n = 11 AML, n = 6 normal at 48 hours). Mefloquine was preferentially cytotoxic to the primary AML cells, compared with normal hematopoietic cells (Figure 1D and Supplemental Figure 1, C and D). In addition, mefloquine was preferentially cytotoxic to AML progenitor cells, compared with normal hematopoietic progenitors (Supplemental Figure 1E). As we observed with AML cell lines (Supplemental Figure 1A), longer exposures increased the toxicity of mefloquine to both AML (Supplemental Figure 1C) and normal cells, but the selectivity for AML cells continued to be manifest (Figure 1D and Supplemental Figure 1D). A subgroup of AML samples appeared particularly sensitive to mefloquine, but this was not obviously associated with differences in cytogenetic risk or other overt clinical characteristics (Supplemental Table 1).
We next assessed the effects of mefloquine on functionally defined subsets of primitive human AML and normal cell populations, using established assays (2, 3, 22). Pre-treatment with mefloquine reduced the subsequent clonogenic growth of primary human AML cells, but had less effect on the clonogenic growth of normal human hematopoietic cells (Figure 1E). Pre-treatment with mefloquine also reduced the ability of primary human AML cells to repopulate the marrow of NOD/SCID mice following intrafemoral transplantation (Figure 1F). In contrast, the same pre-treatment protocol did not alter the repopulating activity of normal cord blood cells (Figure 1F). Thus, mefloquine effectively targets all populations of leukemic cells, including the LICs, with reduced toxicity on normal hematopoietic cells.
A combinatorial high-throughput screen identifies mefloquine as an inducer of ROS.
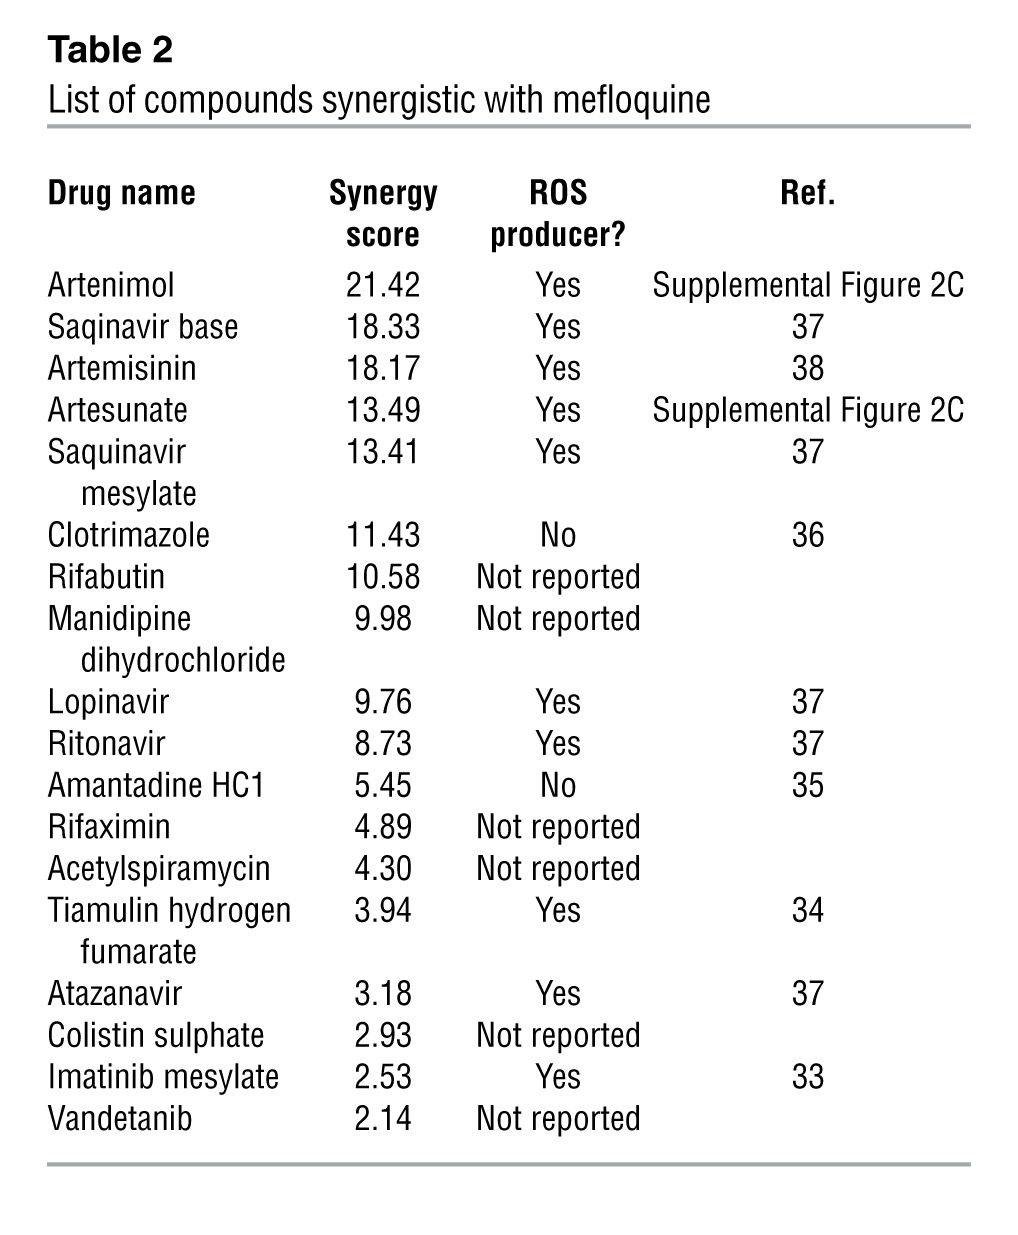
Mefloquine is currently used in the treatment and prophylaxis of malaria (23, 24), but its mechanism of action as an antimalarial has not been fully elucidated. To determine the mechanism underlying the toxic effect of mefloquine on AML cells, we performed a combination chemical screen, reasoning that compounds that synergize with mefloquine might induce common cell death pathways. For this screen, we chose TEX leukemia cells (25), which were derived by overexpressing the TLS-ERG oncogene in primary cord blood cells. Accordingly, we treated aliquots of TEX cells with increasing concentrations of mefloquine in combination with increasing concentrations of an expanded library of on-patent and off-patent drugs (n = 552). From this screen, we identified and validated 18 compounds that synergized with mefloquine as defined by an excess over Bliss additivism (EOBA; ref. 26) statistic greater than 2 SDs above the mean for the library of drugs (ref. 26, Table 2, and Supplemental Figure 2, A and B). In these assays, higher EOBA values indicate greater synergy with the drug combination. These 18 compounds were from diverse therapeutic classes with diverse mechanisms of action. However, strikingly, 10 of these, including the artemisinin class of antimalarials (27, 28), proved to be compounds that are known to increase the production of ROS. Another 6 had no reported effect on ROS, and the remaining 2 had been reported to not increase ROS production (refs. 29–34 and Table 2).
Table 2.
List of compounds synergistic with mefloquine
We therefore assessed the effects of mefloquine on ROS generation in TEX and OCI-AML2 cells. Twenty-four-hour treatment with mefloquine increased ROS production at concentrations that induced cell death in previous experiments (Figure 2A). Increased ROS production was also observed in primary AML patient samples that were sensitive to mefloquine-induced cell death, but not in AML cells that were insensitive to mefloquine and also not in normal hematopoietic cells (Figure 2B and Supplemental Figure 2C). We also evaluated ROS production using the combination of mefloquine and the artemisinin class of antimalarials, the most synergistic combinations from our screen. Consistent with previous reports (35), artesunate and artenimol increased ROS production in TEX and OCI-AML2 cells (Supplemental Figure 2D). Synergistic combinations of mefloquine and artenimol or artesunate also synergistically increased ROS production (Figure 2C). Co-treatment with the ROS scavenger α-tocopherol, known to inhibit lysosomal lipid-mediated ROS production (36), inhibited ROS production (Supplemental Figure 2E) and abrogated mefloquine-induced cell death (Figure 2D) at doses of mefloquine that led to >50% cell death. Conversely, N-acetyl-l-cysteine (NAC), a ROS scavenger that acts through inhibition of thiol redox–mediated ROS production (36), had no effect on ROS or cell viability after mefloquine treatment (Supplemental Figure 2E and Figure 2D). These data suggested that mefloquine-mediated ROS could be associated with changes in lysosomal stability.
Figure 2. Mefloquine synergizes with ROS-producing compounds that target the lysosome.

(A) TEX (left panel) and OCI-AML2 (right panel) cells were treated with mefloquine (5 and 10 μM) or vehicle control for 24 hours and ROS levels measured using 5-(and-6)-carboxy-2′7′-dichlorodihydrofluorescein diacetate (carboxy-H2DCFDA) staining. Data represent the mean ± SD fold increase in ROS compared with vehicle control–treated cells from 3 replicates in a representative experiment. (B) Four primary AML samples (left panel: samples 1–3 sensitive to mefloquine; sample 4 insensitive to mefloquine; see Supplemental Figure 2B) and 2 normal PBSC samples (right panel) were treated with mefloquine for 24 hours and ROS levels measured using carboxy-H2DCFDA staining and flow cytometry (*P < 0.05). (C) Heat maps demonstrating the induction of ROS, measured as in A, in TEX leukemia cells treated with combinations of mefloquine and artesunate or artenimol, as indicated. EOBA score is as defined in Supplemental Methods. (D) TEX cells were treated with mefloquine (8 μM) for 48 hours alone or in combination with the ROS scavengers α-tocopherol (3 mM) and NAC (10 mM). After incubation, cell viability was measured by Annexin V/PI staining. Data represent the mean ± SD fold increase in ROS production compared with vehicle control–treated cells from 3 replicates in a representative experiment (there was significant protection against mefloquine-mediated cell death after scavenger treatment: P < 0.05).
Haploinsufficiency profiling in Saccharomyces cerevisiae identifies the yeast vacuole and lysosome as the targets of mefloquine.
To explore further the mechanism of mefloquine’s antileukemic activity, we used haploinsufficiency profiling (HIP), a well-validated chemical genomics platform developed in Saccharomyces cerevisiae (37–39). The HIP assay allows an unbiased quantitative measure of the relative drug sensitivity of all approximately 6,000 yeast proteins in a single in vivo assay, resulting in a rank-ordered list of the most likely protein targets, pathways, and/or processes. Gene set enrichment analysis (GSEA; ref. 40) demonstrated that gene deletion strains associated with sensitivity to mefloquine are significantly enriched for genes involved with vacuolar processes, the yeast parallel of mammalian lysosome functions (Figure 3A and Supplemental Table 3). Specifically, there is significant enrichment of vacuolar localization and processing, endosome transport, and Golgi vesicle transport (Supplemental Table 3). These processes share a number of genes (indicated by the connecting edges in Figure 3A), highlighting the fact that these processes are interrelated. Notably, vacuolar protein sorting genes help drive the enrichment of all the most significantly enriched processes (see the “Leading edge genes” column for all processes with FDR of 0 in Supplemental Table 3 and ref. 40). Taken together, these data provide a rationale for examining the effect of mefloquine on the mammalian lysosome.
Figure 3. Mefloquine disrupts lysosomes.

(A) Biological processes and protein complexes associated with sensitivity to mefloquine. Each node represents a process/complex significantly enriched among genes associated with mefloquine sensitivity (FDR ≤ 0.01). Node size is proportional to significance of enrichment (i.e., proportional to –log10[FDR value]). The width of edges (represented by gray lines on the diamond) is proportional to level of gene overlap between two connected categories. Edges are not shown where overlap coefficient is less than 0.5. Node color shows cluster membership, where clustering is based on the level of overlap between categories and groups together related categories. (B) Cathepsin B release from isolated lysosomes after mefloquine treatment (20 μM, 90 minutes). Data represent mean cathepsin B release ± SD for vehicle- and mefloquine-treated samples. *P < 0.05, **P < 0.01. (C) Cathepsin L release from isolated lysosomes after mefloquine treatment (20 μM, 90 minutes). Data represent mean cathepsin L release ± SD for vehicle- and mefloquine-treated samples. *P < 0.05, **P < 0.01. (D) Citrate synthase release from mitochondria isolated from OCI-AML2 cells and treated with mefloquine. (E) Cathepsin B release from lysosomes isolated from TEX cells and treated with tigecycline. Data represent mean cathepsin B release ± SD. (F) Cathepsin B release from lysosomes isolated from OCI-AML2 cells and treated with tigecycline. Data represent mean cathepsin B release ± SD.
Since in this case, the putative target is a member of a tightly regulated large complex wherein all genes act in concert, no single protein is predicted to represent a unique mefloquine target, consistent with our previous observations (37). As negative controls, we compared the mefloquine results to antimicrobials with known mechanisms of action unrelated to the lysosome, including tigecycline, chloramphenicol, linezolid, flubendazole, clioquinol, and ciclopirox olamine (ref. 41, Supplemental Figure 3, A–C, and Supplemental Tables 4–6). These compounds showed most significant enrichment in mitochondrial function (tigecycline, chloraphenicol, linezolid), the SWR1 complex (flubendazole), proteasome function (clioquinol), and regulation of cellular pH (ciclopirox olamine), respectively. While vacuole functions were found to be enriched in the clioquinol and ciclopirox olamine datasets, these enrichments were less significant and thus are more likely to indicate putative secondary effects. Taken together, the results of the yeast genomic screen suggest that mefloquine specifically targets lysosomal function. This finding is consistent with mefloquine’s known ability to preferentially accumulate in lysosomes of the malarial parasite (42).
Mefloquine disrupts AML lysosomes.
To determine whether the selective toxicity of mefloquine on human AML cells was mediated by lysosome disruption, we isolated lysosomes from TEX, OCI-AML2, and HL-60 cells, as well as cells from mefloquine-sensitive primary AML patient samples. Purity of the lysosomal fractions was confirmed by immunoblotting for the lysosomal membrane protein LAMP1 and the mitochondrial protein COX II (Supplemental Figure 3D), and by demonstrating a more than 5-fold enrichment for the lysosomal enzyme acid phosphatase. Mefloquine directly disrupted lysosomes isolated from AML cell lines and primary AML patients’ samples, in a dose-dependent manner, as measured by release of cathepsins B and L (Figure 3, B and C, and Supplemental Figure 3E). The effects of mefloquine were specific to lysosomes, as mefloquine treatment did not disrupt isolated mitochondria (Figure 3D). Finally, lysosome disruption was not a general feature of cell death, as the unrelated antimicrobial, tigecycline, did not disrupt isolated lysosomes at cytotoxic concentrations (Figure 3, E and F, and ref. 41).
We also evaluated the effects of mefloquine on the integrity of lysosomes in intact AML cells treated in vitro. In a dose-dependent manner, mefloquine disrupted lysosomes in TEX leukemia cells and mefloquine-sensitive cells from AML patients, but not normal hematopoietic cells, mefloquine-insensitive primary AML cells, or THP1 cells, as early as 6 hours after treatment. This was demonstrated by transmission electron microscopy (TEM) analysis and staining with LysoTracker or acridine orange (Figure 4, A and B, and Supplemental Figure 4, A–E). Likewise, using immunofluorescence microscopy, we found that cathepsin B was present in the cytoplasm of mefloquine-treated AML cells in large aggregates (Figure 4C), consistent with lysosome disruption (43–45). In contrast, the unrelated antimicrobials tigecycline, ivermectin, and ciclopirox olamine had no effect on lysosomal integrity despite their ability to induce cell death, consistent with their different modes of action and with the outcome of the yeast genomic screen (refs. 18, 41, 46, and Supplemental Figure 4, F–K). Of note, lysosome disruption preceded increased ROS generation (Supplemental Figure 4E) and was not inhibited by ROS scavengers (Supplemental Figure 4L). Also consistent with a mechanism of cell death related to lysosome disruption was the finding that mefloquine-mediated cell death was independent of caspase-3 activation (Supplemental Figure 4M). In addition, inhibition of lysosomal cathepsins by co-treatment with the vacuolar ATPase inhibitor bafilomycin A1 protected against mefloquine-mediated cell death (Figure 4D). In contrast, inhibition of single cathepsins, e.g., cathepsin D, was insufficient to inhibit mefloquine-mediated cell death (Supplemental Figure 4N), consistent with mefloquine releasing multiple cathepsins into the cytosol. Taken together, these data point to mefloquine-mediated lysosomal disruption as the cellular mechanism underlying antileukemic action.
Figure 4. Mefloquine disrupts lysosomes in leukemia cells.

(A) Left panel: TEM analysis of lysosomes in TEX cells treated for 24 hours with mefloquine (10 μM). Data represent mean percent intact lysosomes ± SD relative to control-treated cells. Middle and right panels: Quantification of LysoTracker and acridine orange uptake in TEX cells treated for 24 hours with mefloquine (10 μM). Results (mean ± SD of 3 replicates in a representative experiment) represent the percent lysosomal integrity relative to control cells. (B) Lysosome integrity, measured by LysoTracker and acridine orange uptake, after treatment with mefloquine (10 μM) for 24 hours in cells from insensitive (sample 1, EC50 >12 μM) or sensitive AML samples (samples 2–6, EC50 5–8 μM) and normal human hematopoietic cells (n = 3). Results (mean ± SD of 3 replicates in a representative experiment) represent the percent lysosomal integrity relative to control cells. *P < 0.05. (C) Cathepsin B release after mefloquine (10 μM) treatment shown by immunofluorescence microscopy. Representative fields (×80 objective magnification) are shown. Arrow indicates an aggregate of cathepsin B activity. Scale bars: 5 μm. (D) TEX cells were treated with 8 μM mefloquine alone or in combination with bafilomycin A1 (900 nM) for 24 hours, and cell viability was determined by Annexin V/PI. Results (mean ± SD of 3 replicates in a representative experiment) represent viability compared with controls.
Effects of mefloquine enantiomers and analogs on lysosome integrity and cell viability.
Mefloquine is a racemic mixture of 4 diastereomers (Figure 5A). Therefore, we assessed the effects of (–) and (+)-erythro and threo forms of mefloqine on the viability of leukemia cells (Figure 5B) as well as lysosome disruption in intact cells (Figure 5C). The (–) and (+)-erythro forms of mefloquine were more potent than the threo forms in both assays (Figure 5, B and C, and Supplemental Figure 5, A and B). Of note, clinical-grade mefloquine, as well as our commercial supply, contain very little of the threo forms (refs. 47, 48, and data not shown). We also examined the efficacy of 6 compounds structurally related to mefloquine that have previously been shown to have antimalarial activity (Supplemental Table 7 and ref. 49). None of these compounds induced cell death or disrupted lysosomes in leukemia cells at concentrations up to 15 μM (Supplemental Figure 5, C and D).
Figure 5. Characterization of mefloquine diastereomers’ effects on cell viability and lysosome integrity.

(A) Chemical structures of mefloquine diastereomers. (B) OCI-AML2 cells were treated with increasing concentrations of the indicated mefloquine diastereomer for 48 hours. After incubation, cell viability was measured by MTS. Relative viability was calculated in comparison to the vehicle-treated controls. Data represent the mean percent viability ± SD from 3 replicates in a representative experiment. (C) OCI-AML2 cells were treated with increasing concentrations of the indicated mefloquine diastereomer for 24 hours. After incubation, lysosome integrity was measured by LysoTracker staining and flow cytometry. Relative lysosome integrity was calculated in comparison to the vehicle-treated control cells. Data represent the mean percent lysosome integrity ± SD from 3 replicates in a representative experiment.
Lysosome disruption as a therapeutic strategy in leukemia.
To further explore the potential antileukemic effect of lysosomal disruption, we asked whether genetic strategies could mimic the effects obtained with mefloquine. LAMP1 and LAMP2 are the predominant lysosomal membrane proteins and function, in part, to maintain the integrity of the lysosomal membrane in malignant cells (10–12, 50, 51). We thus asked whether lentiviral vector–mediated shRNA knockdown of LAMP1 and LAMP2 would also target leukemic cells. Effective knockdown of both gene transcripts and proteins was confirmed by quantitative real-time RT-PCR and immunoblotting, using two independent shRNAs for each gene (Figure 6, A and B). Compared with control, shRNA knockdown of LAMP1, or to a lesser extent LAMP2, also reduced the growth and viability of OCI-AML2 leukemia cells (Figure 6C). LAMP1 knockdown was associated with decreased lysosome integrity, increased ROS production, decreased cell viability, and increased sensitivity to mefloquine (Figure 6D). Similar effects of LAMP1 knockdown on lysosome integrity and cell viability were observed in TEX leukemia cells (Supplemental Figure 6). Also, THP1 and U937 cells, which were less sensitive to mefloquine treatment (Table 1 and Supplemental Figure 4D), exhibited lesser effects on lysosome integrity and cell proliferation after LAMP1 knockdown, compared with OCI-AML2 cells (Supplemental Figure 7, A–D, and Supplemental Figure 8, A–D).
Figure 6. Genetic and chemical strategies to disrupt lysosomes have antileukemia effects.

(A) Left: Mean ± SD change in LAMP1 mRNA compared with untransduced controls after shRNA-mediated knockdown of LAMP1 (*P < 0.05). Right: LAMP1 and actin protein expression after shRNA-mediated knockdown. Molecular weights (kDa) are indicated. (B) Left: Mean ± SD change in LAMP2 mRNA compared with untransduced controls after shRNA-mediated knockdown of LAMP2 (*P < 0.05). Right: LAMP2 protein expression in isolated lysosomes after shRNA-mediated knockdown. Molecular weights (kDa) are indicated. Asterisk indicates nonspecific band. Equal protein loading was confirmed by Ponceau S staining. (C) Number of viable OCI-AML2 cells by trypan blue staining after shRNA-mediated knockdown of LAMP1, LAMP2, or control sequences. Data represent mean ± SD number of viable cells from 4 replicates in a representative experiment. (D) Mean ± SD lysosome integrity (acridine orange staining), ROS production (carboxy-H2DCFDA staining), and sensitivity to 8 μM mefloquine (MTS assay) after shRNA-mediated knockdown of LAMP1. Mean ± SD lysosome integrity (24 hours, LysoTracker staining) (E) and viability (48 hours, Annexin V staining) (F) in OCI-AML2 cells treated with LeuLeuOMe. (G) Mean ± SD lysosome integrity (LysoTracker staining) in TEX cells treated for 16 hours with 5 μM artesunate or artenimol. (H) Mean ± SD percent inhibition of clonogenic growth of primary AML and normal hematopoietic cells pretreated with 5 μM artesunate for 48 hours and then plated in clonogenic growth assays (*P < 0.05).
As a further test of a lysosome-based mechanism of action, we treated leukemia cell lines with l-leucine-leucine-methyl ester (LeuLeuOMe), artesunate, and artenimol, all of which are reported to disrupt lysosomes when added to intact cells (35, 52, 53). Treatment with these agents disrupted lysosomes in intact cells as well as isolated lysosomes, increased ROS production, and reduced the viability of TEX and OCI-AML2 leukemia cell lines (Figure 6, E–G, and Supplemental Figure 9B; compare with Supplemental Figure 2, A and D, and Supplemental Figure 9A). THP1 and U937 cells were sensitive to LeuLeuOMe-mediated lysosome disruption and cell death (Supplemental Figure 7, E and F, and Supplemental Figure 8, E and F), suggesting a mechanism of lysosome-mediated cell death different from that of mefloquine. Furthermore, artesunate preferentially reduced the clonogenic growth of primary AML cells compared with normal hematopoietic cells (Figure 6H). Overall, results from our genetic and chemical experiments validate lysosomal disruption as a novel and plausible therapeutic strategy for AML.
Lysosome size is increased in AML.
To investigate the basis of the differential sensitivity of leukemic cells and normal hematopoietic cells to lysosomal disruption, we assessed the characteristics of lysosomes in the two types of cells. TEM revealed that lysosomes are larger in primary human AML cells, including the CD34+ AML cells, as well as in AML cell lines, in comparison to the lysosomes found in normal human CD34+ hematopoietic cells (Figure 7A and Supplemental Figure 10A). Although larger in size, the number of lysosomes per cell did not differ significantly between AML and normal cells (Figure 7A).
Figure 7. AML cells have increased lysosomal mass compared with normal hematopoietic cells.

(A) Lysosome size (nm2) and number were quantified by TEM in AML cells and primary AML and normal samples. Data represent mean ± SEM (left panel) (*P < 0.05; **P < 0.01; ***P < 0.001). The arrow indicates a CD34+ AML sample. (B) Ordered heat maps illustrating expression of lysosome biogenesis genes in functionally defined bulk AML cells (CD34+ cells from 6 samples, CD34–CD38+ cells from 12 samples, and CD34–CD38– cells from 11 samples) versus normal CD34+ cord blood–derived HSCs (n = 3 samples). Data are derived from the dataset GSE30377, archived in the GEO database. Genes are rank ordered by fold change and significance. (C) Ordered heat maps illustrating expression of a subset of lysosome biogenesis genes in functionally defined LIC-enriched cell populations (CD34+CD38– cells from 13 samples and CD34+CD38+ cells from 6 samples, as indicated) versus HSCs (n = 3 samples). Up and Down indicated upregulated and downregulated, respectively. (D) Expression of lysosomal cathepsins in functionally defined bulk AML cells (as in B) versus normal CD34+ cord blood–derived HSCs (n = 3 samples). (E) Expression of lysosomal cathepsins in functionally defined LIC-enriched cell populations (as in C) versus HSCs (n = 3 samples).
Additionally, we confirmed that the previously reported lysosomal biogenesis signature genes (54), as well as cathepsin mRNA, are overexpressed in primary bulk human AML cells, as well as the CD34+CD38– and CD34+CD38+ subsets enriched in LICs, as compared with the same primitive phenotype of normal human hematopoietic cells (refs. 55–57, Figure 7, B–E, and Supplemental Figure 10, B–D). Taken together, these results indicate a mechanism that could explain the observed differential activity of lysosome disruption in leukemic and normal human hematopoietic cells.
Finally, mefloquine-sensitive primary AML cells, including CD34+ human AML cells, had higher cathepsin B enzymatic activity compared with insensitive AML cells and normal hematopoietic cells (P < 0.001; Figure 8A). Likewise, uptake of the LysoTracker dye was significantly higher in mefloquine-sensitive primary AML cells, including the CD34+ subset of these, as compared with both normal CD34+ hematopoietic cells and the cells in mefloquine-insensitive AML samples (P < 0.01; Figure 8B). Thus, these differences might help to identify subsets of AML patients most likely to respond to lysosome disrupters.
Figure 8. Increased cathepsin B enzymatic activity and LysoTracker uptake distinguish mefloquine-sensitive from mefloquine-insensitive primary AML patient samples.

(A) Cell extracts from normal CD34+ cells or primary (1) AML samples (n = 5) were treated with 0.2% Triton X to disrupt the lysosomal membranes. The cathepsin B substrate 1 mM Z-Arg-Arg-7-amido-4-methylcoumarin hydrochloride (1 mM) was added and incubated for 1 hour at 37°C. The resulting fluorescence was measured. Data represent the mean fold change in cathepsin B release ± SD, compared with the normal sample (set at 1.00); ***P < 0.001. Arrows indicate CD34+ AML samples. (B) Relative lysosomal mass of normal hematopoietic cells (n = 3 samples), primary AML cells insensitive to mefloquine (EC50 >15 μM; n = 3), and primary AML cells sensitive to mefloquine (EC50 <8 μM; n = 5) were measured using LysoTracker staining and flow cytometry. Data represent the mean relative increase in LysoTracker uptake of 3 replicates for a single sample. Arrows indicate CD34+ AML samples.
Mefloquine demonstrates antitumor activity on leukemic cells growing in xenografted mice.
Given the antileukemic activity displayed by mefloquine in vitro, we next evaluated the effect of oral mefloquine on mouse and human leukemia cells growing in transplanted immunodeficient mice. Mouse MDAY-D2 cells and human OCI-AML2 or K562 cells were transplanted subcutaneously into NOD/SCID mice and treatment started 7 days later when tumors were already palpable (10 mice per group). Compared with vehicle control, mefloquine reduced tumor growth in all 3 models (Figure 9, A–D). Mefloquine-responsive tumors also exhibited lysosomal disruption, consistent with our in vitro findings (Figure 9E).
Figure 9. Mefloquine demonstrates therapeutic efficacy on AML cells growing in vivo.

Sublethally irradiated SCID mice were injected subcutaneously with (A and B) OCI-AML2 or (C) K562 human leukemia cells or (D) MDAY-D2 mouse leukemia cells. Once tumors were palpable, mice were treated with 50 mg/kg mefloquine or vehicle control daily by oral gavage (n = 10 per condition). Tumor weight was measured at time of sacrifice. (E) Lysosome integrity (LysoTracker staining) in single-cell suspensions derived from control and mefloquine-treated OCI-AML2–derived tumors generated in xenografted mice. (F) Primary AML samples (2 × 10⁶ cells) were injected intrafemorally into sublethally irradiated NOD/SCID mice (n = 20) and allowed to repopulate the mice for 2.5 weeks, as described in Methods. After this period, mice (n = 10 per treatment condition) were treated with 100 mg/kg/d by oral gavage for an additional 4.5 weeks and then sacrificed. Bone marrow from the non-injected femurs was collected; stained with anti-human antibodies to cell surface markers CD45, CD33, and CD19; and analyzed by flow cytometry. Data represent the percent CD45+ CD33+ CD19– human AML cells present in non-injected femurs. Serum bilirubin (G), alkaline phosphatase (H), aspartate transaminase (I), creatine kinase (J), creatinine (K), and mouse body weight (L) in vehicle- and mefloquine-treated mice (50 mg/kg × 21 days) (for serum markers of liver and kidney function, n = 3 per treatment condition; for body weight, n = 6 for controls and n = 5 for mefloquine-treated mice).
We then transplanted sublethally irradiated NOD/SCID mice intrafemorally with primary human AML cells and later evaluated the effects of a 4.5-week course of mefloquine starting 2.5 weeks after transplantation (10 mice per group). Mefloquine treatment significantly reduced the level of leukemic cells compared with control mice when these were assessed at the end of the treatment period (Figure 9F), and no evidence of toxicity (body weight, appearance, or behavior of the mice) was noted.
To evaluate in greater detail the potential effects of mefloquine on normal tissues at the dose that produced these antileukemic effects, we treated otherwise untreated SCID mice with mefloquine for 21 days. No effects on body weight, appearance, or behavior were confirmed, and there were also no gross changes in the organs at necropsy or by histologic evaluation (Supplemental Figure 11). There were also no alterations in serum levels of liver or muscle/cardiac enzymes, nor were there alterations in renal function (Figure 9, G–L, and Supplemental Figure 12). Thus, in vivo, mefloquine disrupts lysosomes and inhibits the in vivo growth of leukemia cells without significant toxicity to normal host tissues.
Discussion
Here we report that mefloquine, a quinoline approved for the treatment and prevention of malaria (23, 24), has toxicity for human AML cells including AML progenitors, while sparing normal human hematopoietic cells treated with the same doses. Furthermore, we show that the antileukemic effects of mefloquine are mediated through disruption of lysosomes, a previously unappreciated mechanism of action of this drug.
In the treatment of mild-moderate Plasmodium falciparum malaria, patients receive a single oral dose of up to 1,250 mg mefloquine, which is usually sufficient to eradicate the parasite (24). However, in regions where mefloquine-resistant malaria is prevalent, patients have received higher doses, up to 25 mg/kg, of drug without significant toxicity (58). In addition, serum concentrations of mefloquine up to 5 μM have been reported in individuals receiving 250 mg weekly for malaria prophylaxis (59, 60). Thus, antileukemia concentrations of mefloquine may be pharmacologically achievable.
Although mefloquine is known to accumulate in the lysosomes of the malarial parasite (42), its mechanism of action as an antimalarial is unclear. Therefore, this work may also inform about the mechanism of action of mefloquine in malaria, as it may also selectively disrupt the lysosomes of the malarial parasite. While we demonstrated that mefloquine disrupts lysosomes and our yeast study strongly suggests that an intact lysosome is required for resistance to mefloquine, future studies to identify its direct binding target(s) in the lysosomes of leukemia cells and possibly the malarial vacuole will be of major interest.
Autophagy is a lysosome-mediated process of cellular autodigestion that, in times of nutrient deprivation, enables the cell to recycle raw materials for macromolecular and organellar biosynthesis. Both inhibiting and promoting autophagy can lead to cell death in cancer (ref. 61 and reviewed in ref. 62). The antimalarial chloroquine is structurally similar to mefloquine and inhibits the degradation of autophagy targets in the autophagolysosome. Through this mechanism, chloroquine can induce cell death and sensitize cells to chemotherapy (including imatinib mesylate in chronic myeloid leukemia; refs. 63–66) and radiation. However, as it involves induction of lysosome disruption, the mechanism of action of mefloquine appears distinct from that of chloroquine and other inhibitors of autophagy.
LAMP1 and LAMP2 are the predominant proteins in the lysosomal membrane, accounting for approximately 50% of the protein mass contained therein (14–16). Previous studies have demonstrated that knockdown of LAMP1 or LAMP2 disrupts the integrity of lysosomes in malignant cells but not in non-transformed cells (50). Consistent with this finding, we observed that knockdown of LAMP proteins decreases the proliferation of leukemic cells, and also decreases lysosome integrity.
Our results are also in agreement with prior reports showing increased cathepsin expression (67) and lysosomal mass (50) upon oncogene-mediated transformation. Prior studies indicated that increased lysosomal biogenesis can lead to increases in lysosomal volume (54). In addition, Ono et al. (68) previously suggested that an increased lysosomal volume would render cells more sensitive to death after lysosome disruption with blue light irradiation, although the mechanism was unclear. These findings taken together with those we now report provide a strong rationale for therapeutically targeting the lysosome in AML, as larger lysosomes may be more sensitive to disruption. Further support for this idea comes from our results indicating that the cells in mefloquine-sensitive AML samples also had a significantly increased lysosomal mass, as measured by LysoTracker dye uptake, as compared with cells in either mefloquine-insensitive samples or normal hematopoietic sources. Thus, increased lysosomal size or mass may be a predictive biomarker of sensitivity to lysosomal disruption in human AML.
Currently, it is unclear why AML cells have increased lysosomal mass and biogenesis. Given the role of lysosomes in macromolecule and organelle recycling, they may function to increase levels of amino acids and nucleotides necessary for cell proliferation. Indeed, a recent report indicated that intracellular levels of amino acids can regulate the expression of TFEB, a transcription factor responsible for activation of lysosomal biogenesis pathways (54, 69–71). In addition, increased lysosomal mass in AML may be necessary to provide a source of fatty acids for these cells. Recently, it was demonstrated that AML cells have higher reliance on fatty acids for their energy supply, and AML cells and their most primitive elements have increased rates of fatty acid oxidation (72).
In summary, a combined approach using small-molecule and yeast mutant screens with in vitro and in vivo functional studies of AML has identified lysosome disruption as a novel and promising therapeutic strategy for human AML. Investigation of the mechanistic basis of the selective sensitivity of primary human AML cells to agents that disrupt lysosomes revealed increased lysosomal size and biogenesis in bulk AML cells and subsets enriched in AML stem cells. Thus, in spite of the genetic and biological heterogeneity of AML, some common biological features may remain accessible to selective targeting and potential therapeutic exploitation.
Methods
Detailed experimental procedures are available in the Supplemental Methods and Supplemental Table 2.
Primary cells.
Fresh peripheral blood samples were obtained from consenting AML patients and the mononuclear cells fractionated by Ficoll separation. Similarly, primary normal hematopoietic mononuclear cells were obtained from healthy consenting volunteers donating mobilized peripheral blood stem cells (PBSCs) for transplantation into allogeneic recipients. Primary cells were cultured at 37°C and 5% CO2 in IMDM supplemented with 10% FBS and appropriate antibiotics.
Assessment of anticancer activity in mouse models of leukemia.
MDAY-D2 mouse leukemia cells and human K562 or OCI-AML2 leukemia cells (2.5 × 10⁵) were injected subcutaneously into the flanks of sublethally irradiated (3.5 Gy) NOD/SCID mice (Ontario Cancer Institute, Toronto, Ontario, Canada). Four (OCI-AML2), 5 (MDAY-D2), or 7 (K562) days after injection, once tumors were palpable, mice were treated with mefloquine (50 mg/kg/d) by oral gavage in water or vehicle control (n = 10 per group). Tumor volume (tumor length × width2 × 0.5236) was measured 3 times a week using calipers. Fourteen (MDAY-D2), 15 (OCI-AML2), or 17 (K562) days after injection of cells, mice were sacrificed, tumors excised, and the volume and mass of the tumors measured.
To assess mefloquine in mouse models of primary AML and cord blood–derived HSC engraftment, a frozen aliquot of AML cells or cord blood cells was thawed and counted. Cord blood–derived HSCs were purified using anti–human CD34 antibody (Human CD34 Selection Kit, Stemcell Technologies). Cells were resuspended in PBS, and 1 × 10⁶ to 2 × 10⁶ viable trypan blue–negative cells were injected into the marrow of the right femur of 10-week-old female NOD/SCID mice that had been irradiated 24 hours previously with 208 cGy from a 137Cs source. The mice were also injected with 200 μg anti–mouse CD122. Two and a half weeks after injection of the human AML cells, mice were treated with mefloquine (100 mg/kg by i.p. injection) daily or the vehicle as a control (n = 10 per group) for 4.5 weeks. Mice were then sacrificed, and the cells were flushed from the femurs. Engraftment of human AML into the marrow was assessed by enumerating the percentage of human CD45+CD33+CD19– cells by flow cytometry using the BD FACSCalibur flow cytometer. Data were analyzed with FlowJo version 8.8 (TreeStar).
Statistics.
Statistical tests were conducted, unless otherwise indicated, using GraphPad Prism version 4 (GraphPad Software) and Microsoft Excel. For statistical comparisons in cell culture assays, a 2-tailed Student’s t test (2-population) or 1-way ANOVA (multi-population) was applied as appropriate. For statistical comparisons in data derived from animal studies or human patient samples, the Mann-Whitney U test was applied for 2-population comparisons, and the Kruskal-Wallis test, with the Dunns post-test, was applied for 3-population comparisons. Significance cutoffs of P < 0.05 were applied in all instances. Drug EC50s were calculated using the median effect method (33), with the CalcuSyn version 2.0 software package (Biosoft).
Study approval.
The collection and use of human tissue for this study were approved by the University Health Network, Mount Sinai Hospital, and University of British Columbia institutional review boards. All samples were obtained from donors who provided written informed consent. All animal studies were carried out according to the regulations of the Canadian Council on Animal Care and with the approval of the Ontario Cancer Institute animal ethics review board.
Supplementary Material
Acknowledgments
We thank Jill Flewelling for administrative assistance and help in preparation of the manuscript. This work was supported by the Leukemia and Lymphoma Society, the International Myeloma Foundation, the Canadian Stem Cell Network, the Ontario Institute of Cancer Research through funding from the Ontario Ministry of Research and Innovation, and the Ministry of Health and Long-Term Care in the Province of Ontario, the Canadian Institutes of Health Research (CIHR), and the Terry Fox Foundation. M.A. Sukhai is a CIHR Post-Doctoral Fellow and an Ontario Ministry of Research and Innovation Post-Doctoral Fellow. G. Giaever and C. Nislow are supported by a grant from the National Human Genome Research Institute (NHGRI) and a grant from the Canadian Cancer Society (no. 020380). A.D. Schimmer is a Leukemia and Lymphoma Society Scholar in Clinical Research.
Footnotes
Conflict of interest: The authors have declared that no conflict of interest exists.
Citation for this article: J Clin Invest. 2013;123(1):315–328. doi:10.1172/JCI64180.
References
- 1.Lowenberg B, et al. Mitoxantrone versus daunorubicin in induction-consolidation chemotherapy — the value of low-dose cytarabine for maintenance of remission, and an assessment of prognostic factors in acute myeloid leukemia in the elderly: final report. European Organization for the Research and Treatment of Cancer and the Dutch-Belgian Hemato-Oncology Cooperative Hovon Group. J Clin Oncol. 1998;16(3):872–881. doi: 10.1200/JCO.1998.16.3.872. [DOI] [PubMed] [Google Scholar]
- 2.Bonnet D, Dick JE. Human acute myeloid leukemia is organized as a hierarchy that originates from a primitive hematopoietic cell. Nat Med. 1997;3(7):730–737. doi: 10.1038/nm0797-730. [DOI] [PubMed] [Google Scholar]
- 3.Lapidot T, et al. A cell initiating human acute myeloid leukaemia after transplantation into SCID mice. Nature. 1994;367(6464):645–648. doi: 10.1038/367645a0. [DOI] [PubMed] [Google Scholar]
- 4.de Duve C. The lysosome turns fifty. Nat Cell Biol. 2005;7(9):847–849. doi: 10.1038/ncb0905-847. [DOI] [PubMed] [Google Scholar]
- 5.Kroemer G, Jaattela M. Lysosomes and autophagy in cell death control. Nat Rev Cancer. 2005;5(11):886–897. doi: 10.1038/nrc1738. [DOI] [PubMed] [Google Scholar]
- 6.Luzio JP, Pryor PR, Bright NA. Lysosomes: fusion and function. Nat Rev Mol Cell Biol. 2007;8(8):622–632. doi: 10.1038/nrm2217. [DOI] [PubMed] [Google Scholar]
- 7.Baiocchi RA, et al. Phase 2 trial of rituximab and bortezomib in patients with relapsed or refractory mantle cell and follicular lymphoma. Cancer. 2011;117(11):2442–2451. doi: 10.1002/cncr.25792. [DOI] [PMC free article] [PubMed] [Google Scholar]
- 8.Belch A, et al. A phase II study of bortezomib in mantle cell lymphoma: the National Cancer Institute of Canada Clinical Trials Group trial IND.150. Ann Oncol. 2007;18(1):116–121. doi: 10.1093/annonc/mdl316. [DOI] [PubMed] [Google Scholar]
- 9.Cavo M, et al. Bortezomib with thalidomide plus dexamethasone compared with thalidomide plus dexamethasone as induction therapy before, and consolidation therapy after, double autologous stem-cell transplantation in newly diagnosed multiple myeloma: a randomised phase 3 study. Lancet. 2010;376(9758):2075–2085. doi: 10.1016/S0140-6736(10)61424-9. [DOI] [PubMed] [Google Scholar]
- 10.Bagshaw RD, Mahuran DJ, Callahan JW. A proteomic analysis of lysosomal integral membrane proteins reveals the diverse composition of the organelle. Mol Cell Proteomics. 2005;4(2):133–143. doi: 10.1074/mcp.M400128-MCP200. [DOI] [PubMed] [Google Scholar]
- 11.Bagshaw RD, Mahuran DJ, Callahan JW. Lysosomal membrane proteomics and biogenesis of lysosomes. Mol Neurobiol. 2005;32(1):27–41. doi: 10.1385/MN:32:1:027. [DOI] [PubMed] [Google Scholar]
- 12.Callahan JW, Bagshaw RD, Mahuran DJ. The integral membrane of lysosomes: its proteins and their roles in disease. J Proteomics. 2009;72(1):23–33. doi: 10.1016/j.jprot.2008.11.007. [DOI] [PubMed] [Google Scholar]
- 13.Brunk UT, Neuzil J, Eaton JW. Lysosomal involvement in apoptosis. Redox Rep. 2001;6(2):91–97. doi: 10.1179/135100001101536094. [DOI] [PubMed] [Google Scholar]
- 14.Guicciardi ME, Leist M, Gores GJ. Lysosomes in cell death. Oncogene. 2004;23(16):2881–2890. doi: 10.1038/sj.onc.1207512. [DOI] [PubMed] [Google Scholar]
- 15.Leist M, Jaattela M. Triggering of apoptosis by cathepsins. Cell Death Differ. 2001;8(4):324–326. doi: 10.1038/sj.cdd.4400859. [DOI] [PubMed] [Google Scholar]
- 16.Leist M, Jaattela M. Four deaths and a funeral: from caspases to alternative mechanisms. Nat Rev Mol Cell Biol. 2001;2(8):589–598. doi: 10.1038/35085008. [DOI] [PubMed] [Google Scholar]
- 17.Turk B, et al. Apoptotic pathways: involvement of lysosomal proteases. Biol Chem. 2002;383(7–8):1035–1044. doi: 10.1515/BC.2002.112. [DOI] [PubMed] [Google Scholar]
- 18.Sharmeen S, et al. The antiparasitic agent ivermectin induces chloride-dependent membrane hyperpolarization and cell death in leukemia cells. Blood. 2010;116(18):3593–3603. doi: 10.1182/blood-2010-01-262675. [DOI] [PubMed] [Google Scholar]
- 19.Iyamu E, Perdew H, Woods G. Growth inhibitory and differentiation effects of chloroquine and its analogue on human leukemic cells potentiate fetal hemoglobin production by targeting the polyamine pathway. Biochem Pharmacol. 2009;77(6):1021–1028. doi: 10.1016/j.bcp.2008.11.016. [DOI] [PubMed] [Google Scholar]
- 20.Martirosyan AR, Rahim-Bata R, Freeman AB, Clarke CD, Howard RL, Strobl JS. Differentiation-inducing quinolines as experimental breast cancer agents in the MCF-7 human breast cancer cell model. Biochem Pharmacol. 2004;68(9):1729–1738. doi: 10.1016/j.bcp.2004.05.003. [DOI] [PubMed] [Google Scholar]
- 21.Sachlos E, et al. Identification of drugs including a dopamine receptor antagonist that selectively target cancer stem cells. Cell. 2012;149(6):1284–1297. doi: 10.1016/j.cell.2012.03.049. [DOI] [PubMed] [Google Scholar]
- 22.Jin L, Hope KJ, Zhai Q, Smadja-Joffe F, Dick JE. Targeting of CD44 eradicates human acute myeloid leukemic stem cells. Nat Med. 2006;12(10):1167–1174. doi: 10.1038/nm1483. [DOI] [PubMed] [Google Scholar]
- 23.Boudreau E, et al. Tolerability of prophylactic Lariam regimens. Trop Med Parasitol. 1993;44(3):257–265. [PubMed] [Google Scholar]
- 24.Harinasuta T, Bunnag D, Wernsdorfer WH. A phase II clinical trial of mefloquine in patients with chloroquine-resistant falciparum malaria in Thailand. Bull World Health Organ. 1983;61(2):299–305. [PMC free article] [PubMed] [Google Scholar]
- 25.Warner JK, et al. Direct evidence for cooperating genetic events in the leukemic transformation of normal human hematopoietic cells. Leukemia. 2005;19(10):1794–1805. doi: 10.1038/sj.leu.2403917. [DOI] [PubMed] [Google Scholar]
- 26.Borisy AA, et al. Systematic discovery of multicomponent therapeutics. Proc Natl Acad Sci U S A. 2003;100(13):7977–7982. doi: 10.1073/pnas.1337088100. [DOI] [PMC free article] [PubMed] [Google Scholar]
- 27.Chawira AN, Warhurst DC, Robinson BL, Peters W. The effect of combinations of qinghaosu (artemisinin) with standard antimalarial drugs in the suppressive treatment of malaria in mice. Trans R Soc Trop Med Hyg. 1987;81(4):554–558. doi: 10.1016/0035-9203(87)90404-4. [DOI] [PubMed] [Google Scholar]
- 28.Klayman DL. Qinghaosu (artemisinin): an antimalarial drug from China. Science. 1985;228(4703):1049–1055. doi: 10.1126/science.3887571. [DOI] [PubMed] [Google Scholar]
- 29.Chang SP, Shen SC, Lee WR, Yang LL, Chen YC. Imatinib mesylate induction of ROS-dependent apoptosis in melanoma B16F0 cells. J Dermatol Sci. 2011;62(3):183–191. doi: 10.1016/j.jdermsci.2011.03.001. [DOI] [PubMed] [Google Scholar]
- 30.Hoebe KH, Monshouwer M, Witkamp RF, Fink-Gremmels J, van Miert AS. Cocultures of porcine hepatocytes and Kupffer cells as an improved in vitro model for the study of hepatotoxic compounds. Vet Q. 2000;22(1):21–25. doi: 10.1080/01652176.2000.9695018. [DOI] [PubMed] [Google Scholar]
- 31.Nakamura T, Lipton SA. Preventing Ca2+-mediated nitrosative stress in neurodegenerative diseases: possible pharmacological strategies. Cell Calcium. 2010;47(2):190–197. doi: 10.1016/j.ceca.2009.12.009. [DOI] [PMC free article] [PubMed] [Google Scholar]
- 32.Thapa D, et al. Inhibitory effects of clotrimazole on TNF-alpha-induced adhesion molecule expression and angiogenesis. Arch Pharm Res. 2009;32(4):593–603. doi: 10.1007/s12272-009-1416-6. [DOI] [PubMed] [Google Scholar]
- 33.Touzet O, Philips A. Resveratrol protects against protease inhibitor-induced reactive oxygen species production, reticulum stress and lipid raft perturbation. AIDS. 2010;24(10):1437–1447. doi: 10.1097/QAD.0b013e32833a6114. [DOI] [PubMed] [Google Scholar]
- 34.Zhang S, Chen H, Gerhard GS. Heme synthesis increases artemisinin-induced radical formation and cytotoxicity that can be suppressed by superoxide scavengers. Chem Biol Interact. 2010;186(1):30–35. doi: 10.1016/j.cbi.2010.03.021. [DOI] [PubMed] [Google Scholar]
- 35.Hamacher-Brady A, et al. Artesunate activates mitochondrial apoptosis in breast cancer cells via iron-catalyzed lysosomal reactive oxygen species production. J Biol Chem. 2010;286(8):6587–6601. doi: 10.1074/jbc.M110.210047. [DOI] [PMC free article] [PubMed] [Google Scholar]
- 36.Wu SJ, Ng LT, Lin CC. Effects of vitamin E on the cinnamaldehyde-induced apoptotic mechanism in human PLC/PRF/5 cells. Clin Exp Pharmacol Physiol. 2004;31(11):770–776. doi: 10.1111/j.1440-1681.2004.04091.x. [DOI] [PubMed] [Google Scholar]
- 37.Giaever G, et al. Chemogenomic profiling: identifying the functional interactions of small molecules in yeast. Proc Natl Acad Sci U S A. 2004;101(3):793–798. doi: 10.1073/pnas.0307490100. [DOI] [PMC free article] [PubMed] [Google Scholar]
- 38.Giaever G, et al. Genomic profiling of drug sensitivities via induced haploinsufficiency. Nat Genet. 1999;21(3):278–283. doi: 10.1038/6791. [DOI] [PubMed] [Google Scholar]
- 39.Hoon S, et al. An integrated platform of genomic assays reveals small-molecule bioactivities. Nat Chem Biol. 2008;4(8):498–506. doi: 10.1038/nchembio.100. [DOI] [PubMed] [Google Scholar]
- 40.Subramanian A, et al. Gene set enrichment analysis: a knowledge-based approach for interpreting genome-wide expression profiles. Proc Natl Acad Sci U S A. 2005;102(43):15545–15550. doi: 10.1073/pnas.0506580102. [DOI] [PMC free article] [PubMed] [Google Scholar]
- 41.Skrtic M, et al. Inhibition of mitochondrial translation as a therapeutic strategy for human acute myeloid leukemia. Cancer Cell. 2011;20(5):674–688. doi: 10.1016/j.ccr.2011.10.015. [DOI] [PMC free article] [PubMed] [Google Scholar]
- 42.Glaumann H, Motakefi AM, Jansson H. Intracellular distribution and effect of the antimalarial drug mefloquine on lysosomes of rat liver. Liver. 1992;12(4 pt 1):183–190. doi: 10.1111/j.1600-0676.1992.tb01045.x. [DOI] [PubMed] [Google Scholar]
- 43.Johansson AC, Steen H, Ollinger K, Roberg K. Cathepsin D mediates cytochrome c release and caspase activation in human fibroblast apoptosis induced by staurosporine. Cell Death Differ. 2003;10(11):1253–1259. doi: 10.1038/sj.cdd.4401290. [DOI] [PubMed] [Google Scholar]
- 44.Yeung BH, Huang DC, Sinicrope FA. PS-341 (bortezomib) induces lysosomal cathepsin B release and a caspase-2-dependent mitochondrial permeabilization and apoptosis in human pancreatic cancer cells. J Biol Chem. 2006;281(17):11923–11932. doi: 10.1074/jbc.M508533200. [DOI] [PubMed] [Google Scholar]
- 45.Zhang H, Zhong C, Shi L, Guo Y, Fan Z. Granulysin induces cathepsin B release from lysosomes of target tumor cells to attack mitochondria through processing of bid leading to Necroptosis. J Immunol. 2009;182(11):6993–7000. doi: 10.4049/jimmunol.0802502. [DOI] [PubMed] [Google Scholar]
- 46.Eberhard Y, et al. Chelation of intracellular iron with the antifungal agent ciclopirox olamine induces cell death in leukemia and myeloma cells. Blood. 2009;114(14):3064–3073. doi: 10.1182/blood-2009-03-209965. [DOI] [PubMed] [Google Scholar]
- 47.Karle JM, Olmeda R, Gerena L, Milhous WK. Plasmodium falciparum: role of absolute stereochemistry in the antimalarial activity of synthetic amino alcohol antimalarial agents. Exp Parasitol. 1993;76(4):345–351. doi: 10.1006/expr.1993.1042. [DOI] [PubMed] [Google Scholar]
- 48.Wallen L, Ericsson O, Wikstrom I, Hellgren U. High-performance liquid chromatographic method for the enantioselective analysis of mefloquine in plasma and urine. J Chromatogr B Biomed Appl. 1994;655(1):153–157. doi: 10.1016/0378-4347(94)00027-1. [DOI] [PubMed] [Google Scholar]
- 49.Mullie C, Jonet A, Desgrouas C, Taudon N, Sonnet P. Differences in anti-malarial activity of 4-aminoalcohol quinoline enantiomers and investigation of the presumed underlying mechanism of action. Malar J. 2012;11:65. doi: 10.1186/1475-2875-11-65. [DOI] [PMC free article] [PubMed] [Google Scholar]
- 50.Fehrenbacher N, et al. Sensitization to the lysosomal cell death pathway by oncogene-induced down-regulation of lysosome-associated membrane proteins 1 and 2. Cancer Res. 2008;68(16):6623–6633. doi: 10.1158/0008-5472.CAN-08-0463. [DOI] [PubMed] [Google Scholar]
- 51.Huynh KK, Eskelinen EL, Scott CC, Malevanets A, Saftig P, Grinstein S. LAMP proteins are required for fusion of lysosomes with phagosomes. EMBO J. 2007;26(2):313–324. doi: 10.1038/sj.emboj.7601511. [DOI] [PMC free article] [PubMed] [Google Scholar]
- 52.Thiele DL, Lipsky PE. The action of leucyl-leucine methyl ester on cytotoxic lymphocytes requires uptake by a novel dipeptide-specific facilitated transport system and dipeptidyl peptidase I-mediated conversion to membranolytic products. J Exp Med. 1990;172(1):183–194. doi: 10.1084/jem.172.1.183. [DOI] [PMC free article] [PubMed] [Google Scholar]
- 53.Thiele DL, Lipsky PE. Mechanism of L-leucyl-L-leucine methyl ester-mediated killing of cytotoxic lymphocytes: dependence on a lysosomal thiol protease, dipeptidyl peptidase I, that is enriched in these cells. Proc Natl Acad Sci U S A. 1990;87(1):83–87. doi: 10.1073/pnas.87.1.83. [DOI] [PMC free article] [PubMed] [Google Scholar]
- 54.Sardiello M, et al. A gene network regulating lysosomal biogenesis and function. Science. 2009;325(5939):473–477. doi: 10.1126/science.1174447. [DOI] [PubMed] [Google Scholar]
- 55.Eppert K, et al. Stem cell gene expression programs influence clinical outcome in human leukemia. Nat Med. 2011;17(9):1086–1093. doi: 10.1038/nm.2415. [DOI] [PubMed] [Google Scholar]
- 56.Gentles AJ, Plevritis SK, Majeti R, Alizadeh AA. Association of a leukemic stem cell gene expression signature with clinical outcomes in acute myeloid leukemia. JAMA. 2010;304(24):2706–2715. doi: 10.1001/jama.2010.1862. [DOI] [PMC free article] [PubMed] [Google Scholar]
- 57.Kikushige Y, et al. TIM-3 is a promising target to selectively kill acute myeloid leukemia stem cells. Cell Stem Cell. 2010;7(6):708–717. doi: 10.1016/j.stem.2010.11.014. [DOI] [PubMed] [Google Scholar]
- 58.Basano SA, Bianco A, Taylor WR, Olliaro P, Camargo LM. An in vivo test to assess mefloquine 25 mg/kg for the treatment of uncomplicated falciparum malaria in Rondonia, Brazil. Braz J Infect Dis. 2006;10(4):279–282. doi: 10.1590/S1413-86702006000400013. [DOI] [PubMed] [Google Scholar]
- 59.Charles BG, et al. Population pharmacokinetics of mefloquine in military personnel for prophylaxis against malaria infection during field deployment. Eur J Clin Pharmacol. 2007;63(3):271–278. doi: 10.1007/s00228-006-0247-3. [DOI] [PubMed] [Google Scholar]
- 60.Nevin RL. Pharmacokinetic considerations in the repositioning of mefloquine for treatment of progressive multifocal leukoencephalopathy. Clin Neurol Neurosurg. 2012;114(8):1204–1205. doi: 10.1016/j.clineuro.2012.02.046. [DOI] [PubMed] [Google Scholar]
- 61.Hu YL, et al. Hypoxia-induced autophagy promotes tumor cell survival and adaptation to antiangiogenic treatment in glioblastoma. Cancer Res. 2012;72(7):1773–1783. doi: 10.1158/0008-5472.CAN-11-3831. [DOI] [PMC free article] [PubMed] [Google Scholar]
- 62.Yang ZJ, Chee CE, Huang S, Sinicrope FA. The role of autophagy in cancer: therapeutic implications. Mol Cancer Ther. 2011;10(9):1533–1541. doi: 10.1158/1535-7163.MCT-11-0047. [DOI] [PMC free article] [PubMed] [Google Scholar]
- 63.Bellodi C, et al. Targeting autophagy potentiates tyrosine kinase inhibitor-induced cell death in Philadelphia chromosome-positive cells, including primary CML stem cells. J Clin Invest. 2009;119(5):1109–1123. doi: 10.1172/JCI35660. [DOI] [PMC free article] [PubMed] [Google Scholar]
- 64.Ding WX, et al. Oncogenic transformation confers a selective susceptibility to the combined suppression of the proteasome and autophagy. Mol Cancer Ther. 2009;8(7):2036–2045. doi: 10.1158/1535-7163.MCT-08-1169. [DOI] [PMC free article] [PubMed] [Google Scholar]
- 65.Geng Y, Kohli L, Klocke BJ, Roth KA. Chloroquine-induced autophagic vacuole accumulation and cell death in glioma cells is p53 independent. Neuro Oncol. 2010;12(5):473–481. doi: 10.1093/neuonc/nop048. [DOI] [PMC free article] [PubMed] [Google Scholar]
- 66.Maclean KH, Dorsey FC, Cleveland JL, Kastan MB. Targeting lysosomal degradation induces p53-dependent cell death and prevents cancer in mouse models of lymphomagenesis. J Clin Invest. 2008;118(1):79–88. doi: 10.1172/JCI33700. [DOI] [PMC free article] [PubMed] [Google Scholar]
- 67.Fehrenbacher N, et al. Sensitization to the lysosomal cell death pathway upon immortalization and transformation. Cancer Res. 2004;64(15):5301–5310. doi: 10.1158/0008-5472.CAN-04-1427. [DOI] [PubMed] [Google Scholar]
- 68.Ono K, Kim SO, Han J. Susceptibility of lysosomes to rupture is a determinant for plasma membrane disruption in tumor necrosis factor alpha-induced cell death. Mol Cell Biol. 2003;23(2):665–676. doi: 10.1128/MCB.23.2.665-676.2003. [DOI] [PMC free article] [PubMed] [Google Scholar]
- 69.Palmieri M, et al. Characterization of the CLEAR network reveals an integrated control of cellular clearance pathways. Hum Mol Genet. 2011;20(19):3852–3866. doi: 10.1093/hmg/ddr306. [DOI] [PubMed] [Google Scholar]
- 70.Pena-Llopis S, et al. Regulation of TFEB and V-ATPases by mTORC1. EMBO J. 2011;30(16):3242–3258. doi: 10.1038/emboj.2011.257. [DOI] [PMC free article] [PubMed] [Google Scholar]
- 71.Settembre C, et al. TFEB links autophagy to lysosomal biogenesis. Science. 2011;332(6036):1429–1433. doi: 10.1126/science.1204592. [DOI] [PMC free article] [PubMed] [Google Scholar]
- 72.Samudio I, et al. Pharmacologic inhibition of fatty acid oxidation sensitizes human leukemia cells to apoptosis induction. J Clin Invest. 2009;120(1):142–156. doi: 10.1172/JCI38942. [DOI] [PMC free article] [PubMed] [Google Scholar]
Associated Data
This section collects any data citations, data availability statements, or supplementary materials included in this article.