INTRODUCTION
Tumors contain many components in addition to the cancer cells, including blood vessels, fibroblasts, and immune cells. Genetic studies and tumor biopsies have generated insights into the importance of these stromal components for cancer progression. However, it remains a challenge to reveal the dynamic interactions among the distinct tumor components within live animals. Studies involving multiphoton microscopy allow direct imaging of cellular movement in live mice, but multiphoton microscopy is expensive, complex, and usually relies on a single excitation wavelength for all fluorophores. This article describes a method for intravital imaging using a microlensed spinning-disk confocal microscope. Although tissue penetration with spinning-disk confocal microscopy is lower than with multiphoton microscopy, image acquisition with this method is very rapid, so artifacts from respiratory motion are avoided. Photobleaching and phototoxicity are low, and multicolor acquisition is cheaper and easier than with multiphoton microscopy. This article discusses various aspects of experimental setup, as well as methods for addressing technical barriers, such as generating and working with multiple tumor microenvironments within individual live mice, image collection, and long-term anesthesia.
RELATED INFORMATION
A description of tumor components can be found in Egeblad (2010). For information about the role of stromal components in cancer progression, see Bissell and Radisky (2001), Bhowmick and Moses (2005), Littlepage et al. (2005), Proia and Kuperwasser (2005), and de Visser et al. (2006). Surgery and positioning of the mouse for intravital imaging with spinning-disk confocal microscopy are described in Preparation of Mice for Long-Term Intravital Imaging of the Mammary Gland (Ewald et al. 2011a). A monitoring protocol for long-term imaging (up to 40 h) is found in Monitoring of Vital Signs for Long-Term Survival of Mice Under Anesthesia (Ewald et al. 2011b).
IMAGING IN SITU IN THE LIVE ANIMAL TO PROVIDE INSIGHTS INTO TUMOR-STROMA INTERACTIONS
Recent pioneering studies have established intravital imaging techniques for imaging single-cell migration and vessel permeability, thus enabling direct studies of cellular behaviors within tissues in live mice (Brown et al. 2001, 2003; Pluen et al. 2001; Ahmed et al. 2002; Mempel et al. 2004; Sumen et al. 2004; Halin et al. 2005; Stroh et al. 2005; Dreher et al. 2006; Sidani et al. 2006; Wyckoff et al. 2006). These methods have mostly utilized multiphoton microscopy, which has the benefit of deeper tissue penetration than standard confocal microscopy. However, multiphoton microscopy is expensive to acquire, complex to operate, and generally relies on a single excitation wavelength for all fluorophores. Independent of microscope technique, it has also been difficult to maintain live mice on the microscope stage in a healthy state for extended periods of time.
To gain insight into cell behavior in progressively developing tumors, we sought to make quantitative comparisons of dynamics in different tumor microenvironments within individual live mice. This challenge had several key aspects:
fluorescent labeling of tumor components
minimally invasive access to the tissue
long-term anesthesia protocols
fast image collection to minimize motion artifacts
generation of multiple different tumor microenvironments in the same mouse
the ability to image several different tumor regions within the same mouse
a flexible multicolor excitation and detection scheme to follow the interactions between multiple cell types
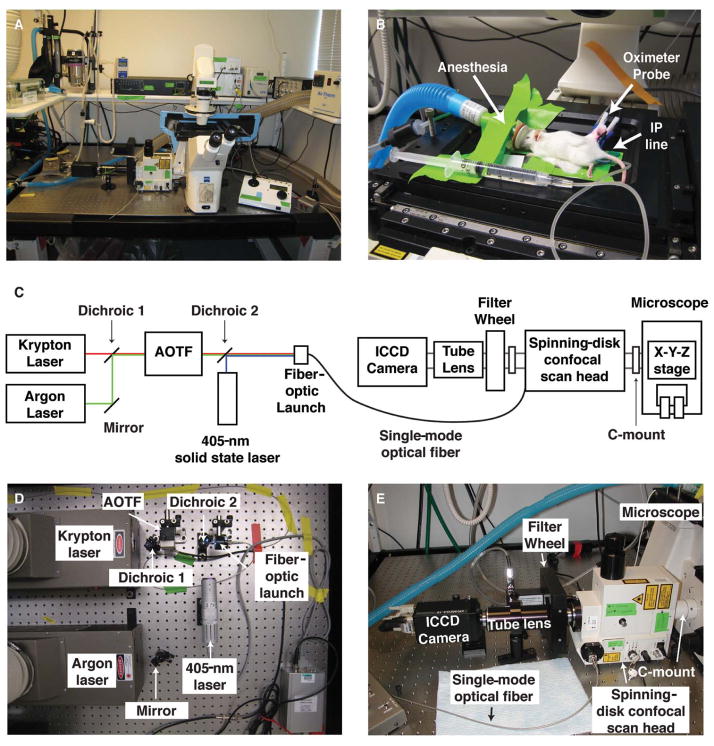
In the following section, we address each of the challenges arising from these issues and discuss our protocol for an intravital imaging system based on the microlensed spinning-disk confocal microscope (Fig. 1). This type of microscope uses two spinning disks: Illumination first strikes a microlensed Nipkow disk that focuses the light through pinholes in the second disk. A dichroic mirror is located between the two disks and is used to reflect the fluorescent confocal image back to an intensified charge-coupled device (ICCD) camera for acquisition of low-light images (Nakano 2002). Spinning-disk confocal microscopy has a more limited tissue penetration than multiphoton microscopy, but there are other attributes that make it useful for imaging in live animals. Image acquisition is very rapid, and depending on the fluorophore, a full field of 670 × 670 μm2 can be acquired within milliseconds (Nakano 2002). The rapid acquisition aids in overcoming the challenge of imaging in live mice, where the respiratory motion artifacts distort the image unless the images are acquired faster than the respiratory cycle. Another benefit of the rapid-image acquisition is low phototoxicity (Ross et al. 2006). Importantly, multicolor acquisition is also cheaper and easier to achieve using spinning confocal microscopy than multiphoton microscopy and can be performed in a lighted room, aiding in the observation of the mouse.
FIGURE 1.
A custom-built microlensed spinning-disk confocal microscope for fast four-color imaging in live mice. (A) The microscope system consists of lasers connected to a spinning-disk confocal scan head (shown: CSU-10b, Yokogawa Corporation; modified by Solamere Technology Group), which is connected directly to a motorized, inverted microscope (shown: Zeiss Axiovert 200M inverted fluorescence microscope; Carl Zeiss Inc.). The microscope’s power supplies and control equipment as well as the isoflurane anesthesia apparatus are stored on a shelf that is vibrationally uncoupled from the surface of the optical table. (B) Mice are kept anesthetized on the microscopic stage with gaseous isoflurane, hydrated with intraperitoneal (IP) saline infusions, and monitored with an oximeter probe. (C) Schematic of the microscope. (AOTF) Acousto-optic tunable filter; (ICCD) intensified charge-coupled device. (D) Detailed view of the excitation-beam path. We use a 405-nm solid state laser (Blue Sky Research) together with additional solid state lasers (491 nm, 561 nm, 641 nm) or argon and krypton lasers (shown: Dynamic Laser). The light from the argon laser (457 nm, 477 nm, 488 nm, 514 nm) is bounced off an adjustable mirror mount and combined with the light from the krypton laser (568 nm, 647 nm) using a dichroic mirror on an adjustable mount. The combined laser light then enters an AOTF (NEOS Technologies), permitting selection of laser lines and intensity modulation. A similar setup is used to combine light from the 491-, 561-, and 641-nm solid state lasers into the AOTF (not shown). The 405-nm solid state laser is controlled electronically. The output of the AOTF and the 405-nm solid state laser is combined with a second dichroic mirror and then launched into a single-mode optical fiber. The power intensity of all laser lines is controlled electronically using a custom laser control circuit (Solamere; not shown). (E) Detailed view of the emission path. The single-mode fiber optic enters the spinning-disk confocal scan head, which is attached to the microscope via a C-mount on its left side port. The confocal scan head is connected to the filter wheel via a custom adaptor (Solamere). Distinct emission spectra are selected using bandpass filters (BP435–485, BP500–550, BP560–620, and LP680; Chroma Technology Corp.). The resulting emission light passes through an automated filter wheel (FW-1000; ASI), and a custom lens tube (Solamere) connects the filter wheel to the ICCD camera (XR/MEGA-10EX S30; Stanford Photonics) and permits external fine focus adjustment of the fluorescent image to the camera. Note that imaging is possible in a well-lit room. (Adapted from Egeblad et al. 2008.) (For color figure, see doi: 10.1101/pdb.top97 online at www.cshprotocols.org.)
RESOLVING THE TECHNICAL BARRIERS TO IMAGING THE TUMOR MICROENVIRONMENT
The difficulties that arise in imaging in situ in the live mouse are numerous. We consider here each of these individually and present the primary solution we developed to deal with each problem as well as alternative approaches.
Generation of Multiple Different Tumor Microenvironments in the Same Mouse
Our Solution
We chose to use a progressive multifocal mouse model of breast cancer, the mouse mammary tumor virus long terminal repeat (LTR)-driven polyomavirus middle T antigen (MMTV-PyMT) (Guy et al. 1992) model because it has a high degree of molecular, cellular, and histologic similarity to human luminal type breast cancers (Lin et al. 2003; Herschkowitz et al. 2007). In this model, multiple independent lesions arise in all 10 mammary glands. At advanced stages, there is often a mix of hyperplasias, early carcinomas, and late carcinomas in the same mammary gland. We focused our efforts on the inguinal mammary gland (no. 4), which is surgically accessible and relatively isolated from the movement effects of breathing compared with the thoracic mammary glands (nos. 1–3).
Alternate Approaches
We used transgenically induced tumors, but the same surgical and imaging techniques will work for mammary carcinomas initiated by transplantation of tumor fragments (Kouros-Mehr et al. 2008) or injection of tumor cell lines (either mouse cells into syngenic mice or human cells into immune-deficient mice). Subcutaneous tumors, produced by intradermal injection of tumor cells in the inguinal region, would also be similarly accessible. We study the interactions between immune cells and mammary carcinomas and therefore concentrated our efforts on modeling breast cancer in mice with intact immune systems. However, our imaging techniques are readily adaptable to the study of human cancer cell lines in immune-compromised mice (e.g., nude or severe combined immunodeficient [SCID] mice).
Analysis of Multiple Tumor Microenvironments in the Same Mouse
Our Solution
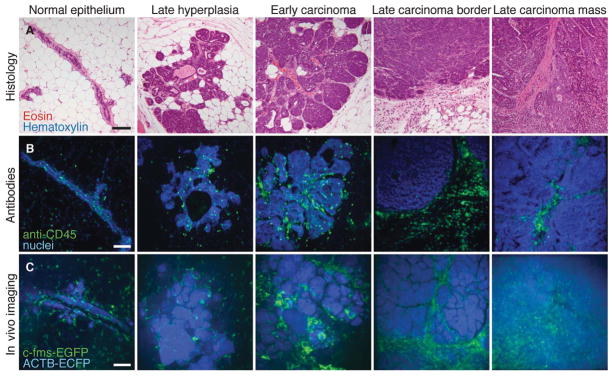
Within a single inguinal mammary gland of an MMTV-PyMT mouse, there are many discrete cancerous lesions at different stages of progression. To classify the stage of progression in a live tumor without the aid of hematoxylin- and eosin-stained paraffin sections, we used a simplified classification system and divided tumor lesions into broad categories that were recognizable in vivo (Fig. 2; Egeblad et al. 2008). Hyperplasias are defined as lesions with a diameter of <500 μm without excess stromal cell infiltration or invasion fronts. Early carcinomas are small-to-medium-sized lesions with increased stromal cell infiltration and invasion fronts. Late carcinomas are large lesions with compact cancer cells and massive stromal cell infiltration at the stromal border. This categorization system was robust between multiple mice and usefully subdivided lesions into categories that exhibited clearly distinct stromal cell behaviors.
FIGURE 2.
Imaging tumor microenvironments in live mice. (A) Examples of hematoxylin- and eosin-stained sections of MMTV-PyMT tumors at different stages are shown together with a normal duct from a wild-type mouse. (B) Leukocytes identified by immunofluorescence (anti-CD45, green) in mammary tissue and MMTV-PyMT tumors (nuclei stained with propidium iodide and colored blue). (C) Different tumor microenvironments within live MMTV-PyMT;ACTB-ECFP;c-fms-EGFP mice. The normal duct is from a live ACTB-ECFP;c-fms-EGFP mouse. Myeloid cells are green (c-fms-EGFP), and all cells are labeled blue (ACTB-ECFP). Images are maximum intensity projections. Scale bars, 100 μm. (Adapted from Egeblad et al. 2008.) (For color figure, see doi: 10.1101/pdb.top97 online at www.cshprotocols.org.)
Alternate Approaches
Cancer staging in live animals will necessarily use different criteria than hematoxylin- and eosin-stained paraffin sections. The goal should be a highly reproducible system that can be readily validated against more conventional classification systems. An alternative to our morphologic approach would be to use fluorescent reporters to define lesions by gene expression or molecular localization (e.g., loss of expression of the estrogen receptor or E-cadherin). These approaches are still emerging but could be very powerful.
Imaging Several Different Tumor Regions within the Same Mouse
Our Solution
To collect images from multiple regions within the gland, we utilized an x-y-piezo-z stage that enabled fast multiple-position imaging of different regions within the same mammary gland. A major advantage to this approach was that the different regions were being compared in the same time period, in the same animal, so that all systemic variables related to the health or global inflammatory status of the animal were held constant.
Alternate Approaches
One could, instead, compare different microenvironments in different mice. Each mouse would have a single tumor at a specific stage, and comparisons would be made between mice with similarly and differently staged tumors. However, variability between mice in systemic conditions such as circulating hormone levels, inflammation, or lung function could make it difficult to interpret whether differences in cell behavior were due to local or systemic effects.
Fluorescent Labeling of Tumor Components
Our Solution
We chose to label cell populations by crossing our cancer model with transgenic lines driving green fluorescent protein (GFP) under the control of a cell-type-specific promoter (e.g., c-fms-EGFP) (Fig. 2; Sasmono et al. 2003) or knock-in lines in which GFP was expressed under the control of the endogenous promoter (e.g., FoxP3EGFP) (Fontenot et al. 2005). There are several advantages to this approach: The transgenic lines were highly reproducible from one mouse to the next within a given parental line. Furthermore, all of the labeled cells in the tumor microenvironment populations were from the animal that was being imaged and were not exogenously introduced. There was also no injection- or transplantation-induced inflammation, and the transgenic lines were fully immune-competent.
Alternate Approaches
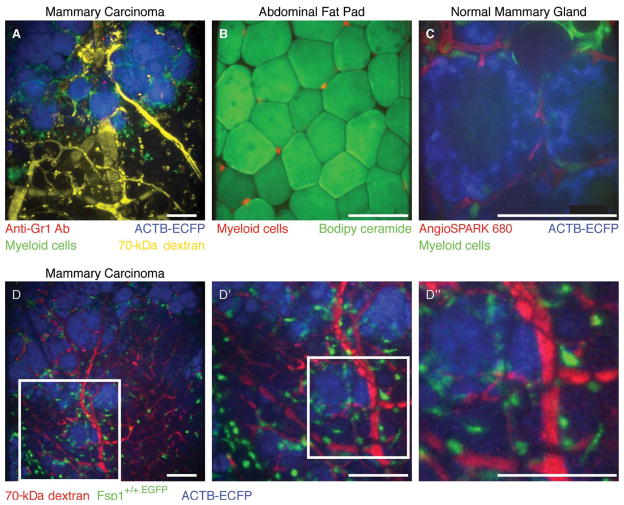
Our approach required us to generate mice with as many as three different transgenes. This complexity, compounded by our focus on mammary carcinomas in female mice, required us to maintain a significantly sized animal colony to provide a regular supply of mice for imaging. The approach is also slow for initiation of new labeling experiments; it can take 6 mo to generate tumor-bearing mice with new fluorescent reporters for imaging. An alternate and frequently utilized approach is to isolate a given stromal cell population from a donor animal, to label those cells in vitro, and then to transplant them into a new host animal. This technique permits visualization of any cell population that can be defined by cell surface markers and does not require knowledge of cell-type-specific promoters or enhancers. If the donor and host animals are from the same inbred strain and the reporter is not immunogenic, the transplantation experiment can be done in the presence of an intact host immune system. Using these approaches significantly reduces both the time required to generate a new labeled mouse and the total colony size required for a given experiment. However, there is always a concern that isolation, labeling, and reintroduction could induce biologically significant changes in the population being studied, and this approach is particularly a concern for immune cells. Techniques may also not be available to isolate a given cell population. As a third approach, we have labeled cell populations in vivo by their cell surface markers through injection of fluorescently labeled antibodies (Fig. 3A). Using this approach, we demonstrated that injection of anti-Gr1 antibodies into the tail vein of a mouse labeled a patrolling myeloid cell population within the blood vessels, consistent with identification of monocytes/neutrophils/myeloid suppressor cells (Egeblad et al. 2008). We have since expanded this approach to antibodies against other myeloid cell markers.
FIGURE 3.
Optical achievements with the microlensed spinning-disk confocal system. (A) Four-color imaging of a carcinoma in an MMTV-PyMT;ACTB-ECFP;c-fms-EGFP mouse coinjected with fluorescent 70-kDa dextran (false-colored yellow) and anti-Gr1 antibody conjugated to Alexa 647 (red) using a Fluar 10×/0.5-NA (numerical aperture) lens. Myeloid cells are labeled green (c-fms-EGFP), and all cells are labeled blue (ACTB-ECFP) with the strongest expression of ECFP in carcinoma cells. Isotype-matched control antibodies did not label cells in the tumors (not shown). Note the Gr1+ cells (red) inside the blood vessels (yellow) and the uptake of dextran (yellow) by cells in the stroma. (Adapted, with permission, from Egeblad et al. 2008.) (B) Image of myeloid cells (red) localized between fat cells (green) within the abdominal fat pad of a mouse with red myeloid cells using an LD Plan-Neofluar 20×/0.4-NA lens. Fat cells were labeled by adding Biodipy directly to the tissue before imaging. (C) Image of a mammary gland during involution in an ACTB-ECFP;c-fms-EGFP mouse injected intravenously with AngioSPARK 680 using an LD C-Apochromat 40×/1.1-NA water-immersion lens. Myeloid cells (green, c-fms-EGFP) are found next to the epithelial lobular-alveolar structures (blue, ACTB-ECFP; note the absence of labeling in cell nuclei and lipid vacuoles) and the capillaries (red, labeled with AngioSPARK 680). Note the intravascular myeloid cell in the upper-left corner. (D) The image size and the pixel resolution at the image demonstrated on an MMTV-PyMT;ACTB-ECFP;Fsp1+/+.EGFP mouse immediately after intravenous injection with 70-kDa rhodamine-conjugated dextran using a Fluar 10×/0.5-NA lens. (D′, D″) The same maximum intensity projection is shown at increasing magnification. Scale bars, 100 μm. (For color figure, see doi: 10.1101/pdb.top97 online at www.cshprotocols.org.)
Minimally Invasive Access to the Tissue
Our Solution
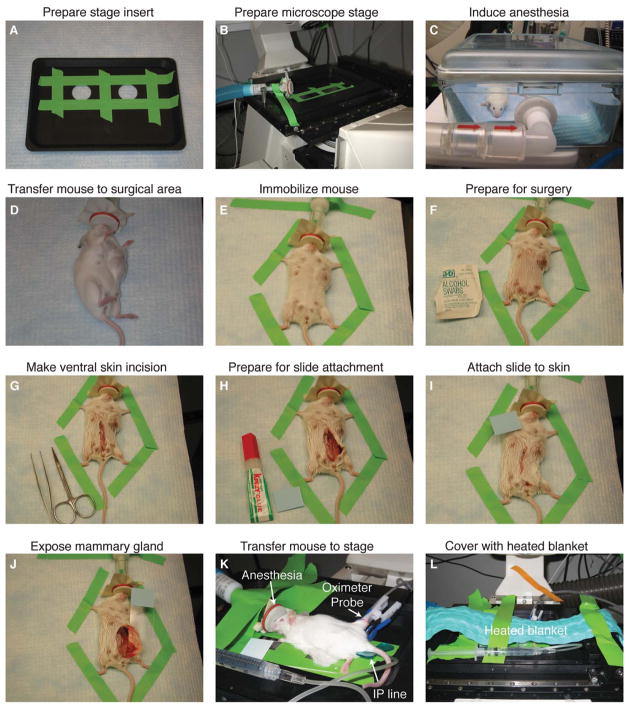
We relied on exposing the fourth inguinal mammary gland by creating a skin flap and subsequent imaging of the internal surface of this gland through a coverslip portal in a stage insert on an inverted microscope (for details, see Fig. 4 and Preparation of Mice for Long-Term Intravital Imaging of the Mammary Gland [Ewald et al. 2011a]). This surgery does not compromise the peritoneal cavity or any major blood vessels and is generally well tolerated by the mice. It is relatively easily taught and permits a single, extended, nonsurvival imaging session. In principle, the incision could be sutured following imaging, and the same mouse could be reimaged at a subsequent date. We always did a single imaging session and conducted the experiment as a nonsurvival surgery. We took care to sterilize our tools, work in a clean environment, use sterile solutions, and practice aseptic techniques during surgery. When such steps were taken, there was minimal inflammatory response to the surgery itself during our imaging experiments.
FIGURE 4.
Surgical preparation of mice for long-term intravital imaging of tumor-stroma interactions in the mammary gland. (A) Coverslips are taped over the imaging ports of a custom stage insert (ASI). (B) The stage insert is placed in the x-y-z stage, and the isoflurane anesthesia line is secured to the stage. (C) The mouse is initially anesthetized with 4% isoflurane (21% oxygen, balance nitrogen) until breathing is deep and slow (2–4 min); thereafter (D) it is transferred to the surgical area, and isoflurane is reduced to 2.5%. (E) The mouse is immobilized with laboratory tape; (F) the ventral surface of the mouse is prepared for surgery with an isopropyl alcohol swab; and (G) a ventral midline incision is made with sterilized scissors. (H, I) To position the mammary gland on the microscope stage, a glass slide is attached to the skin and fur (outside surface) of the mouse using Krazy Glue. (J) The glass slide is rotated to expose the inner surface of the mammary gland; and (K) the mouse is transferred to the stage and isoflurane is reduced to 0.9%–1.1%. An indwelling IP line is inserted with a winged infusion set (for administration of saline 50 μL/h), and an oximeter probe is attached to the thigh of the mouse. (L) A recirculating heated water blanket is placed over the mouse during imaging. (For color figure, see doi: 10.1101/pdb.top97 online at www.cshprotocols.org.)
Alternate Approaches
There are multiple published examples of implanted imaging windows, including those in the dorsal skin (Lehr et al. 1993). Recent efforts have generated protocols for implanting imaging windows over the inguinal mammary gland to permit longitudinal imaging (Shan et al. 2003; Kedrin et al. 2008). These ventral windows require a more sophisticated surgical approach but are impressive and could be combined with our anesthesia and imaging approaches.
Long-Term Anesthesia
Our Solution
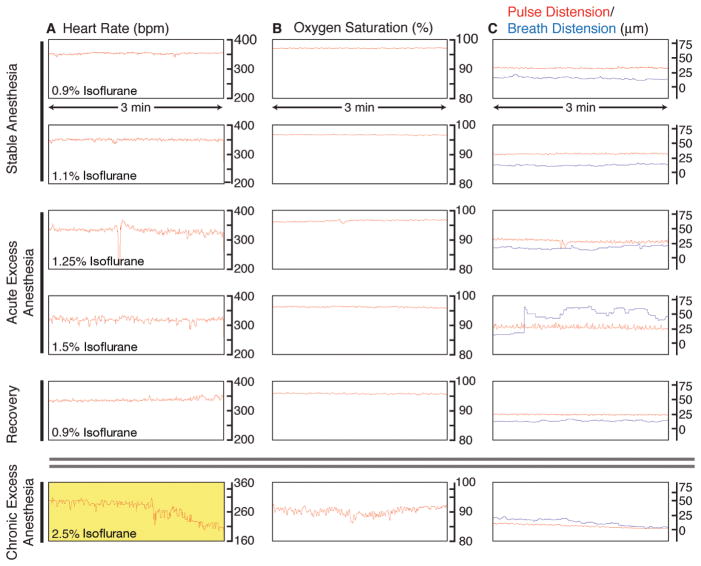
We induce anesthesia with a relatively high dose of isoflurane (4%), verify nonresponsiveness, perform the surgery under a moderate dose of anesthesia (2.5%), and then image with a relatively lower dose, typically 0.9%–1.2%. Anesthesia at these levels maintains the mouse in a nonresponsive state but permits a nonforced respiratory pattern. When we used higher levels of anesthesia (1.5%–2.5%), we observed no difference in responsiveness but noticed a dramatic difference in respiration. Persistent anesthesia at levels beyond 1.5% isoflurane induced a gasping behavior and decreased the survival time of the animals (for details, see Fig. 5 and Monitoring of Vital Signs for Long-Term Survival of Mice under Anesthesia [Ewald et al. 2011b]). We monitored the individual responsiveness of the mouse to anesthesia using an oximeter probe attached to its thigh and received real-time information about the heart rate, blood-oxygenation levels, and vascular distension. Isoflurane anesthesia was adjusted continuously in real time in response to the vital signs from the oximeter. Each mouse responded slightly differently with consistent variations in responsiveness based on age, strain back-ground, and health of the animal. Our anesthesia equipment enabled independent regulation of the oxygen and isoflurane levels, and oxygen levels were adjusted to maintain blood-oxygenation levels above 95% saturation throughout the procedure.
FIGURE 5.
Monitoring of vital signs during long-term anesthesia and imaging. An oximeter probe attached to the thigh of the mouse is used to measure (A) the heart rate (beats per minute, bpm), (B) the arterial oxygen saturation of the blood (percent, %), and (C) the distension of blood vessels caused by the pulse and the breathing (micrometers, μm). Traces are 3-min long, originating from a single 9-h image session. (A) Under stable anesthesia (0.9%–1.1% isoflurane), the heart rate is steady and typically between 300 bpm and 450 bpm. With acute excess anesthesia, 1.25%–1.5% isoflurane, the heart rate lowers and becomes erratic. Recovery is achieved by reducing isoflurane concentration to 0.9%, and the heart rate stabilizes. At chronic excess anesthesia levels (2.5% isoflurane), the heart rate declines to critically low levels (yellow, <210 bpm). (B) Oxygen saturation stays at ~97% at anesthesia levels of 0.9%–1.25% isoflurane. It falls toward 90%–95% at 1.5% isoflurane and is slower to recover than heart rate when isoflurane is restored to 0.9%. At chronically high anesthesia levels, oxygen saturation dips to <90%. (C) Under stable anesthesia, the vascular distension caused by the pulse is relatively constant and is of higher amplitude than the vascular distension caused by breathing. At 1.25% isoflurane, the breath distension increases in amplitude, and, at 1.5% isoflurane, the mouse begins gasping, and the distension caused by breathing becomes irregular and exceeds pulse distension. At 0.9% isoflurane, the mouse recovers. Chronic exposure to excess isoflurane (2.5% isoflurane) results in a decline in the distension caused by pulse and breathing. (For color figure, see doi: 10.1101/pdb.top97 online at www.cshprotocols.org.)
Important Safety Information
Our animal protocol requires verification of nonresponsiveness at 15-min intervals to enable prompt intervention if the animal becomes responsive during imaging. These requirements will vary from institution to institution but will generally require that an alert trained operator is present throughout imaging. Accordingly, it is important to give some consideration to the human engineering of the imaging space and to have highly reliable ventilation to prevent exposure of the operator to anesthesia. Isoflurane is a potent human anesthetic and should only be handled by trained operators and in a highly ventilated room with vacuum-assisted removal of excess isoflurane.
Alternate Approaches
In preliminary studies, we used Avertin followed by urethane (ethyl carbamate, NH2COOCH2CH3) as injected anesthetics. The Avertin induced a nonresponsive state that enabled surgery, and urethane allowed long-term anesthesia (6–12 h) during imaging. These drugs do not require dedicated equipment to administer or continuous administration once an appropriate dose is achieved. They are a viable option for relatively short-term imaging studies (4–10 h). We discontinued using urethane for several reasons. The first is that urethane is a carcinogen and poses a potential risk to the scientist. The second is that it is difficult to calibrate the dose for the individual mouse. Too low a dose, and the mouse can become responsive; too high a dose, and the mouse dies. Finally, urethane was not consistent with the duration of movies that we sought to collect (10–40 h).
Mouse Care on the Microscope Stage
Our Solution
Anesthesia lowers the respiratory rate and body temperature of the mouse. Without supplemental heat, mice under anesthesia will often die within hours. We covered mice with a recirculating water blanket. The carrier gas for the isoflurane comes from a pressurized gas tank and has low humidity. To avoid irritating and collapsing the lungs with long-term exposure to the dry air, we humidified the gas before dispensing it to the animal. We also compensated for loss of fluid by supplementing saline at a rate of 50 μL/h with an indwelling peritoneal line. We used sterile phosphate-buffered saline (PBS) without calcium or magnesium. We avoided calcium or magnesium because changing the concentration of these electrolytes affects the physiology of the mouse and can have dramatic and undesirable effects on, for example, the cardiovascular system.
Alternate Approaches
During long imaging sessions, mice will require supplemental fluids, so there are not many alternatives to saline administration. For our purposes, the intraperitoneal site was most convenient. The temperature of the animal could be maintained by several alternate techniques including the use of a whole microscope enclosure chamber (e.g., Okolab or PeCon) or an on-stage heating system (e.g., Tokai Hit, Okolab, PeCon). It is necessary to maintain convenient access to the mouse, and it is strongly desirable to have a viewing path for optical observation of the mouse. One possibility is to build a heating chamber out of Plexiglas. Alternately, if an opaque enclosure is required for optical reasons, at least one panel should contain a portal for viewing as needed.
Microscope System Selection: Custom or Turnkey?
Our Solution
We chose to custom-configure a spinning-disk confocal microscope with the assistance of a microscope integration company (Fig. 1) (Solamere Technology Group). When we built the first version of this system in 2004, we selected the Yokogawa spinning-disk confocal scan head (CSU-10) because of its relatively high intrinsic scan rate (30 Hz compared with then typical laser-scanning rates of 0.1–1 Hz) and its modularity. It can be readily mounted on the side port of any common microscope and can interface with a wide range of filter wheels and cameras. Because each element of our microscope was independently selectable, we were able to select best-in-class components and then modify them to ensure maximum reliability. Individual components are discussed below. By custom configuring our microscope, we were able to build a highly reliable microscope that was greatly optimized for our application. The complete imaging systems available from the major microscope manufacturers are of very high quality but are necessarily a series of compromises to enable a broad range of applications and a diverse user group. If the microscope is being optimized for a single application to be run by expert users, it is nearly always possible to improve on existing commercial systems. The first and last authors of this chapter have since purchased new spinning-disk confocal systems of the same design. Where components have changed significantly, the systems are indicated as the 2004 or 2009 microscopes.
Alternate Approaches
It can be highly advantageous to purchase a fully integrated commercial system if in vivo imaging in mice is only one of a broad range of applications and/or the user group will be quite diverse in training and level of commitment. Furthermore, a new microscope may not be an immediate possibility for economic reasons. In those cases, our recommended strategy is to identify all nearby and available microscopes and test their sensitivity and suitability. The only rigorous way to compare the suitability of microscopes for live mouse imaging is to bring the mouse to each of the microscope stages. Before purchasing our system, we tested the performance of six very different microscopes on the same transgenic fluorescent reporter lines. We recommend that test samples be imaged at full power for 1000 consecutive frames (or until bleached), then 50% power, and then 10% in comparable regions. The key is to determine if there is some setting under which the microscope can collect a long series of images without significant photobleaching while generating acceptable images. This test is important for two-photon microscopes as well, because they deliver very significant laser intensity to the plane of focus. If the best available microscope still bleaches significantly at the lowest practical laser power setting, it might be possible to upgrade the microscope. In particular, upgrading the objective lenses can be very efficient because lenses at the same magnification may vary by 10 times or more in brightness. Other variables that can be manipulated to achieve better performance for live imaging are the selection of filters and dichroics, and, for spinning-disk confocal microscopes, the sensitivity of the charge-coupled device (CCD) camera.
Inverted or Upright Microscope Selection
Our Solution
The major choice to make for the microscope stand itself is whether to use an upright or an inverted configuration. We chose an inverted Zeiss microscope (2004 system: Zeiss Axiovert 200M; 2009 system: Zeiss Axio Observer.Z1) because it gave us the easiest access to the mammary gland by enabling us to position the inner surface of the mammary gland in direct juxtaposition to a no. 1 thickness cover glass. Furthermore, the movement of the objective lenses was not physically restricted by the belly of the mouse. Additional advantages were that the mouse was physically quite stable in a face-down position with gravity assisting in maintaining the relative position of the mouse on the stage. Another important advantage is that an inverted configuration also permitted use of air (Figs. 2C, 3A, B, C, 6A, 7, 8, 9), water (Fig. 3C), glycerine, and oil (Fig. 6B) immersion lenses.
FIGURE 6.
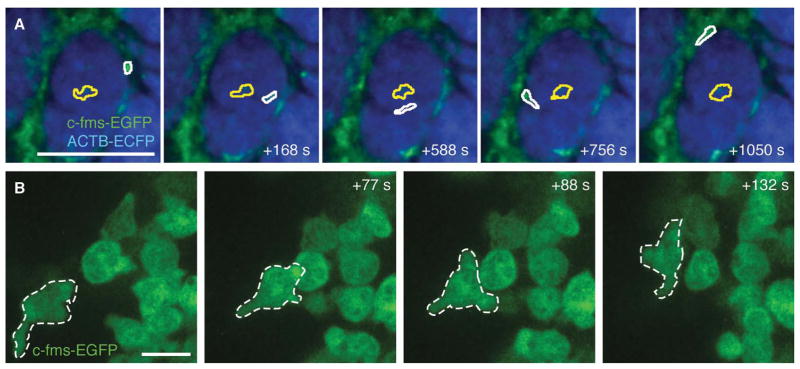
Time-lapse imaging of myeloid cell migration in vivo. (A) Example of migrational behavior of two myeloid cells in a late carcinoma: a low-migratory cell within a mass of cancer cells (yellow outline) and an extravasating and fast migrating cell (white outline) in an MMTV-PyMT;ACTB-ECFP;c-fms-EGFP mouse. See also Movie 1 for time-lapse recordings of the same field. Scale bar, 100 μm. (B) High-resolution imaging of c-fms-EGFP+ myeloid cells in the mammary gland of a live ACTB-ECFP;c-fms EGFP mouse using a Plan-Apochromat 63×/1.4-NA lens with oil immersion. One cell (outlined in white) was tracked over time. See also Movie 2 for time-lapse recordings of the same field. Scale bar, 10 μm. (For color figure, see doi: 10.1101/pdb.top97 online at www.cshprotocols.org.)
FIGURE 7.
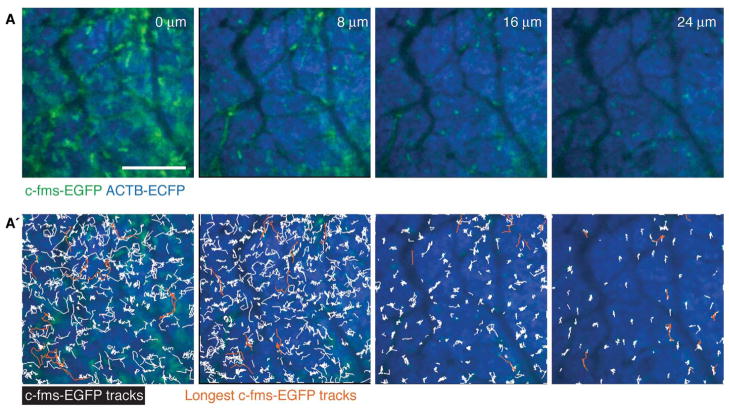
Myeloid cell migration is highest at the tumor border. (A) Different depths of the same tumor with (A′) trajectories of single c-fms-EGFP+ myeloid cells tracked over 1 h in the same tissue in an MMTV-PyMT;ACTB-ECFP;c-fms-EGFP mouse. The 10 trajectories with the most displacement are shown in orange. Scale bars, 100 μm. (For color figure, see doi: 10.1101/pdb.top97 online at www.cshprotocols.org.)
FIGURE 8.
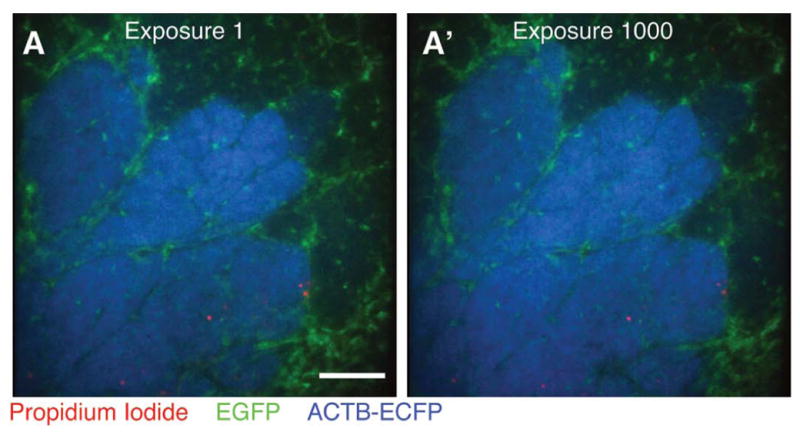
Minimal photobleaching in vivo using microlensed spinning-disk confocal microscopy. A single optical section was imaged 1000 consecutive times in three colors—EGFP (green), ECFP (blue) propidium iodide (PI; red)—in an MMTV-PyMT;ACTB-ECFP;c-fms-EGFP mouse injected intraperitonally with PI to label dead cells. Images are shown at (A) exposure 1 and (A′) exposure 1000 Scale bar, 100 μm. (For color figure, see doi: 10.1101/pdb.top97 online at www.cshprotocols.org.)
FIGURE 9.
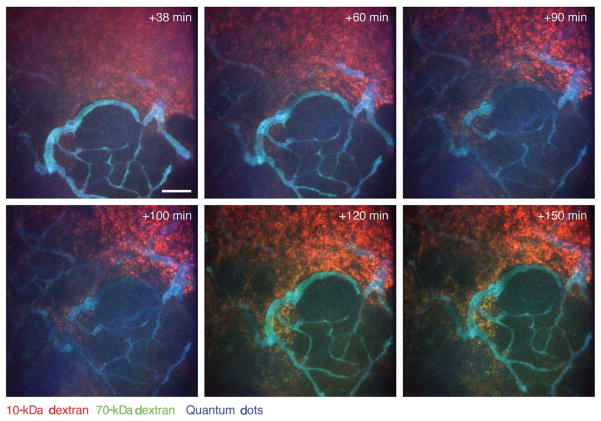
Dynamics of vascular leakage in neoplastic tissue followed by intravital imaging. Leakage of high-molecular-weight (70 kDa; green) and low-molecular-weight (10 kDa; red) dextrans into a late-stage carcinoma in an MMTV-PyMT mouse is shown. The dextrans were injected intravenously together with nontargeted quantum dots (blue) that did not leak during the imaging period (the tumor tissue is not labeled); a minimal amount of high-molecular-weight (green) dextran leaked during early time points, but it is seen colocalized with the low-molecular-weight (red) dextran (resulting in yellow) at later time points. Images are shown at indicated times after intravenous injection. Maximum intensity projections. Scale bar, 100 μm. (For color figure, see doi: 10.1101/pdb.top97 online at www.cshprotocols.org.)
Alternate Approaches
Many scientists in the neuroscience and immunology fields prefer an upright microscope with a water-dipping lens. There are also sometimes attractive microscope options that are available only on upright configurations. In vivo imaging works on an upright microscope but requires great care to ensure the ongoing cleanliness of the operated site, to retain the hydration of the exposed tissue, and to maintain optical access to the tissue without exposing vulnerable elements of the objective lens to the bodily fluids of the mouse.
Fast Image Collection to Minimize Motion Artifacts
Our Solution
We chose a relatively fast spinning-disk confocal scan head (30 Hz; 2004 system: Yokogawa CSU-10; 2009 system: Yokogawa CSU-X1). Note that the clock rate of the scan head only determines how fast one can scan but does not guarantee that one can collect enough light for an acceptable image in 33 msec. We chose an image-intensified CCD camera (Stanford Photonics XR/Mega-10EX S30) to maximize the sensitivity of the system. It is also critical that the software be fast, stable, and efficient in handling large numbers of files. Over the course of a typical imaging session, we collect 540 exposures for each of four colors in three z planes in five fields. This scheme generates 32,400 images or ~64.8 Gb of image files (assuming 1024 × 1024-pixel images at 2 Mb per image). Therefore, even a small persistent memory leak in the acquisition software will eventually crash the system. We ran our 2004 system with MediaCybernetics QED InVivo, and we run our 2009 systems with μManager, an open-source software program.
Alternate Approaches
The major alternatives to ICCD cameras are electron-multiplying CCD cameras (EMCCDs; e.g., Hamamatsu C9100-02). EMCCDs are somewhat less sensitive than intensified CCDs but generally have lower noise. If assembling a custom system, verify in advance of purchase that all components can be run by the same software.
Flexible Multicolor Excitation
Our 2004 Approach
We combined the laser lines from an argon (457-nm, 488-nm, 514-nm), a krypton (568-nm, 647-nm), and a solid-state 405-nm laser. As mentioned, a typical imaging session easily involves about 33,000 images, and so just 30 d of long-term imaging moves the system through one million repetitions. We initially used a mechanical shutter for the 405-nm laser but found that it failed every few hundred thousand repetitions. This experience made it clear that minimizing moving parts was essential. We achieved that using electronic control of the 405-nm solid-state laser (custom power circuit; Solamere Technology Group), an acousto-optic tunable filter (AOTF; NEOS Technologies) for the argon and krypton lasers, a quadruple pass dichroic, and a corresponding excitation clean-up filter (both by Semrock).
Our 2009 Approach
One of our newest systems utilizes all solid-state lasers (405-nm, 491-nm, 561-nm, and 641-nm laser lines), and the other utilizes an argon laser (457 nm, 488 nm, and 514 nm, which was chosen to allow optimal excitation of both yellow fluorescent protein [YFP] and GFP) combined with three solid-state lasers (405 nm, 561 nm, and 641 nm). The broadest AOTF available to us at present spans from ~440 to 660 nm and is unable to regulate a 405-nm beam. Consequently, we continue to control the 405-nm laser by direct power modulation, and the other lines by AOTF.
Alternate Approaches
There is a broad diversity of laser sources available today, and many combinations are available depending on specific applications.
Emission Selection
Our Solution
There are two basic detection configurations for multicolor fluorescence imaging. For maximum speed, one can illuminate the sample with all desired laser lines, simultaneously excite all of the dyes in the sample, and then separate the multiple emission signals to different detectors using dichroic mirrors. Alternately, one can maximize fluorescence selectivity and minimize cross talk between channels by illuminating the sample with an individual laser line, exciting and detecting a single fluorophore, and building up a multicolor image through a consecutive series of single color images. We chose to maximize fluorescence selectivity with single color images and used an AOTF and direct power modulation to enable fast switching between individual excitation laser lines. We then selected the specific emission resulting from each laser line using emission filters in a reasonably fast (20–30 msec), very robust filter wheel (Applied Scientific Instrumentation [ASI] FW-1000).
Alternate Approaches
With a spinning-disk confocal scan head and a single CCD camera, most users will use a filter wheel with emission filters to select wavelength. However, many laser-scanning systems instead rely on a prism or optical grating to spectrally separate the emission light onto an array of detectors.
Objective Lenses
Our Solution
The easiest large-impact change that a user can make to an existing microscope system is the objective lens. Generally, the higher the numerical aperture (NA) of the lens is, the brighter and higher the resolution of the resulting image. The effect is nonlinear and can result in very large differences between lenses of the same magnification. The NA of a lens is determined both by the solid angle of light it is capable of collecting from the sample and the index of refraction of the medium between the lens and the coverslip. The larger the angle is, the higher the NA. Many high-NA lenses have short focal distances and very limited working distance past the coverslip surface. In our experiments, working distance was a critical performance-determining variable. Many high-NA lenses did not have the working distance to reach relevant parts of our sample. Additionally, higher NA does not necessarily mean a brighter image deep within a live scattering tissue. In our experience, the best approach is to test objective lenses in your own laboratory on your own samples and empirically determine which lenses function best in your assay. It is also critical to make sure that they are optimized for the wavelengths to be used, especially if a broad range of fluorophores is to be used (e.g., all of enhanced cyan fluorescent protein [ECFP], enhanced green fluorescent protein [EGFP], DsRed, Cy5). Essentially all modern lenses will perform well with green and red dyes, but performance with blue and long-red/infrared is highly variable. We have had the best experience doing live imaging with the following three Zeiss objective lenses: 10× Fluar 0.5 NA; 20× LD Plan-Neofluar 0.4 NA; and 40× LD C-Apochromat 1.1 NA (Fig. 3A–C). We find the 10× Fluar 0.5-NA lens very useful despite the low NA because it allows for fast acquisition of full field of 670 × 670 μm2 at a very reasonable pixel resolution (Fig. 3D). The resolution is high enough to allow tracking of single-cell migration over time (Fig. 6A). A 63× 1.4-NA (oil-immersion) lens allowed tracking of cells with much greater detail (Fig. 6B), but depth penetration was very limited.
x-y Stage
Our Solution
We chose an x-y stage with an integrated piezo-z insert (Applied Scientific Instrumentation MS-2000z). The piezo-z enabled fast z sectioning, and the stage was overall very accurate and reliable. Using the piezo-z, we could compare the migrational behavior of myeloid cells in different microenvironments at different tissue depths from the tumor-stroma interphase to the tumor (Fig. 7).
Alternate Approaches
If cost is important, the motor focus on the microscope can be used to generate z stacks, albeit at a slower rate. Alternatively, an objective-lens collar with a piezo-z can be used. We preferred the stage insert piezo-z because it permitted easy objective-lens changes.
Photobleaching
One major advantage of microlensed spinning-disk confocal microscopy is the limited photobleaching and phototoxicity, which is crucial when performing long continuous imaging. We achieved this low photobleaching through the use of minimal levels of excitation laser light, enabled by our very sensitive detection path (ICCD and optimized filters and dichroics). Whatever system is being used, it is critical to emphasize efficient collection of the emission light and minimal excitation laser light. We confirmed that photobleaching was, indeed, minimal using our system in vivo by comparing the image after the first exposure with images obtained after 1000 consecutive exposures (Fig. 8).
Alternate Approaches
Many microscopists use two-photon microscopes to minimize photobleaching and phototoxicity. However, two-photon microscopy’s main advantage is the vast reduction in excitation light delivered outside of the plane of focus. Within the plane of focus, two-photon microscopy actually relies on very high incident excitation light levels, and it is quite important to ensure that this light is kept at levels that do not perturb the system.
DISCUSSION
Using the imaging system described in this article and the protocols Preparation of Mice for Long-Term Intravital Imaging of the Mammary Gland (Ewald et al. 2011a) and Monitoring of Vital Signs for Long-Term Survival of Mice under Anesthesia (Ewald et al. 2011b), we routinely achieve four-color imaging within five to 10 different regions of the same mammary gland with continuous imaging for periods of 12–40 h. We are employing this imaging system to study stromal cell behavior (Egeblad et al. 2008) and vascular integrity (Fig. 9) in different tumor microenvironments. The method is flexible and has also been successfully adapted for imaging of the normal mammary gland (Fig. 3C), the abdominal fat pad (Fig. 3B), and the pancreas. It is our expectation that the surgery, anesthesia, and imaging techniques described herein will be readily adaptable to a broad range of organs and tissues.
MOVIE 1.
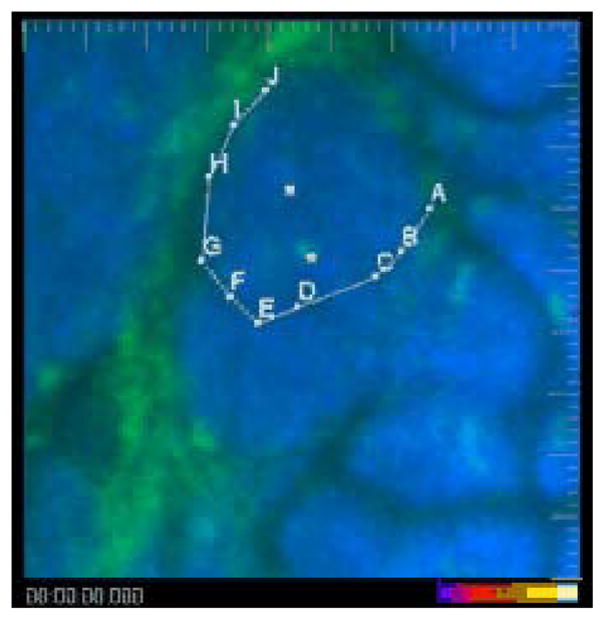
Myeloid cells extravasate and infiltrate late carcinoma lesions. Two myeloid cells (green, marked with white cubes) that already have infiltrated the cancer cell masses (blue) are largely immotile, while a third cell extravasates from a blood vessel in the right side of the field and infiltrates the tumor (following points A–J). Shown are the ECFP (blue) and EGFP (green) channels in an MMTV-PyMT;ACTB-ECFP;c-fms-EGFP mouse. The video is shown first with and then without marking. Large tick marks are 20 μm apart. Exposure time was 33 msec for ECFP and 67 msec for EGFP. Playback time is 600× real time, representing a 50-min-long image sequence with 42 sec between frames. (To view movie, see doi: 10.1101/pdb.top97 online at www.cshprotocols.org.)
MOVIE 2.
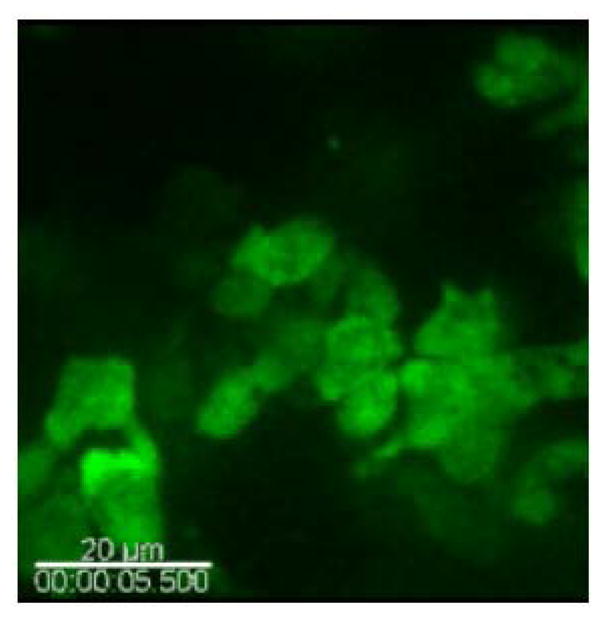
Myeloid cells migrate in response to wounding on the surface of a normal mammary gland. Myeloid cells (green) are seen migrating in the mammary adipogenic stroma in a c-fms-EGFP mouse. Shown is the EGFP (green) channel. Scale bar, 20 μm. Exposure time was 133 msec for EGFP. Playback is 50× real time, representing an 8-min-long image sequence with 5 sec between frames. (To view movie, see doi: 10.1101/pdb.top97 online at www.cshprotocols.org.)
Acknowledgments
We thank Dr. Bryan Welm for his ideas and work on preliminary studies related to this project and Dr. David Lum for suggestions for fluorescent labeling of fat cells. This work was supported by the National Institutes of Health grants CA057621, CA105379, and ES012801 to Z.W.
References
- Ahmed F, Wyckoff J, Lin EY, Wang W, Wang Y, Hennighausen L, Miyazaki J, Jones J, Pollard JW, Condeelis JS, et al. GFP expression in the mammary gland for imaging of mammary tumor cells in transgenic mice. Cancer Res. 2002;62:7166–7169. [PubMed] [Google Scholar]
- Bhowmick NA, Moses HL. Tumor-stroma interactions. Curr Opin Genet Dev. 2005;15:97–101. doi: 10.1016/j.gde.2004.12.003. [DOI] [PMC free article] [PubMed] [Google Scholar]
- Bissell MJ, Radisky D. Putting tumours in context. Nat Rev Cancer. 2001;1:46–54. doi: 10.1038/35094059. [DOI] [PMC free article] [PubMed] [Google Scholar]
- Brown EB, Campbell RB, Tsuzuki Y, Xu L, Carmeliet P, Fukumura D, Jain RK. In vivo measurement of gene expression, angiogenesis and physiological function in tumors using multiphoton laser scanning microscopy. Nat Med. 2001;7:864–868. doi: 10.1038/89997. [DOI] [PubMed] [Google Scholar]
- Brown E, McKee T, diTomaso E, Pluen A, Seed B, Boucher Y, Jain RK. Dynamic imaging of collagen and its modulation in tumors in vivo using second-harmonic generation. Nat Med. 2003;9:796–800. doi: 10.1038/nm879. [DOI] [PubMed] [Google Scholar]
- de Visser KE, Eichten A, Coussens LM. Paradoxical roles of the immune system during cancer development. Nat Rev Cancer. 2006;6:24–37. doi: 10.1038/nrc1782. [DOI] [PubMed] [Google Scholar]
- Dreher MR, Liu W, Michelich CR, Dewhirst MW, Yuan F, Chilkoti A. Tumor vascular permeability, accumulation, and penetration of macromolecular drug carriers. J Natl Cancer Inst. 2006;98:335–344. doi: 10.1093/jnci/djj070. [DOI] [PubMed] [Google Scholar]
- Egeblad M, Ewald AJ, Askautrud HA, Truitt ML, Welm BE, Bainbridge E, Peeters G, Krummel MF, Werb Z. Visualizing stromal cell dynamics in different tumor microenvironments by spinning disk confocal microscopy. Dis Model Mech. 2008;1:155–167. doi: 10.1242/dmm.000596. [DOI] [PMC free article] [PubMed] [Google Scholar]
- Egeblad M, Nakasone ES, Werb Z. Tumors as organs: complex tissues that interface with the entire organism. Dev Cell. 2010;18:884–901. doi: 10.1016/j.devcel.2010.05.012. [DOI] [PMC free article] [PubMed] [Google Scholar]
- Ewald AJ, Werb Z, Egeblad M. Preparation of mice for long-term intravital imaging of the mammary gland. Cold Spring Harb Protoc. 2011a doi: 10.1101/pdb.prot5562. [DOI] [PMC free article] [PubMed] [Google Scholar]
- Ewald AJ, Werb Z, Egeblad M. Monitoring of vital signs for long-term survival of mice under anesthesia. Cold Spring Harb Protoc. 2011b doi: 10.1101/pdb.prot5563. [DOI] [PMC free article] [PubMed] [Google Scholar]
- Fontenot JD, Rasmussen JP, Williams LM, Dooley JL, Farr AG, Rudensky AY. Regulatory T cell lineage specification by the forkhead transcription factor foxp3. Immunity. 2005;22:329–341. doi: 10.1016/j.immuni.2005.01.016. [DOI] [PubMed] [Google Scholar]
- Guy CT, Cardiff RD, Muller WJ. Induction of mammary tumors by expression of polyomavirus middle T oncogene: A transgenic mouse model for metastatic disease. Mol Cell Biol. 1992;12:954–961. doi: 10.1128/mcb.12.3.954. [DOI] [PMC free article] [PubMed] [Google Scholar]
- Halin C, Rodrigo Mora J, Sumen C, von Andrian UH. In vivo imaging of lymphocyte trafficking. Annu Rev Cell Dev Biol. 2005;21:581–603. doi: 10.1146/annurev.cellbio.21.122303.133159. [DOI] [PubMed] [Google Scholar]
- Herschkowitz JI, Simin K, Weigman VJ, Mikaelian I, Usary J, Hu Z, Rasmussen KE, Jones LP, Assefnia S, Chandrasekharan S, et al. Identification of conserved gene expression features between murine mammary carcinoma models and human breast tumors. Genome Biol. 2007;8:R76. doi: 10.1186/gb-2007-8-5-r76. [DOI] [PMC free article] [PubMed] [Google Scholar]
- Kedrin D, Gligorijevic B, Wyckoff J, Verkhusha VV, Condeelis J, Segall JE, van Rheenen J. Intravital imaging of metastatic behavior through a mammary imaging window. Nat Methods. 2008;5:1019–1021. doi: 10.1038/nmeth.1269. [DOI] [PMC free article] [PubMed] [Google Scholar]
- Kouros-Mehr H, Bechis SK, Slorach EM, Littlepage LE, Egeblad M, Ewald AJ, Pai SY, Ho IC, Werb Z. GATA-3 links tumor differentiation and dissemination in a luminal breast cancer model. Cancer Cell. 2008;13:141–152. doi: 10.1016/j.ccr.2008.01.011. [DOI] [PMC free article] [PubMed] [Google Scholar]
- Lehr HA, Leunig M, Menger MD, Nolte D, Messmer K. Dorsal skinfold chamber technique for intravital microscopy in nude mice. Am J Pathol. 1993;143:1055–1062. [PMC free article] [PubMed] [Google Scholar]
- Lin EY, Jones JG, Li P, Zhu L, Whitney KD, Muller WJ, Pollard JW. Progression to malignancy in the polyoma middle T oncoprotein mouse breast cancer model provides a reliable model for human diseases. Am J Pathol. 2003;163:2113–2126. doi: 10.1016/S0002-9440(10)63568-7. [DOI] [PMC free article] [PubMed] [Google Scholar]
- Littlepage LE, Egeblad M, Werb Z. Coevolution of cancer and stromal cellular responses. Cancer Cell. 2005;7:499–500. doi: 10.1016/j.ccr.2005.05.019. [DOI] [PubMed] [Google Scholar]
- Mempel TR, Scimone ML, Mora JR, von Andrian UH. In vivo imaging of leukocyte trafficking in blood vessels and tissues. Curr Opin Immunol. 2004;16:406–417. doi: 10.1016/j.coi.2004.05.018. [DOI] [PubMed] [Google Scholar]
- Nakano A. Spinning-disk confocal microscopy—A cutting-edge tool for imaging of membrane traffic. Cell Struct Funct. 2002;27:349–355. doi: 10.1247/csf.27.349. [DOI] [PubMed] [Google Scholar]
- Pluen A, Boucher Y, Ramanujan S, McKee TD, Gohongi T, di Tomaso E, Brown EB, Izumi Y, Campbell RB, Berk DA, et al. Role of tumor-host interactions in interstitial diffusion of macromolecules: Cranial vs. subcutaneous tumors. Proc Natl Acad Sci. 2001;98:4628–4633. doi: 10.1073/pnas.081626898. [DOI] [PMC free article] [PubMed] [Google Scholar]
- Proia DA, Kuperwasser C. Stroma: Tumor agonist or antagonist. Cell Cycle. 2005;4:1022–1025. doi: 10.4161/cc.4.8.1903. [DOI] [PubMed] [Google Scholar]
- Ross PJ, Perez GI, Ko T, Yoo MS, Cibelli JB. Full developmental potential of mammalian preimplantation embryos is maintained after imaging using a spinning-disk confocal microscope. BioTechniques. 2006;41:741–750. doi: 10.2144/000112310. [DOI] [PubMed] [Google Scholar]
- Sasmono RT, Oceandy D, Pollard JW, Tong W, Pavli P, Wainwright BJ, Ostrowski MC, Himes SR, Hume DA. A macrophage colony-stimulating factor receptor-green fluorescent protein transgene is expressed throughout the mononuclear phagocyte system of the mouse. Blood. 2003;101:1155–1163. doi: 10.1182/blood-2002-02-0569. [DOI] [PubMed] [Google Scholar]
- Shan S, Sorg B, Dewhirst MW. A novel rodent mammary window of orthotopic breast cancer for intravital microscopy. Microvasc Res. 2003;65:109–117. doi: 10.1016/s0026-2862(02)00017-1. [DOI] [PubMed] [Google Scholar]
- Sidani M, Wyckoff J, Xue C, Segall JE, Condeelis J. Probing the microenvironment of mammary tumors using multiphoton microscopy. J Mammary Gland Biol Neoplasia. 2006;11:151–163. doi: 10.1007/s10911-006-9021-5. [DOI] [PubMed] [Google Scholar]
- Stroh M, Zimmer JP, Duda DG, Levchenko TS, Cohen KS, Brown EB, Scadden DT, Torchilin VP, Bawendi MG, Fukumura D, et al. Quantum dots spectrally distinguish multiple species within the tumor milieu in vivo. Nat Med. 2005;11:678–682. doi: 10.1038/nm1247. [DOI] [PMC free article] [PubMed] [Google Scholar]
- Sumen C, Mempel TR, Mazo IB, von Andrian UH. Intravital microscopy: Visualizing immunity in context. Immunity. 2004;21:315–329. doi: 10.1016/j.immuni.2004.08.006. [DOI] [PubMed] [Google Scholar]
- Wyckoff JB, Pinner SE, Gschmeissner S, Condeelis JS, Sahai E. ROCK- and myosin-dependent matrix deformation enables protease-independent tumor-cell invasion in vivo. Curr Biol. 2006;16:1515–1523. doi: 10.1016/j.cub.2006.05.065. [DOI] [PubMed] [Google Scholar]


