

Abstract
Understanding the mechanisms underlying oro-gustatory detection of dietary fat is critical for the prevention and treatment of obesity. The lipid-binding glycoprotein CD36, which is expressed by circumvallate papillae (CVP) of the mouse tongue, has been implicated in oro-gustatory perception of dietary lipids. Here, we demonstrate that stromal interaction molecule 1 (STIM1), a sensor of Ca2+ depletion in the endoplasmic reticulum, mediates fatty acid–induced Ca2+ signaling in the mouse tongue and fat preference. We showed that linoleic acid (LA) induced the production of arachidonic acid (AA) and lysophosphatidylcholine (Lyso-PC) by activating multiple phospholipase A2 isoforms via CD36. This activation triggered Ca2+ influx in CD36-positive taste bud cells (TBCs) purified from mouse CVP. LA also induced the production of Ca2+ influx factor (CIF). STIM1 was found to regulate LA-induced CIF production and the opening of multiple store-operated Ca2+ (SOC) channels. Furthermore, CD36-positive TBCs from Stim1–/– mice failed to release serotonin, and Stim1–/– mice lost the spontaneous preference for fat that was observed in wild-type animals. Our results suggest that fatty acid–induced Ca2+ signaling, regulated by STIM1 via CD36, might be implicated in oro-gustatory perception of dietary lipids and the spontaneous preference for fat.
Introduction
The sense of taste informs the organism about the quality of ingested food. Five basic taste modalities, e.g., sweet, sour, bitter, salty, and umami, have so far been identified (1). Recent compelling evidence from rodents raises the possibility of an additional sixth taste modality devoted to the perception of lipids (2–4) that are released by the action of lingual lipases, present in the salivary secretions (5). Fukuwatari et al. (6) and Laugerette et al. (2) have documented the expression of the receptor-like lipid-binding protein CD36 in rat and mouse circumvallate papillae (CVP), respectively. Laugerette et al. (2) have provided the first evidence for the involvement of lingual CD36 in dietary lipid perception in the mouse. Indeed, Cd36 gene inactivation completely abolished the spontaneous preference for long-chain fatty acids (LCFAs) observed in wild-type mice. This effect is lipid specific, since the preference for sweet and aversion to bitterness reported in controls were not altered in Cd36-null mice. These observations regarding the implication of CD36 in the perception of lipid taste have also been confirmed by other investigators (7).
The coupling of CD36 cell signaling to a downstream second messenger cascade has been explored in mouse taste bud cells (TBCs) (3, 8). The experiments conducted on CD36-positive TBCs purified from mouse CVP demonstrated that linoleic acid (LA), an LCFA, induced increases in free intracellular calcium concentrations, [Ca2+]i by binding to CD36 (3). We have reported that LCFAs induced the production of inositol-1,4,5-trisphosphate (IP3) and, consequently, recruited Ca2+ from the endoplasmic reticulum, followed by Ca2+ influx via opening of Ca2+ channels in these cells (8). The binding of LCFAs to CD36-positive TBCs also induced phosphorylation of Src protein tyrosine kinases (Src-PTK), particularly of Fyn59 and Yes62. In CD36-positive TBCs, LCFA-mediated increases in [Ca2+]i induced exocytosis of serotonin (5-HT) and norepinephrine into the extracellular medium. However, the mechanisms of action of the LCFAs on the opening of Ca2+ channels remained unexplored (4, 9).
It is possible that activation of CD36-positive TBCs might be associated with the release of lipid messengers such as arachidonic acid (AA) that would participate in downstream signaling mechanisms. It has been shown that AA modulates activation of K+ channels in isolated TBCs (10) and affects the gustatory nerve responses to taste stimuli (11). AA is known to be principally released from the sn-2 position of plasma membrane phospholipids by the activation of phospholipase A2 (PLA2). On the basis of structural and functional properties, these enzymes have been divided into three families: secretory PLA2 (sPLA2: Ib, IIa–f, III, V, X, XII), cytosolic PLA2 (cPLA2: IVa–d), and Ca2+-independent PLA2 (iPLA2: VIa, VIβ) (12, 13). By employing in situ hybridization techniques, Oike et al. (14) have shown that group IIa sPLA2 is expressed in rat TBCs, which possess exocytotic machinery for the release of neurotransmitters. These investigators further showed that sPLA2 IIa was coexpressed with transient receptor potential melastatin–5 (TRPM5) channels in these cells (14). It is also noteworthy that gustatory nerve responses are influenced by a PLA2 inhibitor or by the addition of AA (11). Chorda tympani nerve responses to taste stimuli are modulated by the application of a PLA2 inhibitor to the surface of the gerbil tongue (11). Therefore, some PLA2 species probably function during the process of intramolecular taste signaling that is followed by the gustatory nerve response. However, there is a paucity of information on the identification and characterization of different isoforms of PLA2s in the mouse lingual TBC. Keeping in view the above-mentioned data, it was thought worthwhile to undertake the present study to characterize different isoforms of PLA2s, to demonstrate the implication of their products such as free AA and lysophospholipids in Ca2+ signaling in CVP CD36-positive TBCs, and to explore the related consequence on the oro-sensory detection of dietary lipids in the mouse.
Results
LA induces increases in [Ca2+]i and activates different PLA2 isoforms.
Unless mentioned otherwise, all of the experiments in the present study were conducted on CD36-positive TBCs. To study the transient increase in [Ca2+]i, we used a Ca2+ imaging technique. We observed that LA induced a rapid rise in [Ca2+]i in CD36-positive TBCs (Figure 1A). Thapsigargin (TG), which blocks sarcoplasmic-endoplasmic Ca2+-ATPase (SERCA), also evoked a rapid increase in [Ca2+]i (Figure 1A). The LA-induced increases in [Ca2+]i were greater in Ca2+ buffer than that in Ca2+-free buffer (1,200 ± 50 nM in Ca2+-containing buffer vs. 300 ± 20 nM in 0% Ca2+-free buffer, P < 0.001, n = 8).
Figure 1. Ca2+ signaling and expression of PLA2 in CD36-positive TBCs.

The CD36-positive TBCs and CD36-negative cells were isolated from CVP of C57BL/6J mice as described in Methods. (A) Ca2+ imaging studies were performed on CD36-positive TBCs in Ca2+-free medium. The changes in intracellular Ca2+ (F340/F380) were monitored under the Nikon microscope (TiU) by using S Fluor 40× oil immersion objectives as described in Methods. The arrows indicate when the test molecules (LA at 20 μM; TG at 5 μM) were added into the cuvette without interruptions in the recording. (B) Total RNA isolated from CD36-positive TBCs and CD36-negative cells was analyzed with semiquantitative RT-PCR. PCR products were visualized by UV transillumination after loading into agarose gel. The lanes were run on the same gel but were noncontiguous. (C) Relative expression of PLA2 mRNA in CD36-positive TBCs versus CD36-negative cells was assessed (n = 6). *P < 0.001 compared with CD36-negative cells. (D) PLA2 isoforms were also detected in CD36-positive TBCs by confocal microscopy (original magnification, ×10).
Since free fatty acids might be implicated in Ca2+ signaling, the role of PLA2 was explored. We noticed that the isolated CD36-positive and -negative cells expressed mRNA encoding three PLA2 families, i.e., sPLA2, cPLA2, and iPLA2 (Figure 1B). However, the CD36-positive TBCs preferentially expressed mRNA for sPLA2 IIa, sPLA2 V, cPLA2 IVc, and iPLA2 VIβ as compared with CD36-negative TBCs (Figure 1C). Figure 1D shows the expression of sPLA2, cPLA2, and iPLA2 at the protein level in CD36-positive TBCs. The three isoforms seem to be distributed in the cytoplasm of resting TBCs.
LA induced the activity of the three families of PLA2 in CD36-positive TBCs (Figure 2A). In order to determine whether LA evokes enzyme activity via binding to CD36, we employed sulfo-N-succinimidyl-oleate (SSO). SSO is known to bind specifically to CD36 (15) and, thereby, blocks the binding of the fatty acids. We observed that SSO significantly diminished the enzymatic activity of the three families of PLA2 (Figure 2A). LA failed to induce the activation of the three families of PLA2 in CD36-negative TBCs, and, similarly, SSO induced no actions in these cells (Figure 2A). LA failed to induce any enzyme activity of sPLA2 and cPLA2 in Ca2+-free medium (Figure 2B). Interestingly, LA-induced enzyme activity of iPLA2 was increased several fold in Ca2+-free medium (Figure 2B).
Figure 2. PLA2 activity in CD36-positive TBCs.

(A and B) The CD36-positive TBCs (3 × 10⁶) were treated as described in Methods. The cells were incubated with or without SSO (50 μM) for 20 minutes and then treated with LA. For analysis of Ca2+ dependence of PLA2, the Ca2+-containing medium contained CaCl2 (1.2 mM), whereas Ca2+-free medium contained EGTA (2 mM) in place of CaCl2. PLA2 enzyme activity was calculated as described in the kit protocol. *P < 0.001 compared with unstimulated cells (basal); §P < 0.001 compared with LA-treated cells. (C) The TBCs (2 × 10⁶) were labeled for 2 hours with 1.5 μCi 3H-AA and treated or not with PMA (10 nM) plus ionomycin (Iono, 200 nM), TG (5 μM), or LA (20 μM). After washing, the release of 3H-AA was assessed. (D) Effect of PLA2 inhibitors (15 μM BEL, ATK, BPB, and Ar-A for 10 minutes) on LA- and TG-induced release of 3H-AA in TBCs. Data (mean ± SEM) are expressed as percentage of unstimulated cells; *P < 0.001 compared with respective controls. (E) Western blot detection of 4 isoforms of PLA2 in TBCs after transfection with siRNA (sPLA2 IIa, cPLA2 IVc, sPLA2 V, and iPLA2 VIβ). NsiRNA, nontargeting siRNA. Lanes were run on the same gel but were noncontiguous, as indicated by the white line (F) Release of 3H-AA after tranfection of TBCs with the siRNA isoforms mentioned in E. Experiments were performed as in D. Data (mean ± SEM) are expressed as percentage of LA- or TG-stimulated cells; *P < 0.001 compared with respective controls.
Since AA is the main fatty acid present on the sn-2 position of plasma membrane phospholipids, CD36-positive TBCs were loaded with 3H-AA. The incorporation of 3H-AA into phospholipids of CD36-positive TBCs was as follows (dpm ± SEM/2 × 106 cells): phosphatidylcholine (PC; 2,938 ± 146), phosphatidylethanolamine (PE; 1,700 ± 85), phosphatidylinositol/phosphatidylserine (PI/PS; 400 ± 20), and neutral lipids (200 ± 10). LA induced the release of 3H-AA into the extracellular medium (Figure 2C). The LA-mediated effect was dependent on CD36, since SSO significantly curtailed the release of 3H-AA (Table 1). Moreover, LA-induced release of 3H-AA was not influenced by indomethacin (Indo), an inhibitor of the cyclooxygenase pathway; nordihydroguaiaretic acid (NDGA), an inhibitor of the lipoxygenase pathway; or 1-aminobenzotriazole (1-ABT), a cytochrome P450 epoxygenases (CYP450) inhibitor (Table 1). PMA in combination with ionomycin (Iono) and TG, agents known to induce an increase in [Ca2+]i also evoked the release of 3H-AA (Figure 2C). Interestingly, LA and TG induced the release of 3H-AA to the same order of magnitude in CD36-positive TBCs (Figure 2C).
Table 1 .
Effect of different inhibitors on LA-induced release of 3H-AA in CD36-positive TBCs
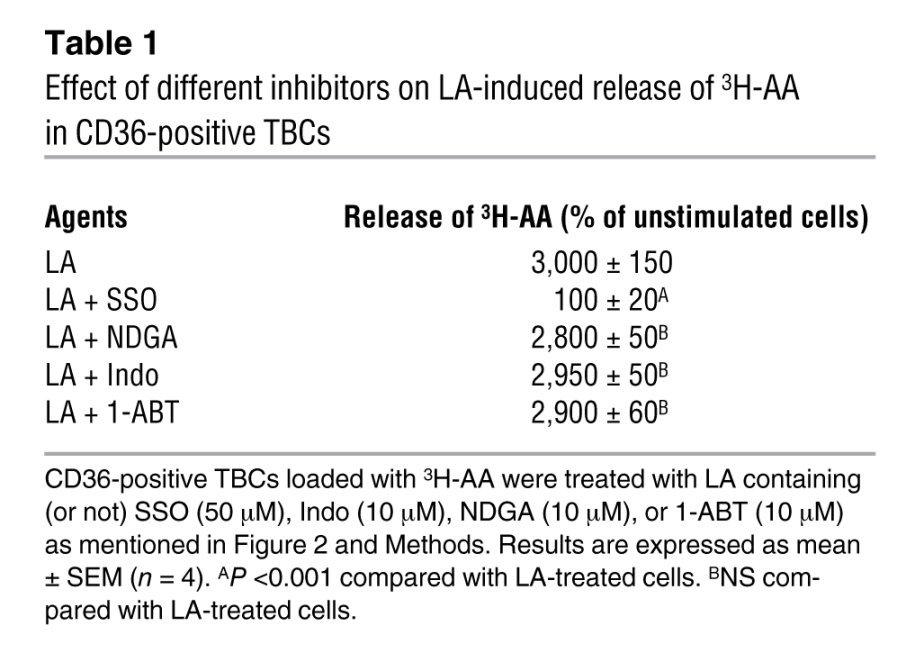
In order to shed light on the roles of different PLA2s, we used chemical inhibitors. Aristolochic acid (Ar-A) and 4-bromophenacyl bromide (BPB) inhibit sPLA2 (Ib/V), and arachidonyl trifluoromethyl ketone (ATK) and bromoenol lactone (BEL) are the respective inhibitors of cPLA2 IV and iPLA2 VI (12). Interestingly, all of the PLA2 inhibitors inhibited the TG- and LA-induced release of 3H-AA into the extracellular medium (Figure 2D).
The chemical inhibitors of PLA2 are not very specific as far as their inhibitory actions are concerned. Hence, we employed siRNA technology in order to silence specifically the expression of 4 isoforms of PLA2, i.e., IIa, IVc, V, and VIβ, which are highly expressed in CD36-positive TBCs. The transfection of these cells with the siRNA diminished the expression of corresponding isoforms of PLA2 (Figure 2E) and the release of 3H-AA into the extracellular medium (Figure 2F).
PLA2-cleaved AA facilitates Ca2+ influx.
Since TG selectively depletes the intracellular Ca2+ store, we used this compound for further studies on Ca2+ signaling. In the Ca2+-free/Ca2+ reintroduction (CFCR) protocol, addition of AA and then CaCl2 to Ca2+-free medium potentiated the TG-induced store-operated Ca2+ (SOC) influx in a dose-dependent manner (Figure 3A). The action of AA on Ca2+ entry was not influenced by Indo, 1-ABT (Figure 3A), or NDGA (data not shown). Furthermore, PLA2 inhibitors were employed in order to assess their effects on TG-induced Ca2+ influx. Prior addition of ATK and BEL inhibited the TG-stimulated Ca2+ entry. Interestingly, Ar-A exerted the highest inhibitory effect on TG-induced Ca2+ influx in CD36-positive TBCs (Figure 3B). The order of magnitude of the inhibitory effects of different PLA2 inhibitors on Ca2+ influx in the CFCR measurements was as follows: Ar-A>BEL>ATK (Figure 3B). The transfection of CD36-positive TBCs with siRNA of 4 isoforms of PLA2 (IIa, IVc, V, and VIβ) significantly diminished the TG-induced Ca2+ influx in the CFCR protocol (Figure 3C).
Figure 3. Implication of AA and PLA2 in Ca2+ influx in CD36-positive TBCs.

(A) The CD36-positive TBCs (2 × 10⁶/assay) were loaded with Fura-2/AM, as described in Methods. The experiments were performed in Ca2+-free medium. The arrows indicate when the test molecules, TG (5 μM), AA (0, 10, 20 μM), and CaCl2 (1.5 mM), were added. The histograms show mean ± SEM of 7 independent experiments. *P < 0.001 compared with control (CaCl2). Indo and 1-ABT were used at 10 μM with AA. (B) Effect of different PLA2 inhibitors on Ca2+ influx. The experiments were performed in Ca2+-free medium. The arrows indicate when the test molecules, i.e., PLA2 inhibitors (15 μM), TG (5 μM), or CaCl2 (1.5 mM), were added. “No inhibitor” trace shows the recording in the absence of PLA2 inhibitors. The histograms show the results, obtained from the traces, as mean ± SEM (n = 7). *P < 0.001 compared with control, CaCl2. All of these experiments were performed in a PTI spectrofluorometer. (C) Ca2+ influx after transfection of CD36-positive TBCs by siRNA of different sPLA2 isoforms. Experiments were performed as in B.
Lyso-PC and AA exert additive effects on Ca2+ entry.
In Ca2+-free medium, addition of Lyso-PC did not evoke any increase in [Ca2+]i. When CaCl2 was added into the cuvette, this agonist induced a significant Ca2+ influx in CD36-positive TBCs (Figure 4A). Interestingly, when Lyso-PC was added after AA (Figure 4B) or when AA was added after Lyso-PC (Figure 4C), the effect on Ca2+ entry was additive. PLA2-activating peptide (PLAP) was used in order to enrich the plasma membrane of CD36-positive TBCs with lysophospholipids. We observed that PLAP evoked Ca2+ signaling in these cells. 2-Aminoethoxy-diphenyl-borate (2-APB), an inhibitor of SOC channels, significantly diminished the responses evoked by both Lyso-PC and PLAP (Figure 4D).
Figure 4. Effect of Lyso-PC or PLAP and AA on Ca2+ influx in CD36-positive TBCs.

(A and B) The CD36-positive TBCs (2 × 10⁶) were loaded with the fluorescent probe Fura-2/AM. The experiments were performed in Ca2+-free medium. The arrows indicate when the test molecules, i.e., CaCl2 (1.5 mM), Lyso-PC (5 μM), and AA (10 μM), were added into the cuvette. (A) Effect of Lyso-PC (5 μM) alone. (B) Additive effects of AA (10 μM) and Lyso-PC (5 μM). (C) Histograms (mean ± SEM) of 4 independent experiments. (D) Cell imaging results for Ca2+ influx evoked by Lyso-PC (5 μM) and PLAP (5 μg/ml) in the presence or absence of 2-APB (30 μM). The values are mean ± SEM (n = 7); *P < 0.001 compared with control.
LA induces the production of Ca2+ influx factor, which evokes Ca2+ entry.
The CD36-positive TBCs were treated with LA, and then Ca2+ influx factor (CIF) was extracted. Injection of LA-produced CIF evoked Ca2+ influx in CD36-positive TBCs (Figure 5A). CIF was also purified from TG-treated CD36-positive TBCs (termed TG-CIF). We observed that injection of TG-CIF was also potent to induce Ca2+ entry in these cells (Figure 5A). Control CIF (extracted from control unstimulated cells) exerted no effect on Ca2+ influx in CD36-positive TBCs (Figure 5B). Interestingly, addition of AA after CIF had an additive effect on the increases in [Ca2+]i (Figure 5B). However, addition of CIF or Lyso-PC one after the other did not induce an additive response in terms of Ca2+ influx in CD36-positive cells (Figure 5, B and C).
Figure 5. Effect of CIF, AA, and Lyso-PC on Ca2+ influx in CD36-positive TBCs.

(A) Effect of CIF on Ca2+ influx. The experiments were performed in Ca2+-free medium. CIF was purified from LA-treated (CIF) or TG-treated (TG-CIF) CD36-positive TBCs. The arrows indicate when the test molecules, i.e., CaCl2 (1.5 mM) and CIF (50 μl) or CIF-TG (50 μl), were added. (B and C) Histograms of the effects of C-CIF (extracted from control untreated cells), CIF, AA, and Lyso-PC. (D) Activation of La3+-sensitive current by CIF in Jurkat T cells. Mean La3+-sensitive current density-voltage relationships recorded in the absence (open circles, n = 7) or presence (filled circles, n = 9) of CIF included in the pipette solution (1:15 dilution). The inset shows representative ramp membrane currents recorded in response to voltage ramps, of 50-ms duration applied from –100 to +100 mV in a Jurkat T cell dialyzed with the CIF-containing pipette solution in the absence (a) or presence (b) of 20 μM La3+. The difference curves (a and b, in gray) characterize the La3+-sensitive current.
CIF activates ICRAC in Jurkat T cells.
To test the hypothesis that CIF purified from LA-treated CD36-positive TBCs activates Ca2+-release activated Ca2+ (CRAC) channels, we used experimental procedures known to activate CRAC currents in Jurkat T cells (16). With a low concentration of Ca2+ chelating buffer (0.2 mM BAPTA) and without inositol 1,4,5-triphosphate or SERCA blocker in the pipette solution, we did not record ICRAC (that is, La3+-sensitive current was absent in this condition) in Jurkat T cells (Figure 5D, open circles). However, when CIF purified from LA-treated CD36-positive TBCs was included in the pipette solution (1:15 dilution), we observed an inhibitory effect of La3+ (inset) and could measure La3+-sensitive currents (filled circles). For instance, at –80 mV, the average La3+-sensitive current densities were –0.01 ± 0.11 (n = 7) and –1.27 ± 0.27 pA/pF (n = 9) in the absence and presence of CIF in the pipette solution, respectively.
Orai1 and Orai3 channels are implicated in Ca2+ entry.
RT-PCR showed that CD36-positive TBCs expressed mRNA encoding Orai1 and Orai3 channel proteins (Figure 6A). These cells also expressed mRNA for stromal interaction molecule 1 (STIM1), implicated in sensing of depletion of the ER pool (ref. 17 and Figure 6A). The CD36-positive TBCs also expressed these channel components and STIM1 at the protein level, and the transfection of these cells with siRNA downregulated their expression, as revealed by Western blot analysis (Figure 6B). We checked whether siRNA for either Orai1 or Orai3 could curtail the expression of the other. In Western blot assays, transfection of CD36-positive TBCs by either Orai1 or Orai3 did not alter the expression of the other proteins (Figure 6B). In RT-PCR studies, we also observed no inhibition of expression of Orai1 or Orai3 mRNA in Orai3- or Orai1-transfected TBCs, respectively (Figure 6C).
Figure 6. Expression of STIM1, Orai1, and Orai3 proteins and implication of Orai channels in Ca2+ influx in CD36-positive TBCs.

(A) Expression of mRNA encoding for Stim1, Orai1, and Orai3. RT-qPCR, quantitative RT-PCR. (B) Detection of STIM1, Orai1, or Orai3 proteins by Western blotting after transfection with either scrambled RNA (control) or siRNA of STIM1, Orai1, or Orai3. (C) Expression of Orai1 and Orai3 mRNA in CD36-positive TBCs transfected with Orai1 or Orai3 siRNA. (D) Ca2+ imaging studies were performed on CD36-positive TBCs transfected with either Orai1 siRNA or Orai3 siRNA or with both. The changes in F340/F380 were monitored under a Nikon microscope (TiU) by using S Fluor 40× oil immersion objectives as described in Methods. The histograms show the results obtained from the traces as mean ± SEM (n = 7). (E) Effect of Lyso-PC (5 μM) and AA (10 μM) on the increases in [Ca2+]i in CD36-positive TBCs isolated from wild-type or Orai1–/– mice. The experiments were performed in a PTI spectrofluorometer.
LA-induced increases in [Ca2+]i were diminished in CD36-positive TBCs transfected with Orai1 and Orai3 siRNA. Moreover, the LA-evoked response was further curtailed in cells that were transfected by both Orai1 and Orai3 siRNA (Figure 6D). Similarly, the AA-induced increases were lower in TBCs transfected with Orai1 and Orai3 siRNA than in those transfected only with Orai1 or Orai3 siRNA (Figure 6D). In contrast, the increase in [Ca2+]i in response to Lyso-PC in [Ca2+]i was diminished only in Orai1-transfected cells, and no difference was observed between Orai1-transfected cells and Orai1/3-transfected cells (Figure 6D). We further conducted experiments on CD36-positive TBCs isolated from Orai1–/– mice and observed that the Lyso-PC–induced increases in [Ca2+]i were completely blocked in these cells, but the AA-induced increases in [Ca2+]i were only partially diminished (Figure 6E).
CIF modulates iPLA2 activity.
We wanted to assess the mechanism of action of CIF in the activation of Ca2+ influx in CD36-positive TBCs. Smani et al. (18) have demonstrated that CIF activates iPLA2 activity. We observed that CIF produced by LA did not influence sPLA2 or cPLA2 enzyme activity; rather, it significantly increased only iPLA2 activity in these cells (Figure 7A). The calmodulin (CaM) antagonist calmidazolium (CMZ) is known to specifically bind to CaM and, therefore, dissociates iPLA2, allowing an optimal activation of this enzyme (18). CMZ and also BAPTA/AM (known to chelate intracellular Ca2+) increased iPLA2 activity in CD36-positive TBCs (Figure 7B).
Figure 7. Effect of CIF, CMZ, or BAPTA on PLA2 activity in CD36-positive TBCs.

(A) The CD36-positive TBCs (3 × 10⁶) were treated as described in the furnished cell lysate protocol. CIF extracts were purified as described in Methods and were used at 50 μl. (B) Cells were preincubated for 15 minutes in the presence or absence of the following agents: CMZ (3 μM) and BAPTA/AM (10 μM). The histograms show the results as mean ± SEM (n = 7); *P < 0.001 compared with basal values.
STIM1 is necessary for Ca2+ signaling.
STIM1, a Ca2+ sensor, plays a crucial role in the regulation of Ca2+ signaling during ER store depletion (17). To explore the putative involvement of STIM1 in LA-induced Ca2+ signaling, we conducted experiments on CD36-positive and -negative TBCs isolated from wild-type and Stim1–/– mice. Both LA- and TG-induced transient increases in Ca2+ signaling were significantly diminished in Stim1–/– CD36-positive TBCs (Figure 8A). LA, but not TG, failed to induce any increases in [Ca2+]i in CD36-negative TBCs (Figure 8A).
Figure 8. Effect of STIM1 deficiency on Ca2+ signaling.

Ca2+ imaging studies were performed on CD36-positive TBCs isolated from wild-type or Stim1–/– mice. The changes in F340/F380 were monitored under a Nikon microscope (TiU) by using S Fluor 40× oil immersion objectives as described in Methods. (A) Effects of LA (20 μM) and TG (5 μM) in CD36-positive or CD36-negative TBCs. (B) Effect of CIF extracted from LA-stimulated TBCs isolated from wild-type or Stim1–/– mice (CIF/ Stim1–/–) on Ca2+ signaling. (C and D) Effects of AA (10 μM) and Lyso-PC (5 μM) on increases in [Ca2+]i. The data in A–D represent mean ± SEM (n = 7). *P < 0.001 compared with TBCs isolated from wild-type mice. (E) Expression of mRNA encoding CD36 and different isoforms of PLA2 in WT and Stim1–/– CD36-positive TBCs. Data represent mean ± SEM (n = 6). In A and C, the colored time-lapse changes in the increases in [Ca2+]i were recorded in wild-type CD36-positive cells.
It is noteworthy that CIF extracted from LA-stimulated Stim1–/– CD36-positive TBCs (termed CIF from Stim1–/–) failed to induce any increase in [Ca2+]i in these cells (Figure 8B). As expected, increases in [Ca2+]i induced by AA (Figure 8C) and Lyso-PC (Figure 8D) were significantly lower in CD36-positive TBCs from Stim1–/– mice than those from wild-type mice. In order to assess whether the TBCs from Stim1–/– mice exhibit altered expression of CD36 and different isoforms of PLA2, we conducted RT-PCR studies. Figure 8E shows that the expression of mRNA encoding CD36 or 4 isoforms of PLA2 (IIa, IVc, V, and VIβ) was not significantly altered in CD36-positive TBCs between wild-type and Stim1–/– mice (Figure 8E).
Spontaneous gustatory preference for fat is abolished in Stim1–/– mice.
Based on these findings, it was tempting to speculate that STIM1 might play a key role in the oro-sensory perception of lipids. To explore this hypothesis, we subjected wild-type and Stim1–/– mice to two-bottle preference tests. As expected, wild-type mice exhibited a strong preference for a 0.1% colza oil–enriched solution as compared with a control solution containing 0.3% xanthan gum, used to emulsify the fatty acid and mimic lipid texture (Figure 9A). In contrast, this spontaneous preference for fat was significantly diminished in Stim1–/– mice (Figure 9A).
Figure 9. Effect of Stim1 gene invalidation and splenomegaly on gustatory preference for lipids.

(A) Wild-type and Stim1–/– mice were subjected to a 12-hour two-bottle preference test. Xanthan gum (0.3%) was used to emulsify colza oil (0.1%) in water and to mimic the lipid texture. *P < 0.001 compared with control solution in WT animals; §P < 0.001 between oil-fed WT and oil-fed Stim1–/– mice. (B) Splenomegaly was induced by i.p. administration of CdCl2 as described in Methods, and mice were subjected to a 12-hour two-bottle preference test. *P < 0.001 compared with control solution in vehicle-administrated animals. Data represent mean ± SEM (n = 6). (C) Release of 3H-5-HT into the extracellular environment in the presence of LA with or without SSO from CD36-positive TBCs isolated from wild-type or Stim1–/– mice. *P < 0.001 compared with control in CD36-positive TBCs isolated from WT animals; §P < 0.001 between LA- and LA plus SSO–treated cells in CD36-positive TBCs isolated from WT animals. Data represent mean ± SEM (n = 7).
It is important to note that the STIM1-deficient mice, despite their shortened life span and growth retardation (19, 20), were lively, actively exploring their cage, and were able to survive independent of their mothers. Only about 2 days before death did they show signs of illness. The only notable differences in STIM1-deficient mice that were monitored daily in our experiments were the smaller size and the previously described lymphoproliferative phenotype, including splenomegaly (21). To exclude that the enlarged spleen size had an impact on taste preference, we induced splenomegaly in wild-type mice by i.p. injection of CdCl2. In these animals, the spleen size per 100 g body weight was increased by approximately 93% compared with controls. We observed no differences in spontaneous preference for fat between mice with induced splenomegaly and control mice (Figure 9B). These results suggest that it is the absence of STIM1, but not splenomegaly, that is involved in the loss of the spontaneous preference for fat. Similarly, no difference was observed in spontaneous preference for fat in mice in which splenomegaly was induced by i.v. administration of 2 doses of G-CSF at 100 μg/kg (data not shown).
5-HT release is abolished in TBCs from Stim1–/– mice.
We have previously shown that LCFA induced the release of neurotransmitters including 5-HT to the extracellular environment in CD36-positive TBCs (8). We loaded the cells with 3H-5-HT and assessed its release. Figure 9C shows that LA evoked the release of 3H-5-HT into extracellular environment and SSO significantly curtailed this phenomenon. Interestingly, no exocytosis of 3H-5-HT in response to LA was observed in TBCs isolated from Stim1–/– mice (Figure 9C).
Discussion
Both CD36-positive and CD36-negative mouse TBCs expressed sPLA2, cPLA2, and iPLA2. However, CD36-positive TBCs abundantly expressed two sPLA2 isoforms (IIa and V) shown to be involved in the release of AA from phospholipids in endothelial cells and macrophages (22). In fact, sPLA2 V has been shown to preferentially hydrolyse PC (23). In our study, exogenous AA was also incorporated principally into PC. These gustatory cells also express cPLA2 IVc, which was found to rapidly release AA in HEK293 cells (24). The CD36-positive TBCs also expressed iPLA2 VIβ, well conserved in human, rat, mouse, hamster, and drosophila (25–27). We report herein that LA induces the activation of three families of PLA2s by binding to CD36 in TBCs, corroborating a recent report demonstrating that CD36 is associated with the activation of cPLA2, and to a lesser extent of iPLA2, in CHO cells (28). Besides, in vascular endothelial cells, laminar flow has been shown to induce both CD36 expression and activation of iPLA2 (29). Furthermore, LA-induced activity of sPLA2 and cPLA2 was increased in the presence of Ca2+ in the extracellular medium, as shown elsewhere (30–32). Suh et al. (33) have also shown that LA induces increases in [Ca2+]i and cPLA2 activation in chicken hepatocytes.
It was intriguing that LA and TG induced the release of 3H-AA to the same extent in CD36-positive TBCs. TG does not seem to act directly via CD36, since SSO failed to curtail its action (data not shown). In fact, Kuda et al. (28) have shown in CHO cells that an initial rise in [Ca2+]i by TG is implicated in the membrane translocation of CD36, which was responsible for PLA2 activation and the release of 3H-AA. Similarly, chemical inhibitors and siRNA of different isoforms of PLA2 significantly inhibited the LA- and TG-induced 3H-AA release in CD36-positive TBCs, as observed in Jurkat T cells, where only chemical inhibitors were used (34). Together, these observations suggest that CD36-positive cells possess the three PLA2 isoforms actively implicated in the catalysis of AA. It is noteworthy that LA did not act via cyclooxygenase, lipoxygenase, or cytochrome P450 epoxygenase pathways on the release of 3H-AA.
Since LA and TG evoked the release of 3H-AA to the same extent, and this release was similarly inhibited by various PLA2 siRNAs, we employed only TG to assess the role of free AA on Ca2+ influx in order to avoid interference of this fatty acid with different second messengers that might be additionally activated. Hence, in the CFCR protocol in the presence of TG, addition of AA and then exogenous Ca2+ exerted dose-dependent effects on the increases in [Ca2+]i in CD36-positive TBCs. Similarly, the inhibition of PLA2 activation by chemical inhibitors and siRNA curtailed the TG-induced Ca2+ influx in CD36-positive TBCs. These observations suggest that AA (exogenous or endogenous) evokes Ca2+ influx in these cells as shown elsewhere (34, 35), and its action on Ca2+ influx is not influenced by its metabolites (36).
We further ascertained the actions of AA and lysophospholipids on Ca2+ signaling in CD36-positive TBCs. Lyso-PC induced Ca2+ influx in these cells. Lyso-PE and Lyso-PI induced weaker Ca2+ influx as compared with Lyso-PC (data not shown); we therefore continued our experiments with Lyso-PC. These results are consistent with the findings of Smani et al. (18) showing that lysophospholipids, including Lyso-PC, induced the opening of Ca2+ channels in mouse smooth muscle cells. Boittin et al. (37) have also demonstrated that Lyso-PC triggered Ca2+ entry via SOC channels in dystrophic fibers. Moreover, addition of AA after Lyso-PC and vice versa induced an additive response on Ca2+ influx, suggesting that the channels opened by these two agents do not overlap.
CIF was first identified in Jurkat T cells as an agent that is released from ER during store depletion and, consequently, favors Ca2+ influx in order to refill the intracellular pools (38–40). CIF extracted from LA-treated CD36-positive TBCs induced Ca2+ influx in these cells and ICRAC in Jurkat T lymphocytes. Similarly, CIF purified from TG-treated CD36-positive TBCs also evoked Ca2+ influx. These observations suggest that CIF produced by CD36-positive TBCs is a universal influx factor (38). Interestingly, Lyso-PC and CIF are probably able to activate the same type of Ca2+ channels in these cells. However, the Ca2+ channels opened by CIF and AA might belong to two different categories.
Henceforth, we wanted to shed light on the nature of the Ca2+ channels that are opened by AA and Lyso-PC. The SOC channels are composed of 4 channel-forming units, encoded by Orai genes, that are molecular constituents of the ICRAC (41, 42). CD36-positive TBCs expressed both mRNA and protein of Orai1 and Orai3 channels. Inhibition of Orai1 expression by siRNA significantly curtailed Lyso-PC–evoked Ca2+ entry. The AA-induced Ca2+ influx was also reduced in these cells. Interestingly, AA-evoked, but not Lyso-PC–evoked, Ca2+ influx was further reduced when both Orai1 and Orai3 proteins were knocked down compared with Orai1 single knockdown. Moreover, the Ca2+ influx evoked by Lyso-PC was completely diminished in CD36-positive TBCs isolated from Orai1–/– mice, though AA-induced Ca2+ influx was significantly curtailed to a greater extent in these cells. Our observations on the opening of Orai1 channels by Lyso-PC are substantiated by the conclusions of Shuttleworth (43), who has shown that homotetrameric assembly of Orai1 form CRAC channels. Similarly, Orai1 and Orai3 proteins have been shown to form a functional AA-opened Ca2+ channel pore by a heteropentameric assembly of three Orai1 subunits and two Orai3 subunits in HEK293 cells (44).
STIM1, a single-transmembrane protein, has been recently identified as a Ca2+ sensor in the ER membrane. Upon Ca2+ depletion, STIM1 has been shown to lose Ca2+ from its EF hand and to be localized into punctate structures of the ER membrane that are in close proximity (10–25 nm) to the plasma membrane, followed by SOC entry (SOCE) activation (45, 46). In our study, CIF production was significantly reduced in LA-stimulated CD36-positive TBCs isolated from Stim1–/– mice. These observations are in agreement with the findings of Csutora et al. (47), who have shown, in rabbit aorta smooth muscle cells, that CIF production is tightly coupled with STIM1, since its overexpression resulted in a high level of production of CIF. Besides, NG115 cells that do not express functional STIM1 have an intrinsic deficiency of CIF production and SOC influx (47). In our study, it is possible that an LA-induced initial rise in [Ca2+]i via IP3 production might be responsible for the activation of STIM1 and, consequently, for CIF production. Combined overexpression of STIM1 and Orai1 was found to produce significant amplification of SOC influx, suggesting that SOCE activation may result from conformational coupling and a direct signal transduction from STIM1 to Orai1 (48). LA, Lyso-PC, and AA failed to induce Ca2+ influx in CD36-positive TBCs isolated from Stim1–/– mice. It has been shown that AA-regulated Ca2+ influx is regulated by STIM1 in HEK293 cells (43).
Since STIM1 is key in orchestrating the regulation of Ca2+ homeostasis (CIF production and opening of Ca2+ channels), we conducted a study on the spontaneous preference of lipid solution in Stim1–/– mice. We found that the attraction for oily solution observed in wild-type mice was completely abolished in Stim1–/– mice. Importantly, this behavioral change was not related to the main phenotype found in Stim1–/– mice, i.e., splenomegaly, since no difference in the intake of oily solution was found between control animals and mice displaying drug-induced splenomegaly. We cannot completely rule out that STIM1 deficiency in other cells besides TBCs may have influenced the preference for fat. However, it is tempting to speculate that the lower attraction for fat observed in Stim1–/– mice might be due to the lack of LA-mediated exocytosis of 5-HT found in CD36-positive TBCs. We have previously shown that LA-induced release of neurotransmitters including 5-HT, in a Ca2+-dependent manner in mouse TBCs, might be involved in the transmission of fatty taste information from tongue to brain (8).
One of the important observations in our study is that the activation of iPLA2 VIβ seems very important in the absence of calcium. Indeed, we have observed that LA-evoked activity of iPLA2 was increased when Ca2+ was chelated by EGTA in the extracellular medium (18). We further show that chelating of intracellular calcium by BAPTA/AM resulted in several-fold increases in the activity of this enzyme in CD36-positive TBCs. Another important aspect of iPLA2 is that it exists in a complexed form with CaM, which keeps it in a catalytically inactive state, and removal of CaM results in its activation. In the absence of CaM, the active site of iPLA2 interacts with the CaM-binding domain, resulting in a catalytically competent enzyme, whereas reversible disruption of this interaction through the binding of CaM abrogates this interaction, resulting in a loss of iPLA2 activity. In our study, we noticed that a CaM inhibitor (CMZ) activated iPLA2 activity in these cells. CIF has been shown to displace inhibitory CaM from iPLA2, resulting in its activation (18).
Consistent with the data reported herein, we propose the following working hypothesis (Figure 10). Activation of CD36-positive TBCs by LA would induce the depletion of the intracellular Ca2+ pool via IP3 production (8) and, consequently, the production of CIF, which will in turn activate iPLA2 VIβ (18). The iPLA2 would then produce free AA and Lyso-PC, and the latter would open Orai1 SOC channels (18, 42). Ca2+ influx via SOC (Orai1) channels would bring about a large increase in [Ca2+]i, which may participate in the activation of sPLA2 and cPLA2, as proposed by Bolotina (42). Besides, Chang and Parekh (49) have shown that, in RBL-1 cells, only Ca2+ entry through SOC channels, following depletion of intracellular stores, induces cPLA2 activation, and Ca2+ release from the intracellular stores was ineffective in activating this enzyme even though there was a robust intracellular Ca2+ signal. These observations suggest that only a large increase in [Ca2+]i, contributed by Ca2+ influx, might participate in the activation of Ca2+-dependent PLA2s (49). The significant decrease in the LA-induced activation of both sPLA2 and cPLA2 in Ca2+-free medium in our study, strongly indicates that Ca2+ influx is implicated in the activation of these two families of enzymes. The massive production of Lyso-PC via the activation of sPLA2 and cPLA2 would again open Orai1 channels, while the generation of AA will activate the AA-activated channels formed by Orai1 and Orai3 proteins (44). This increase in [Ca2+]i might be involved in exocytosis of neurotransmitters such as 5-HT (8).
Figure 10. Schematic representation of LA-induced Ca2+ signaling in CD36-positive TBCs.

LA binds to CD36 and leads to IP3 production (8) and depletes intracellular Ca2+ stores. Upon Ca2+ depletion, STIM1 will lose Ca2+ from its EF hand and be localized into punctate structures of the ER membranes, which are in close proximity to the plasma membrane. STIM1 triggers production of CIF that displaces inhibitory CaM from a plasma membrane–bound Ca2+-independent phospholipase A2 (iPLA2β), which produces Lyso-PC and free AA. The Lyso-PC will activate Orai1-dependent SOC channels that are responsible for SOCE. A massive Ca2+ influx via these channels may activate sPLA2 and cPLA2 and give rise to massive production of Lyso-PC and AA that will open Orai1 and Orai1/3 channels, respectively, and a massive increase in [Ca2+]i might be involved in exocytosis of neurotransmitters such as 5-HT, responsible for gustatory perception of dietary lipids.
Finally, our study shows that the Ca2+ signaling mechanism triggered by LA in CD36-positive TBCs is under the control of STIM1, which is also necessary for oro-perception of dietary lipids. However, further studies are required to explore in-depth the intermediate molecules between STIM1 and CIF production. It is not well understood how Lyso-PC (or its derived products) opens Ca2+ channels in a membrane-delimited manner. The involvement of intermediate steps and additional components responsible for signal transduction from STIM1 in the ER membrane to channel proteins in plasma membrane remains to be explored.
The results presented herein may help understand the basic modalities involved in the oro-gustatory perception of dietary fat and reinforce the emerging concept of the existence of a sixth taste modality devoted to the perception of dietary lipids. Consistent with this hypothesis, it has been recently reported in humans that oral sensitivity to a LCFA (oleic acid) is related to fat intake and body mass index (50) and that CD36 influences oral sensitivity to fat in obese subjects (51). Therefore, a better knowledge of the CD36 signaling cascade activated in gustatory papillae by dietary fat might lead to new nutritional or pharmacological strategies for limiting fat attraction and obesity risk.
Methods
Materials.
C57BL/6J mice were obtained from Janvier Elevage. SSO was a gift from J.F. Glatz (Cardiovascular Research Institute, Maastricht, The Netherlands). The culture medium RPMI 1640 and l-glutamine were purchased from Lonza. Fura-2/AM was procured from Invitrogen. Elastase and dispase were purchased from Serlabo Technologies and Roche Diagnostics, respectively. Anti-PLA2 antibodies and anti-CD36 antibody coupled to phycoerythrin and anti–α-gustducin antibody were procured from Santa Cruz Biotechnology Inc. Anti-Orai1 and anti-Orai3 antibodies were obtained from Interchim. ATK, BEL, and PLA2 enzyme activity kit were bought from Cayman Chemical. Methyl arachidonyl fluorophosphonate was obtained from Calbiochem. 3H-AA (specific activity, 217 Ci/mmol) and 5-hydroxytryptamine creatinine sulfate (serotonin) (5-[1,2-3H(N); specific activity, 25 Ci/mmol) were purchased from Amersham. Anti-PLA2 antibodies were obtained from United States Biological. Sep-Pak Vac C18 cartridges were obtained from Millipore. All other chemicals, including AA (20:4 n-6), LA (18:2 n-6), collagenase type I, trypsin inhibitor, Ar-A, 4-bromo phenacyl bromide (BPB), and anti-STIM1 antibodies, were obtained from Sigma-Aldrich.
Isolation of CD36-positive TBCs from mouse CVP.
CD36-positive cells from mouse lingual CPV were isolated according to previously published procedure (3, 8). Briefly, lingual epithelium was separated from connective tissues by enzymatic dissociation (elastase and dispase mixture, 2 mg/ml each, in Tyrode buffer: 120 mM NaCl; 5 mM KCl; 10 mM HEPES; 1 mM CaCl2; 1 mM MgCl2; 10 mM glucose; 10 mM Na pyruvate, pH 7.4). CD36-positive cells were isolated by incubating lingual epithelium in RPMI 1640 medium containing 2 mM EDTA, 1.2 mg/ml elastase, 0.6 mg/ml collagenase (type I), and 0.6 mg/ml trypsin inhibitor at 37°C for 10 minutes, followed by centrifugation (600 g, 10 minutes). The mixture of different cell populations was incubated with anti-CD36 antibody coupled to phycoerythrin for 2 hours, followed by a wash with PBS, pH 7.4 (600 g, 10 minutes), and resuspended in a solution containing microbeads coupled to anti-phycoerythrin IgG. The CD36-positive TBCs were isolated by passing through the MACS columns of the Miltenyi magnet system. Both the cell populations, after separation, were suspended in fresh RPMI 1640 medium containing 10% fetal calf serum, 200 U/ml penicillin, and 0.2 mg/ml streptomycin, seeded onto a BD BioCoat Poly-D-Lysine–coated dishes, and cultured for 24 hours. At the end of this period, the cells were used for the experiments or stained with trypan blue to assess their viability.
Detection of mRNA by real-time PCR (RT-PCR).
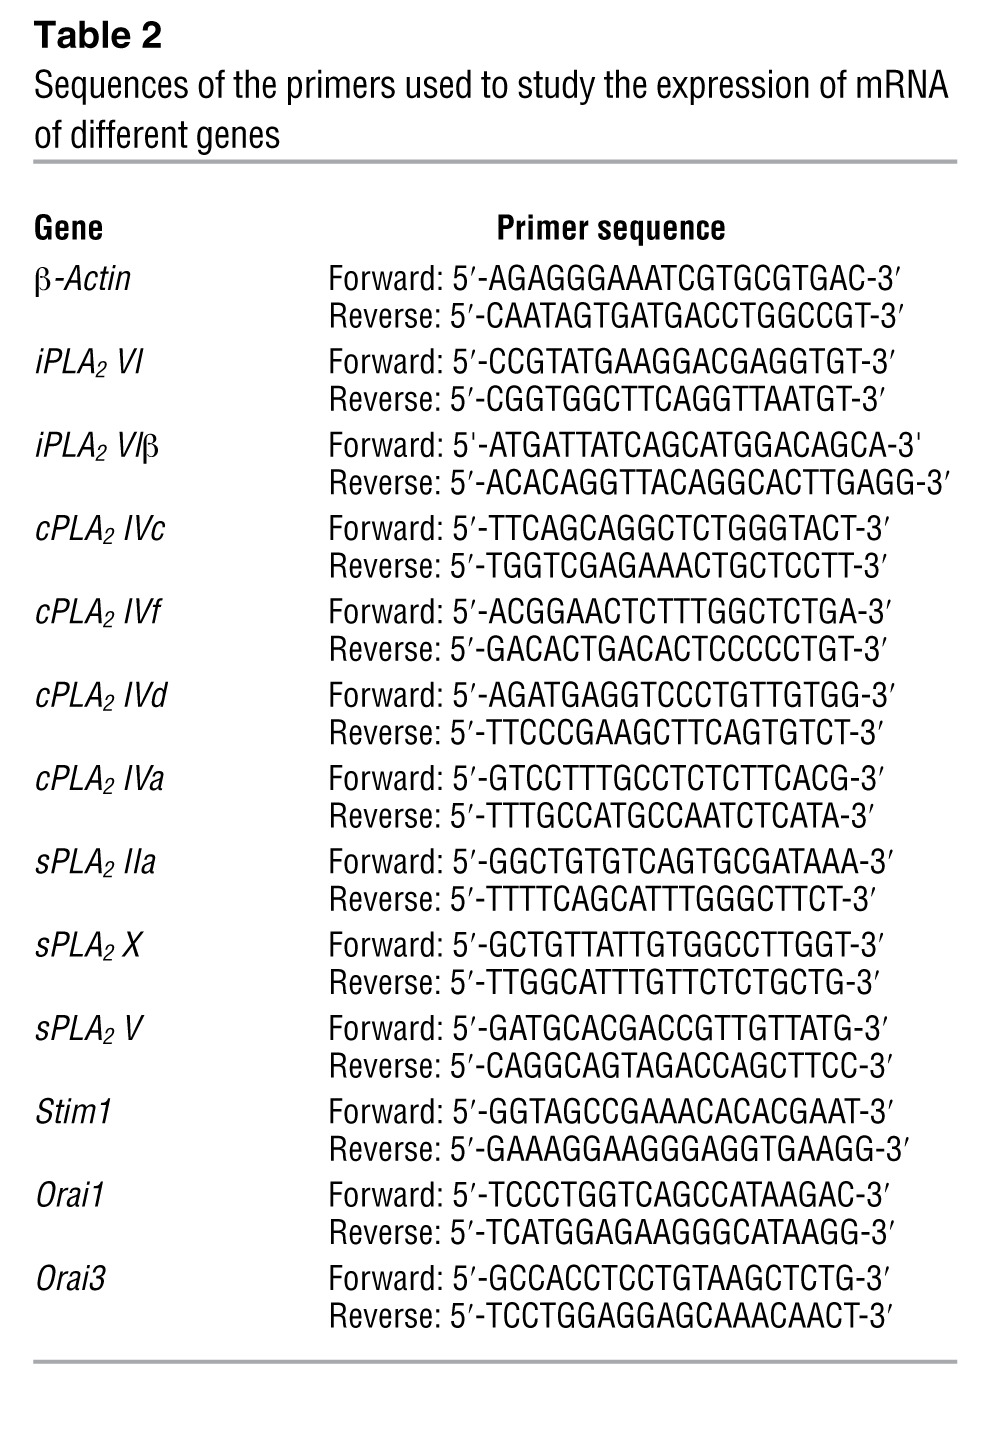
Total RNA was extracted from CD36-negative and/or CD36-positive TBCs by using TRIzol (Invitrogen) and subjected to DNase treatment using the RNAse-free DNAse Set (QIAGEN). One microgram of total RNA was reverse transcribed with SuperScript II RNAse H reverse transcriptase using oligo(dT) according to the manufacturer’s instructions (Invitrogen). RT-PCR was performed on the iCycler iQ real-time detection system, and amplification was undertaken by using SYBR Green I detection. Oligonucleotide primers were based on the sequences of mouse genes in the GenBank database (Table 2). The amplification was carried out in a total volume of 25 μl, which contained 12.5 μl SYBR Green Supermix buffer (50 mM KCl; 20 mM Tris-HCl [pH 8.4]; 3 mM MgCl2; 0.2 mM of each dNTP, 0.63 U iTaq DNA polymerase, and SYBR Green 1.0 nM fluorescein) and 12.5 μl (0.3 μM) of each primer and diluted cDNA.
Table 2 .
Sequences of the primers used to study the expression of mRNA of different genes
Results were evaluated by iCycler iQ software including standard curves, amplification efficiency (E), and cycle threshold (Ct). Relative quantification of mRNA in different groups was determined as follows: ΔΔCt = ΔCt of gene of interest – ΔCt of β-actin; ΔCt = Ct of CD36-positive or CD36-negative cells – Ct of total cells. Relative quantity (RQ) was calculated as follows: RQ = (1 + E)(–ΔΔCt). For semiquantitative determinations, amplification was performed under the same conditions as described above for 30 cycles, followed by a final extension period of 72°C for 10 minutes. Reaction products were electrophoresed on a 1.5% agarose gel impregnated with ethidium bromide. The RNA pattern was visualized by UV transillumination.
Detection of different isoforms of PLA2 by confocal microscopy.
Cytospin-prepared slides containing CD36-positive cells were fixed in 95% ethanol and rehydrated in 0.1 M PBS, pH 7.4. Slides were blocked in PBS containing 5% fetal calf serum and 0.2% Triton X-100 for 30 minutes at room temperature before overnight incubation at 4°C with rabbit anti-cPLA2, donkey anti-sPLA2, and iPLA2 antibodies (1:100 dilution). After washing, slides were incubated for 2 hours at room temperature with secondary antibodies, FITC-conjugated anti-mouse IgG for the expression of sPLA2 and iPLA2, and Alexa Fluor 633–conjugated anti-mouse IgG for cPLA2 detection (1:600 dilutions). Staining specificity was assessed by treating slides in the absence of primary antibodies. After 3 washings with PBS, a drop of Aqua Poly-Mount (Polysciences) mounting medium was added on the slide for the analysis under fluorescence microscope (Zeiss).
Measurement of PLA2 enzyme activity.
The activity of different isoforms of PLA2 was determined as per a protocol furnished with the kit. In brief, the CD36-positive TBCs (3 × 10⁶/assay) were scraped off by a rubber policeman, sonicated in 1 ml cold buffer (50 mM HEPES, 1 mM EDTA, pH 7.4), and centrifuged at 10,000 g for 15 minutes at 4°C. The supernatant was removed and kept on ice. The amount of protein was determined by bicinchoninic acid (Pierce), and the assays were performed the same day. The assays for cPLA2 and sPLA2 were as per protocols; however, to detect the activity of iPLA2, phospholipase activity was assayed by incubating the samples with the substrate arachidonoyl Thio-PC for 1 hour at 20°C in a modified Ca2+-free buffer (300 mM NaCl; 0.5% Triton X-100; 60% glycerol; 4 mM EGTA; 10 mM HEPES at pH 7.4, and 2 mg/ml BSA) as suggested by Smani et al. (18). We also added the inhibitors of sPLA2 (Ar-A and BPB) and cPLA2 (ATK) at 15 μM to block any interference by these enzymes. The reaction was stopped by the addition of DTNB for 5 minutes, and the absorbance was determined at 405 nm using a standard plate reader. The PLA2 activity was expressed in nmol/min/mg protein. The background iPLA2-independent component of basal lipase activity was determined in control samples when all specific iPLA2 activity was inhibited with BEL (15 μM). This background activity was subtracted from all readings.
Measurement of the release of 3H-AA.
The PLA2 activation was also measured by the release of AA (34). In brief, CD36-positive TBCs (2 × 10⁶/assay) were labeled with 3H-AA (1.5 μCi/3 × 108 cells) for 2 hours in RPMI 1640 serum-free medium supplemented with 0.2% fatty acid–free BSA. At the end of the incubation, cells were washed twice with RPMI 1640 serum-free medium containing 0.2% BSA. The cells were resuspended in 500 μl RPMI 1640 medium supplemented with 0.5% BSA at a final concentration of 12 × 106 cells/ml and treated with 15 μM PLA2 inhibitors or vehicle (DMSO, 0.1% v/v) for 10 minutes with or without TG (5 μM) or LA (20 μM). Cells were centrifuged (1,250 g, 3 minutes) and lipids were extracted from both supernatant and pellets and separated by thin layer chromatography (TLC); the zone containing fatty acids and phospholipids was scraped into vials, and radioactivity was measured (28) by counting in a liquid scintillation analyzer (Packard). The released 3H-AA was expressed as percentage of total 3H-AA in cells and normalized to unstimulated cells.
The incorporated radioactivity into phospholipids was also determined. Briefly, phospholipids were extracted by chloroform/methanol/NaCl 2 M (1:1:0.9, v/v), and then phospholipid classes were separated by TLC using silica G60 and the following solvent: chloroform/methanol/acetic acid (35:14:2.7, v/v/v). Phospholipid classes comigrating with authentic standards were scraped off, and radioactivity was quantified by adding 2 ml of scintillation cocktail in a liquid scintillation analyzer (Packard).
Measurement of Ca2+ signaling.
CD36-positive TBCs, cultured for 24 hours, were washed with a buffer containing the following: 3.5 mM KH2PO4; 17.02 mM Na2HPO4; 136 mM NaCl, pH 7.4. The cells were then incubated with Fura-2/AM (1 μM) for 60 minutes at 37°C in loading buffer that contained the following: 110 mM NaCl; 5.4 mM KCl; 25 mM NaHCO3; 0.8 mM MgCl2; 0.4 mM KH2PO4; 20 mM HEPES-Na; 0.33 mM Na2HPO4; 1.2 mM CaCl2, pH 7.4.
After loading, the cells (2 × 10⁶/ml) were washed 3 times (600 g, 10 minutes) and remained suspended in the identical buffer. For experiments in Ca2+-free medium, CaCl2 was replaced by EGTA (2 mM). [Ca2+]i was measured according to Grynkiewicz et al. (52). The fluorescence intensities were measured in the ratio mode in a PTI spectrofluorometer at 340 nm and 380 nm (excitation filters) and 510 nm (emission filter). The cells were continuously stirred throughout the experiment. The test molecules were added into the cuvettes in small volumes with no interruptions in recordings. The intracellular concentrations of free Ca2+ ([Ca2+]i) were calculated by using the following equation: [Ca2+]i = Kd(RRmin)/(RmaxR)(Sf2/Sb2), where Kd is the dissociation constant for Fura-2 /Ca2+ complex; R is the emission ratio with excitation at 340 nm divided by excitation at 380 nm; Rmin is the ratio in the presence of no Ca2+; Rmax is the ratio of saturating [Ca2+]i; and Sf2/Sb2 is the ratio of 380 nm excitation fluorescence at zero and saturating [Ca2+]i. A value of 224 nM for Kd was added into the calculations. Rmax and Rmin values were obtained by addition of ionomycin (5 μM) and MnCl2 (2 mM), respectively.
We designed a CFCR protocol for some experiments, conducted in Ca2+-free medium, and exogenous CaCl2 was added as indicated in the figures.
Ca2+ imaging studies.
The CD36-positive TBCs were cultured on WillCo-dish wells with a glass bottom and loaded with Fura-2/AM as described above. The changes in intracellular Ca2+ (F340/F380) were monitored under a Nikon microscope (TiU) by using an S Fluor 40× oil immersion objective. The planes were taken at z intervals of 0.3 μm, and NIS-Elements software was used to deconvolve the images. The microscope was equipped with an EM-CCD (Lucas) camera for real-time recording of 16-bit digital images. The dual excitation fluorescence imaging system was used for studies of individual cells. The changes in intracellular Ca2+ were expressed as Δratio, which was calculated as the difference relative to the peak F340/F380 ratio. The data were summarized from the large number of individual cells (20–40 cells in a single run, with 3–9 identical experiments done in at least 3 cell preparations).
Electrophysiological studies.
Electrophysiological recordings were carried out at room temperature (20–23°C) in the conventional whole-cell configuration of the patch-clamp technique (53). Membrane capacitance (Cm) was determined as previously described (54). The average values for Cm in Jurkat T cells was 18.4 ± 1.0 pF (n = 28). The series resistance ranged from 1.5 to 8.2 MΩ. Membrane capacitance and series resistance were not compensated. Command voltage and data acquisition were performed with pClamp software (Axon Instruments). Membrane currents were evoked every 3 seconds from a holding potential of 0 mV, by voltage ramps of 50-ms duration, applied from –100 to +100 mV, sampled at 20 kHz, and filtered at 3 kHz. Current traces were not corrected for the leak. The external solution contained (in mM): 145 NaCl; 2.8 KCl; 2 MgCl2; 20 CaCl2; 6 CsCl; 10 glucose; 10 HEPES; adjusted to pH 7.4 with NaOH. The internal (i.e., the pipette) solution contained (in mM): 145 Cs glutamate; 8 NaCl; 1 MgCl2; 4 MgATP; 0.2 BAPTA; 10 HEPES adjusted to pH 7.2 with CsOH. CIF purified from LA-treated CD36-positive TBCs was included in the pipette solution to a dilution of 1:15. The ICRAC was recorded as the La3+-sensitive current obtained by subtraction of the La3+-resistant current from the total current. For the clarity of the figure showing average current ramps, only one point every 5 mV is shown.
Purification of CIF extract.
The CIF extract was purified as described by Smani et al. (18). The CD36-positive TBCs (10 × 106 cells/assay), treated or not with LA (20 μM) or TG (5 μM) for 15 minutes, were washed 3 times and resuspended in 0.85 ml HBSS. The suspension was extracted with 0.2 ml of 1 M HCl for 30 minutes at room temperature. After centrifugation, the supernatant was neutralized with 10 M NaOH, and 10 mM BaCl2 was added to precipitate compounds containing vicinal phosphates (including IP3). After centrifugation, the supernatant was lyophilized, and the residue was extracted with 0.8 ml methanol with continuous mixing for 15 minutes. The methanol extract was loaded onto a Sep-Pak Vac C18 cartridge, and the cartridge was washed with 0.8 ml methanol. The combined methanol eluates were dried at 30°C under a stream of nitrogen and resuspended in 100 μl of 0.1 M acetic acid. The reconstituted extract was clarified by centrifugal ultrafiltration through a Centricon 30 (Millipore). We used an additional step of purification of CIF by HPLC Partisil 10 SAX anion exchange 10 μm, 250 × 4.6 mm column (Keystone Scientific), and the elution was performed by a linear salt and pH gradient from 5 to 750 mM (NH4)H2PO4 and from pH 2.8 to 3.7, respectively (55). At concentrations as low as 1 μl, the CIF extract induced increases in [Ca2+]i in CD36-positive TBCs and other cells.
siRNA knockdown of STIM1, Orai1, Orai3, and PLA2 isoforms.
The CD36-positive TBCs were transfected with the siRNA ON-Target plus Smart pool (25 nM) designed against Orai1, Orai3, STIM1, different PLA2 isoforms, or non-targeting siRNA as a control (Dharmacon). The sequences of the STIM1/siRNA duplexes were as follows: 5′-GAAGUAGGCAGACUAGGGU-3′, 5′-AAACAUAGCACCUUCCAUG-3′, 5′-GAUCGGAGCCACAGGCAGA-3′, and 5′-UACAGUGGCUCAUUACGUA-3′. The sequences of the Orai1/siRNA duplexes were 5′-AAUAUAUUCACAAGGGACA-3′, 5′-UCACUAAACACCAGUCUUU-3′, 5′-GGAAAUGGCUCGGGGACAA-3′, and 5′-ACAUCGAGGCUGUGAGCAA-3′. The sequences of the Orai3/siRNA duplexes were 5′-GAUCCUUGGUUGCCCACAA-3′, 5′-GGAGAAGAUUCAGCCCUUA-3′, 5′-CUGUGGGACUAGGUGUUUAU-3′, and 5′-AGGUACAGCUGGAGAACGA-3′. The sequences of the PLA2 siRNA/duplex were as follows: PLA2 IIa, 5′-GCUUAGCUAUGCCUUCUAU-3′, 5′-ACUCAUGACUGUUGCUACA-3′, 5′-GAUCAUGGCCUUUGGCUCA-3′, 5′-GAACAUUGCGCAGUUUGGG-3′; PLA2 V, 5′-ACGGAACACAUGCGAUCUA-3′, 5′-GAGAUAUAUCAAUGGCGGA-3′, 5′-CAAGUCAUCUAUCGCUUUA-3′, 5′-UUGAGAAGGUGACCGGGAA-3′; PLA2 VI, 5′-GGUGCGAGAUGGUCGGCAU-3′, 5′-GCACCUGGCCAUGUCGAAA-3′, 5′-GCUCCAUGAGGGACGAGAA-3′, 5′-GGGCCAAGAACGCCGAGAU-3′; PLA2 IVc, 5′-CCUCUAUAAACACGGUAAA-3′, 5′-GGAAUGAGACCUCCGCAGA-3′, 5′-UAGAAGGACCAGUGACAUA-3′, 5′-AGAGAUUUGCUGAGGGUAU-3′. Twenty-four hours before treatment, the cells were placed in the culture medium without antibiotics and further transfected with siRNA by using DharmaFECT (Dharmacon). After 24-hour incubation, the medium was aspirated and replaced with fresh medium without siRNA for 48 hours before Ca2+ measurements or Western blot analysis.
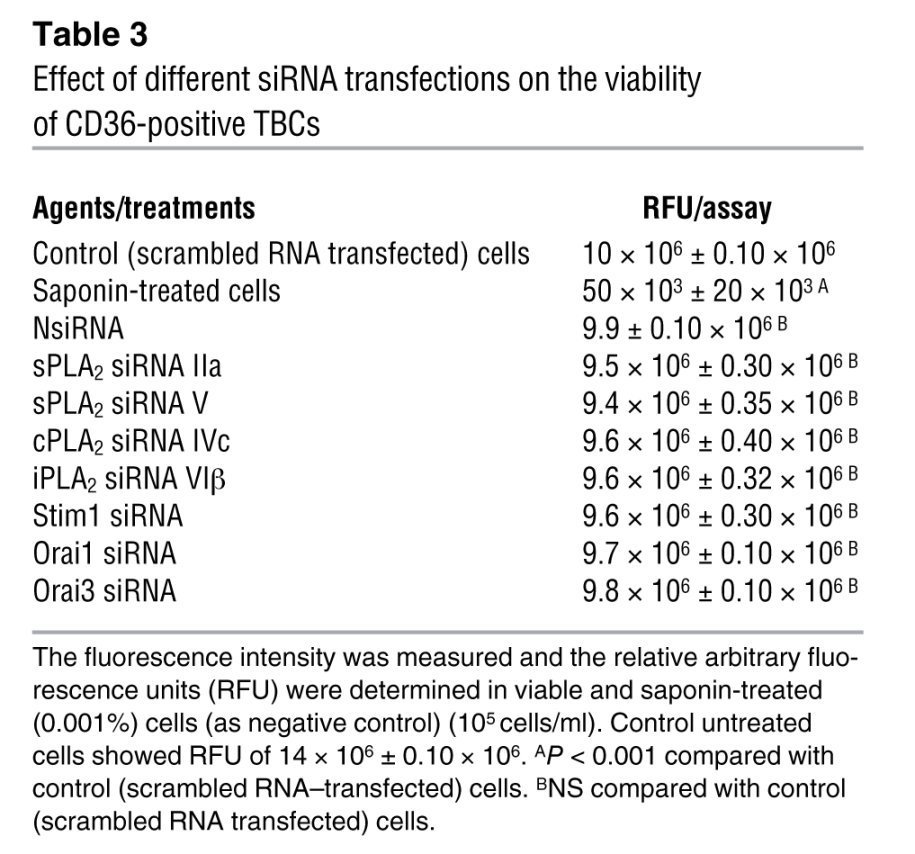
The cell viability was routinely checked by Blue Cell Viability Kit (Abnova). The assay kit utilizes the redox dye resazurin, which is transformed into a fluorescent molecule upon reduction by viable cells. The fluorescence intensity (excitation, 530 nm; emission, 600 nm) after an incubation step was measured in a plate reader, and the relative arbitrary fluorescence units (RFU) were determined, after 24 hours, in control and transfected or saponin-treated (0.001%; as negative control) cells. We observed that the transfection of CD36-positive TBCs by any of the siRNAs did not significantly reduce cell viability as compared with scrambled siRNA (Table 3). We obtained around 85% of viable cells after transfection by the Dharmacon kit (for example, control non-transfected cells, 12 × 106 ± 0.50 × 10⁶ RFU vs. control scrambled RNA–transfected cells, 10 × 106 ± 0.50 × 10⁶).
Table 3 .
Effect of different siRNA transfections on the viability of CD36-positive TBCs
Western blot detection of STIM1, Orai1, Orai3, and PLA2 isoforms.
After transfection and culture for 24 hours, the CD36-positive TBCs were lysed with 50 μl of buffer containing the following: 20 mM HEPES pH 7.3; 1 mM EDTA; 1 mM EGTA; 0.15 mM NaCl; 1% Triton X-100; 10% glycerol; 1 mM PMSF; 2 mM sodium orthovanadate and anti-protease cocktail (2 μl in 1 ml of buffer). After centrifugation (13 000 g, 1 minute), cells lysates were used immediately or stored at –20°C. The protein content was determined by bicinchoninic acid (Pierce). Denatured proteins (30 μg) were separated by SDS-PAGE (10%) and transferred to PVDF membranes, and immunodetection was performed by using anti-STIM1 (4 μg/ml), anti-Orai1 (2 μg/ml), or anti-Orai3 antibodies (4 μg/ml). For PLA2 detection, antibodies were used at a 1:2,000 dilution, and the proteins were revealed by secondary anti-goat antibodies. After treating the membranes with peroxidase-conjugated goat anti-mouse secondary antibodies, peroxidase activity was detected with ECL reagents (Amersham).
Mice deficient in STIM1 and Orai 1.
Mice homozygously deficient in Stim1 or Orai1 were generated from embryonic stem cell clones and germline transmission, as described elsewhere (19, 56). Because Stim1–/– and Orai1–/– mice showed growth retardation and early lethality, 3- to 5-week-old mice were used in the experiments and wild-type littermates were used as controls. There were no significant differences in the yield of CD36-positive TBCs between wild-type and Stim1–/– or Orai1–/– mice.
Induction of splenomegaly.
Mice were injected i.p. with a single dose of cadmium chloride (CdCl2) (1.8 mg/kg body weight) as per the protocol of Pathak and Khandelwal (57). Control mice were injected with the vehicle (NaCl 9 g/l). Animals were weighed before and after the study. Seventy-two hours after administration, animals were sacrificed, and their spleens were immediately dissected out, weighed, and examined under the microscope. We observed that cadmium increased spleen weight by 93% compared with the vehicle-injected mice.
Two-bottle preference test of lipid solution.
Spontaneous preference for lipid-enriched solutions was investigated by means of the 2-bottle preference test. The wild-type, Stim1–/–, or CdCl2-injected mice were first accustomed to water drinking in 2 bottles for a period of 24 hours. Then, the individually caged mice were allowed to choose between 0.1% colza oil emulsified in 0.3% xanthan gum in water or water with vehicle alone (0.3% xanthan gum) over a period of 12 hours. The water intake was determined by weighing the feeders.
Release of 3H-5-HT.
The release of 3H-5-HT was determined according to Khan et al. (58). In brief, CD36-positive TBCs were loaded with 3H-5-HT (2 mCi/3 × 108 cells) for 1 hour in the incubation buffer containing (in mM): 40 Tris-HCl (pH 7.4); 25 glucose; 5 KCl; 150 NaCI; 1.5 CaC12; 1.4 MgSO4; 1.2 ascorbate and 0.1 amino-oxyacetic acid at 37°C. At the end of incubations, the cells were washed by centrifugation (2,000 g, 5 minutes) in washing buffer (in mM): 150 NaCl, 5 KCl, 1.2 MgSO4, 1.0 ascorbate, 10 glucose, and 1.3 EGTA. Then, the cells were resuspended in release buffer containing clorgyline (100 μM) and pargyline (100 μM) in order to prevent 5-HT metabolism. The composition of the release buffer was identical to the washing buffer, except 2 mM CaCl2 was substituted for MgSO4, EGTA was omitted, NaCl concentration was reduced to 75 mM, and cells were distributed into new tubes and then treated with LA in the presence or absence of SSO for 30 minutes. After centrifugation, the radioactivity in the supernatant and the pellet was determined. 3H-5-HT release was calculated as percentage of unstimulated cells, by dividing the radioactivity of the supernatant by the radioactivity in pellet plus supernatant in each assay. The non-radioactive 5-HT was also detected by HPLC (8), and the values were corrected for the release of radioactive 5-HT.
Statistics.
Statistical analysis of data was carried out using Statistica (version 4.1, Statsoft). Data are presented as mean ± SEM. The significance of the differences between mean values was determined by 1-way ANOVA, followed by a least-significant-difference (LSD) test. For all the tests, the significance level chosen was P < 0.05.
Study approval.
All study protocols involving mice were conducted as per the Declaration of Helsinki and European ethical guidelines, and the protocols were approved by the Regional Ethical Committee (Dijon, France).
Acknowledgments
We thank J.F. Glatz, Cardiovascular Research Institute, Maastricht, The Netherlands, for the gift of SSO. This work was supported by contingent grants from the French Ministry of Higher Education and Research, and from Région Bourgogne (to N.A. Khan). We also acknowledge contingent grants from Agence Nationale pour la Recherche (ANR-07-PNRA-015 to P. Besnard). This work was also supported by the Burgundy Council and Centre National Interprofessionel de l’Economie Laitière (CNIEL) (HumanFATaste program to P. Besnard).
Footnotes
Conflict of interest: The authors have declared that no conflict of interest exists.
Citation for this article: J Clin Invest. 2012;122(6):2267–2282. doi:10.1172/JCI59953.
Naim Akhtar Khan’s present address is: Physiologie de la Nutrition et Toxicologie, UMR U866 INSERM/Université de Bourgogne/AgroSup, Dijon, France.
References
- 1.Chandrashekar J, Hoon MA, Ryba NJ, Zuker CS. The receptors and cells for mammalian taste. Nature. 2006;444(7117):288–294. doi: 10.1038/nature05401. [DOI] [PubMed] [Google Scholar]
- 2.Laugerette F, et al. CD36 involvement in orosensory detection of dietary lipids, spontaneous fat preference, and digestive secretions. J Clin Invest. 2005;115(11):3177–3184. doi: 10.1172/JCI25299. [DOI] [PMC free article] [PubMed] [Google Scholar]
- 3.Gaillard D, et al. The gustatory pathway is involved in CD36-mediated orosensory perception of long-chain fatty acids in the mouse. FASEB J. 2008;22(5):1458–1468. doi: 10.1096/fj.07-8415com. [DOI] [PubMed] [Google Scholar]
- 4.Khan NA, Besnard P. Oro-sensory perception of dietary lipids: new insights into the fat taste transduction. Biochim Biophys Acta. 2009;1791(3):149–155. doi: 10.1016/j.bbalip.2009.01.001. [DOI] [PubMed] [Google Scholar]
- 5.Kawai T, Fushiki T. Importance of lipolysis in oral cavity for orosensory detection of fat. Am J Physiol Regul Integr Comp Physiol. 2003;285(2):R447–R454. doi: 10.1152/ajpregu.00729.2002. [DOI] [PubMed] [Google Scholar]
- 6.Fukuwatari T, et al. Expression of the putative membrane fatty acid transporter (FAT) in taste buds of the circumvallate papillae in rats. FEBS Lett. 1997;414(2):461–464. doi: 10.1016/S0014-5793(97)01055-7. [DOI] [PubMed] [Google Scholar]
- 7.Sclafani A, Ackroff K, Abumrad NA. CD36 gene deletion reduces fat preference and intake but not post-oral fat conditioning in mice. Am J Physiol Regul Integr Comp Physiol. 2007;293(5):R1823–R1832. doi: 10.1152/ajpregu.00211.2007. [DOI] [PubMed] [Google Scholar]
- 8.El-Yassimi A, Hichami A, Besnard P, Khan NA. Linoleic acid induces calcium signaling, Src kinase phosphorylation, and neurotransmitter release in mouse CD36-positive gustatory cells. J Biol Chem. 2008;283(19):12949–12959. doi: 10.1074/jbc.M707478200. [DOI] [PubMed] [Google Scholar]
- 9.Dramane G, Akpona S, Simonin AM, Besnard P, Khan NA. Cell signaling mechanisms of gustatory perception of lipids: can the taste cells be the target of anti-obesity agents? Curr Med Chem. 2011;18(22):3417–3422. doi: 10.2174/092986711796504655. [DOI] [PubMed] [Google Scholar]
- 10. Gilbertson TA, Fontenot DT, Liu L, Zhang H, Monroe WT. Fatty acid modulation of K+ channels in taste receptor cells: gustatory cues for dietary fat. Am J Physiol. 1997. 272 4 pt 1 ) : C1203 C1210 [DOI] [PubMed] [Google Scholar]
- 11.Schiffman SS, Suggs MS, Losee ML, Gatlin LA, Stagner WC, Bell RM. Effect of lipid-derived second messengers on electrophysiological taste responses in the gerbil. Pharmacol Biochem Behav. ( 1995;2(1):49–58. doi: 10.1016/0091-3057(94)00429-m. [DOI] [PubMed] [Google Scholar]
- 12. Dennis EA. Diversity of group types, regulation, and function of phospholipase A2. J Biol Chem. 1994. 269 18 ) : 13057 13060 [PubMed] [Google Scholar]
- 13.Kudo I, Murakami M. Phospholipase A2 enzymes. . Prostaglandins Other Lipid Mediat. 2002;68–69:3–58. doi: 10.1016/s0090-6980(02)00020-5. [DOI] [PubMed] [Google Scholar]
- 14.Oike H, Matsumoto I, Abe K. Group IIA phospholipase A2 is coexpressed with SNAP-25 in mature taste receptor cells of rat circumvallate papillae. . J Comp Neurol. 2006;494(6):876–886. doi: 10.1002/cne.20848. [DOI] [PubMed] [Google Scholar]
- 15.Harmon CM, Abumrad NA. Binding of sulfosuccinimidyl fatty acids to adipocyte membrane proteins: isolation and amino-terminal sequence of an 88-kD protein implicated in transport of long-chain fatty acids. J Membr Biol. 1993;133(1):43–49. doi: 10.1007/BF00231876. [DOI] [PubMed] [Google Scholar]
- 16.Fierro L, Lund PE, Parekh AB. Comparison of the activation of the Ca2+ release-activated current ICRAC to InsP3 in Jurkat T-lymphocytes, pulmonary artery endothelia and RBL-1 cells. . Pflugers Arch. 2000;440(4):580–587. doi: 10.1007/s004240000336. [DOI] [PubMed] [Google Scholar]
- 17.Lewis RS. The molecular choreography of a store-operated calcium channel. Nature. 2007;446(7133):284–287. doi: 10.1038/nature05637. [DOI] [PubMed] [Google Scholar]
- 18.Smani T, Zakharov SI, Csutora P, Leno E, Trepakova ES, Bolotina VM. A novel mechanism for the store-operated calcium influx pathway. Nat Cell Biol. 2004;6(2):113–120. doi: 10.1038/ncb1089. [DOI] [PubMed] [Google Scholar]
- 19.Varga-Szabo D, et al. The calcium sensor STIM1 is an essential mediator of arterial thrombosis and ischemic brain infarction. J Exp Med. 2008;205(7):1583–1591. doi: 10.1084/jem.20080302. [DOI] [PMC free article] [PubMed] [Google Scholar]
- 20.Baba Y, Nishida K, Fujii Y, Hirano T, Hikida M, Kurosaki T. Essential function for the calcium sensor STIM1 in mast cell activation and anaphylactic responses. Nat Immunol. 2008;9(1):81–88. doi: 10.1038/ni1546. [DOI] [PubMed] [Google Scholar]
- 21.Beyersdorf N, et al. STIM1-independent T cell development and effector function in vivo. J Immunol. 2009;182(6):3390–3397. doi: 10.4049/jimmunol.0802888. [DOI] [PubMed] [Google Scholar]
- 22.Six DA, Dennis EA. The expanding superfamily of phospholipase A2 enzymes: classification and characterization. . Biochim Biophys Acta. 2000;1488(1–2):1–19. doi: 10.1016/s1388-1981(00)00105-0. [DOI] [PubMed] [Google Scholar]
- 23.Singer AG, et al. Interfacial kinetic and binding properties of the complete set of human and mouse groups I, II, V, X, and XII secreted phospholipases A2. . J Biol Chem. 2002;277(50):48535–48549. doi: 10.1074/jbc.M205855200. [DOI] [PubMed] [Google Scholar]
- 24.Murakami M, Masuda S, Kudo I. Arachidonate release and prostaglandin production by group IVC phospholipase A2 (cytosolic phospholipase A2gamma). . Biochem J. 2003;372(pt 3):695–702. doi: 10.1042/BJ20030061. [DOI] [PMC free article] [PubMed] [Google Scholar]
- 25.Wolf MJ, Gross RW. The calcium-dependent association and functional coupling of calmodulin with myocardial phospholipase A2. Implications for cardiac cycle-dependent alterations in phospholipolysis. . J Biol Chem. 1996;271(35):20989–20992. doi: 10.1074/jbc.271.35.20989. [DOI] [PubMed] [Google Scholar]
- 26.Jenkins CM, Wolf MJ, Mancuso DJ, Gross RW. Identification of the calmodulin-binding domain of recombinant calcium-independent phospholipase A2β. Implications for structure and function. . J Biol Chem. 2001;276(10):7129–7135. doi: 10.1074/jbc.M010439200. [DOI] [PubMed] [Google Scholar]
- 27.Mancuso DJ, Jenkins CM, Gross RW. The genomic organization, complete mRNA sequence, cloning, and expression of a novel human intracellular membrane-associated calcium-independent phospholipase A2. . J Biol Chem. 2000;275(14):9937–9945. doi: 10.1074/jbc.275.14.9937. [DOI] [PubMed] [Google Scholar]
- 28.Kuda O, et al. CD36 Protein is involved in store-operated calcium flux, phospholipase A2 Activation, and Production of Prostaglandin E2. . J Biol Chem. 2011;286(20):17785–17795. doi: 10.1074/jbc.M111.232975. [DOI] [PMC free article] [PubMed] [Google Scholar]
- 29.Liu Y, et al. Laminar flow activates peroxisome proliferator-activated receptor-gamma in vascular endothelial cells. Circulation. 2004;110(9):1128–1133. doi: 10.1161/01.CIR.0000139850.08365.EC. [DOI] [PubMed] [Google Scholar]
- 30.Caro AA, Cederbaum AI. Role of intracellular calcium and phospholipase A2 in arachidonic acid-induced toxicity in liver cells overexpressing CYP2E1. . Arch Biochem Biophys. 2007;457(2):252–263. doi: 10.1016/j.abb.2006.10.018. [DOI] [PMC free article] [PubMed] [Google Scholar]
- 31.Tsumoda Y, Owayng C. Differential involvement of phospholipase A2/arachidonic acid and phospholipase C/phosphoinositol pathways during cholecystokinin receptor activated Ca2+ oscillations in pancreatic acini. . Biochem Biophys Res Commun. 1993;194(3):1194–1202. doi: 10.1006/bbrc.1993.1949. [DOI] [PubMed] [Google Scholar]
- 32.TÖrnquist K, Ekokoski E, Forss L. Thapsigargin-induced calcium entry in FRTL-5 cells: possible dependence on phospholipase A2 activation. . J Cell Physiol. 1994;160(1):40–46. doi: 10.1002/jcp.1041600106. [DOI] [PubMed] [Google Scholar]
- 33.Suh HN, Huong HT, Song CH, Lee JH, Han HJ. Linoleic acid stimulates gluconeogenesis via Ca2+/PLC, cPLA2, and PPAR pathways through GPR40 in primary cultured chicken hepatocytes. . Am J Physiol Cell Physiol. 2008;295(6):C1518–C1527. doi: 10.1152/ajpcell.00368.2008. [DOI] [PubMed] [Google Scholar]
- 34.Hichami A, Joshi B, Simonin AM, Khan NA. Role of three isoforms of phospholipase A2 in capacitative calcium influx in human T-cells. . Eur J Biochem. 2002;269(22):5557–5563. doi: 10.1046/j.1432-1033.2002.03261.x. [DOI] [PubMed] [Google Scholar]
- 35.Roudbaraki MM, Drouhault R, Bacquart T, Vacher P. Arachidonic acid-induced hormone released in somatotropes: involvement of calcium. Neuroendocrinology. 1996;63(3):244–256. doi: 10.1159/000126964. [DOI] [PubMed] [Google Scholar]
- 36.Mignen O, Thompson JL, Shuttleworth TJ. Ca2+ selectivity and fatty acid specificity of the noncapacitative, arachidonate-regulated Ca2+ (ARC) channels. . J Biol Chem. 2003;278(12):10174–10181. doi: 10.1074/jbc.M212536200. [DOI] [PubMed] [Google Scholar]
- 37.Boittin FX, Shapovalov G, Hirn C, Ruegg UT. Phospholipase A2-derived lysophosphatidylcholine triggers Ca2+ entry in dystrophic skeletal muscle fibers. . Biochem Biophys Res Commun. 2010;391(1):401–406. doi: 10.1016/j.bbrc.2009.11.070. [DOI] [PubMed] [Google Scholar]
- 38.Ramdriamampita C, Tsien RY. Emptying of intracellular Ca2+ stores releases a novel small messenger that stimulates Ca2+ influx. . Nature. 1993;364(6440):809–814. doi: 10.1038/364809a0. [DOI] [PubMed] [Google Scholar]
- 39.Bolotina VM, Csutora P. CIF and other mysteries of the store-operated Ca2+-entry pathway. . Trends Biochem Sci. 2005;30(7):378–387. doi: 10.1016/j.tibs.2005.05.009. [DOI] [PubMed] [Google Scholar]
- 40.Mercer JC, et al. Large store-operated calcium selective currents due to co-expression of Orai1 or Orai2 with the intracellular calcium sensor, Stim1. J Biol Chem. 2006;281(34):24979–24990. doi: 10.1074/jbc.M604589200. [DOI] [PMC free article] [PubMed] [Google Scholar]
- 41.Potier M, Trebak M. New developments in the signaling mechanisms of the store-operated calcium entry pathway. Pflugers Arch. 2008;457(2):405–415. doi: 10.1007/s00424-008-0533-2. [DOI] [PMC free article] [PubMed] [Google Scholar]
- 42.Bolotina VM. Orai, STIM1 and iPLA2 β: a view from a different perspective. . J Physiol. 2008;586(13):3035–3042. doi: 10.1113/jphysiol.2008.154997. [DOI] [PMC free article] [PubMed] [Google Scholar]
- 43.Shuttleworth TJ. Arachidonic acid, ARC channels, and Orai proteins. Cell Calcium. 2009;45(6):602–610. doi: 10.1016/j.ceca.2009.02.001. [DOI] [PMC free article] [PubMed] [Google Scholar]
- 44.Mignen O, Thompson JL, Shuttleworth TJ. The molecular architecture of the arachidonate-regulated Ca2+-selective ARC channel is a pentameric assembly of Orai1 and Orai3 subunits. . J Physiol. 2009;587(pt 17):4181–4197. doi: 10.1113/jphysiol.2009.174193. [DOI] [PMC free article] [PubMed] [Google Scholar]
- 45.Liou J, et al. STIM is a Ca2+ sensor essential for Ca2+-store-depletion-triggered Ca2+ influx. . Curr Biol. 2005;15(13):1235–1241. doi: 10.1016/j.cub.2005.05.055. [DOI] [PMC free article] [PubMed] [Google Scholar]
- 46.Li Z, Lu J, Xu P, Xie X, Chen L, Xu T. Mapping the interacting domains of STIM1 and Orai1 in Ca2+ release-activated Ca2+ channel activation. . J Biol Chem. 2007;282(40):29448–29456. doi: 10.1074/jbc.M703573200. [DOI] [PubMed] [Google Scholar]
- 47.Csutora P, et al. Novel role for STIM1 as a trigger for calcium influx factor production. J Biol Chem. 2008;283(21):14524–14531. doi: 10.1074/jbc.M709575200. [DOI] [PMC free article] [PubMed] [Google Scholar]
- 48.Soboloff J, Spassova MA, Tang XD, Hewavitharana T, Xu W, Gill DL. Orai1 and STIM reconstitute store-operated calcium channel function. J Biol Chem. 2006;281(30):20661–20665. doi: 10.1074/jbc.C600126200. [DOI] [PubMed] [Google Scholar]
- 49.Chang WC, Parekh AB. Close functional coupling between Ca2+ release-activated Ca2+ channels, arachidonic acid release, and leukotriene C4 secretion. . J Biol Chem. 2004;279(29):29994–29999. doi: 10.1074/jbc.M403969200. [DOI] [PubMed] [Google Scholar]
- 50.Stewart JE, Newman LP, Keast RS. Oral sensitivity to oleic acid is associated with fat intake and body mass index. Clin Nutr. 2011;30(6):838–844. doi: 10.1016/j.clnu.2011.06.007. [DOI] [PubMed] [Google Scholar]
- 51.Pepino MY, Love-Gregory L, Klein S, Abumrad NA. The fatty acid translocase gene, CD36, and lingual lipase influence oral sensitivity to fat in obese subjects. J Lipid Res. 2012;53(3):561–566. doi: 10.1194/jlr.M021873. [DOI] [PMC free article] [PubMed] [Google Scholar]
- 52.Grynkiewicz G, Poenie M, Tsien RY. A new generation of Ca2+ indicators with greatly improved fluorescence properties. . J Biol Chem. 1985;260(6):3440–3450. [PubMed] [Google Scholar]
- 53.Hamill OP, Marty A, Neher E, Sakmann B, Sigworth FJ. Improved patch-clamp techniques for high resolution current recording from cells and cell-free membranes patches. Pflugers Arch. 1981;391(2):85–100. doi: 10.1007/BF00656997. [DOI] [PubMed] [Google Scholar]
- 54.Chouabe C, et al. Reduction of I(Ca,L) and I(to1) density in hypertrophied right ventricular cells by simulated high altitude in adult rats. J Mol Cell Cardiol. 1997;29(1):193–206. doi: 10.1006/jmcc.1996.0264. [DOI] [PubMed] [Google Scholar]
- 55.Trepakova ES, Csutora P, Hunton DL, Marchase RB, Cohen RA, Bolotina VM. Calcium influx factor directly activates store-operated cation channels in vascular smooth muscle cells. J Biol Chem. 2000;275(34):26158–26163. doi: 10.1074/jbc.M004666200. [DOI] [PubMed] [Google Scholar]
- 56.Braun A, et al. Orai1 (CRACM1) is the platelet SOC channel and essential for pathological thrombus formation. Blood. 2009;113(9):2056–2063. doi: 10.1182/blood-2008-07-171611. [DOI] [PubMed] [Google Scholar]
- 57.Pathak N, Khandelwal S. Immunomodulatory role of piperine in cadmium induced thymic atrophy and splenomegaly in mice. Environ Toxicol Pharmacol. 2009;28(1):52–60. doi: 10.1016/j.etap.2009.02.003. [DOI] [PubMed] [Google Scholar]
- 58.Khan NA, Moulinoux JP, Deschaux P. Putrescine modulation of depolarization-induced [3H]serotonin release from fish brain synaptosomes. Neurosci Lett. 1996;212(1):45–48. doi: 10.1016/0304-3940(96)12778-6. [DOI] [PubMed] [Google Scholar]